Abstract
The purpose of this study is to provide a novel approach for measuring the spatial distribution of wall shear stress (WSS) in common carotid artery in vivo. WSS distributions were determined by digital image processing from color Doppler flow imaging (CDFI) in 50 healthy volunteers. In order to evaluate the feasibility of the spatial distribution, the mean values of WSS distribution were compared to the results of conventional WSS calculating method (Hagen–Poiseuille formula). In our study, the mean value of WSS distribution from 50 healthy volunteers was (6.91 ± 1.20) dyne/cm2, while it was (7.13 ± 1.24) dyne/cm2 by Hagen–Poiseuille approach. The difference was not statistically significant (t = −0.864, p = 0.604). Hence, the feasibility of the spatial distribution of WSS was proved. Moreover, this novel approach could provide three-dimensional distribution of shear stress and fusion image of shear stress with ultrasonic image for each volunteer, which made WSS “visible”. In conclusion, the spatial distribution of WSS could be used for WSS calculation in vivo. Moreover, it could provide more detailed values of WSS distribution than those of Hagen–Poiseuille formula.
Electronic supplementary material
The online version of this article (doi:10.1007/s10278-012-9505-3) contains supplementary material, which is available to authorized users.
Keywords: Atherosclerosis, Common carotid artery, Wall shear stress, Color Doppler flow imaging, DICOM
Introduction
The shear stress of arterial blood flow at the endothelium has long been known to influence atherosclerosis. Molecular biological studies have shown that a low average level, large gradients, and high oscillation of wall shear stress (WSS) contribute to atherosclerosis [1–3]. Therefore, the triggering of atherosclerosis by WSS is widely acknowledged. In previous investigations, the Hagen–Poiseuille approach was used for the WSS measurement. It is applicable in large arteries with cylindrical tube and rigid wall such as common carotid artery (CCA). This is an attractive method due to its simplicity. Several techniques have been used in clinical practice. Efstathopoulos et al. [4] measured the systolic and diastolic arterial WSS in the ascending aorta by the Hagen–Poiseuille formula. Gnasso et al. [5] investigated the relationship between the intima–media thickness and the WSS in CCA using the Hagen–Poiseuille formula. However, this approach can only be used to assess the average level of WSS. It is also difficult to obtain the spatial distribution of WSS along the blood vessel and identify the specific locations where abnormal WSS exists by the Hagen–Poiseuille approach. In consideration of the complexity and individual variation of human arteries, it is necessary to measure and analyze regional WSS in the arterial system in vivo. Such measurement is important for investigating the regional development of vascular disease, since both high and low wall shear stresses have been cited as factors leading to vessel wall anomalies [6].
We have established an experimental program named “shear stress quantitative analysis software” in our laboratory. This program is designed to obtain the spatial distribution of WSS along the blood vessel and identify the specific locations where abnormal WSS exists. The purpose of this study is to measure the spatial distribution of WSS in CCA of healthy subjects in vivo by the experimental program. In order to evaluate the feasibility of this novel approach, the mean values of WSS distribution were compared with the results of Hagen–Poiseuille formula.
Methods
Algorithm
Wall Shear Stress Calculation from Color Doppler Flow Imaging
Arterial shear stress at the endothelium was measured by Eq. 1 with the assumption that blood is a Newtonian fluid [7–9].
 |
1 |
In this equation, τw is wall shear stress, which is the shear stress near the vessel wall. μ is blood viscosity.  is velocity gradient (or shear rate). r = wall means that r is near the boundary of tube. In order to calculate the spatial distribution of shear stress at the vessel wall, it is necessary to: (1) make an accurate distinction between the vessel wall and blood flow; (2) estimate the blood flow velocity gradient near the vessel wall. In our study, color Doppler flow imaging (CDFI) was used to measure the spatial distribution of shear stress. CDFI can indicate the level of blood flow velocity at each color pixel by a RGB value. The relationship of the RGB value with the flow velocity level is represented by a color bar. The blood flow velocity at each pixel can be computed based on the color bar. CDFI has a high spatial resolution (pixel spacing: 0.085 × 0.085 mm). The color pixels near the vessel wall are convenient to make a distinction between the blood flow and the vessel wall. Hence, the shear rate
  can be calculated by using the following equation (see Eq. 2):
 |
2 |
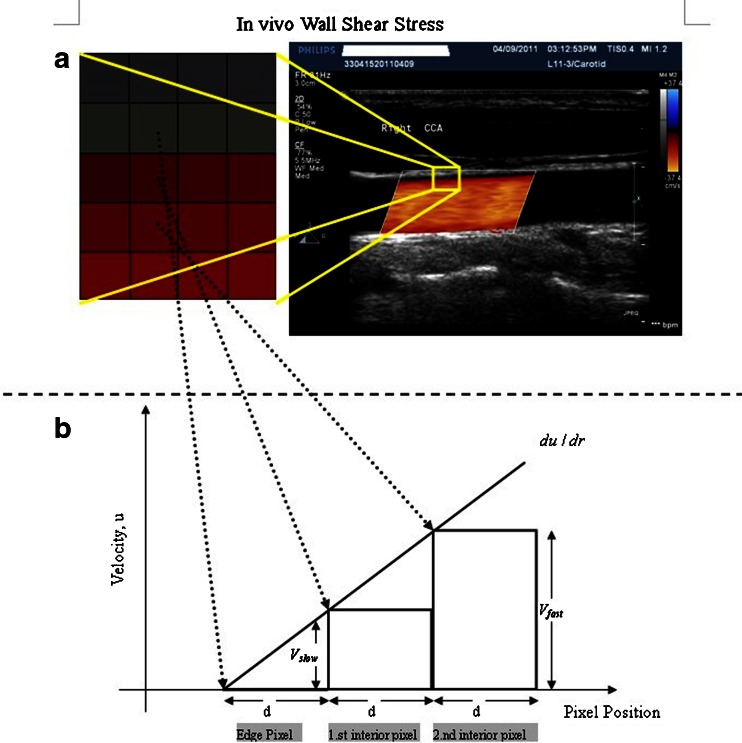
As shown in Fig. 1, Vslow is the velocity of the first blood flow pixel close to the vessel wall in the direction perpendicular to blood flow, and Vfast is the velocity of the second pixel. In Eq. 2, dr is represented by d because the distance between the two adjacent pixels is constant (the distance of one pixel). The velocity gradient at the vessel wall is calculated based on multiple values of Vfast and Vslow. Therefore, the shear rate could be calculated from the velocity profile by using Eq. 2 under the assumption as mentioned. Shear stress can be obtained from shear rate calculated by multiplying blood viscosity, which is 3.0 cP in this study.
Fig. 1.
The principle of shear stress calculation in color Doppler flow imaging. To the right of a is a color Doppler flow image. To the left is a pixel matrix magnified from the yellow squares near the vessel wall. b Graphical representation of the calculation for shear stress. The edge pixel is defined by the gray pixel which represents the vessel wall. The velocity of the edge pixel is 0. The 1.st interior pixel is defined by the first red pixel near the lumen. The red color represents the velocity of this pixel. The 2.nd interior pixel is defined by the second red pixel near the lumen. The red color of the 1.st interior pixel is defined as Vslow, and the 2.nd interior pixel is defined as Vfast, because the red color of the 2.nd interior pixel is brighter than that of the first one. The distance between each pixel is defined as d. Hence, du/dr can be changed into (Vfast–Vslow)/d in color Doppler flow imaging
Program of Shear Stress Calculation
After DICOM importing, the spatial distribution of shear stress was generated by running the following steps: (1) Get the flow velocity range from the color bar. (2) Select the Region of Interest (ROI). (3) Filter the vessel wall. (4) Change Doppler color pixels into velocity values. (5) Calculate WSS with Eq. 2. (6) Draw the three-dimensional distribution of shear stress and the fused image. (7) Provide WSS spatial distribution data. (8) Save images and videos as JPG and AVI format. Save data as .XLS format.
We designed three methods to show the spatial distribution of shear stress: (1) Two-dimensional distribution of shear stress; (2) Three-dimensional distribution of shear stress; (3) Fusion of shear stress with ultrasonic images. The low shear stress values were represented as blue in color, and the high values were red in the fusion image and two-dimensional distribution of shear stress.
In Vivo Measurements
Fifty healthy young volunteers were randomly selected and tested in the study (mean age 26.4 ± 3.47 years, range 20–35 years; 32 males). None of them had any history of cardiovascular disease, hypertension, diabetes, or long-term smoking. The Ethics Committee of the Shanghai East Hospital approved the study. The volunteers were enrolled with consent. Before the ultrasound examination, the volunteers were allowed for rest at a supine position for 10 min. Volunteers were studied in the supine position using the Philips IE33 system (Philips Medical Systems, Andover, MA, USA) with a L11-3 linear array transducer. The scan depth was set just below the visualization of the CCA. In Doppler mode, seven parameters had to be set to acquire a qualified CDFI. “Steer Angle” was adjusted to fully display the Doppler blood flow in vessel. “Color Scale” was set as low as possible so that the Doppler blood flow could fill with the lumen in diastolic period, which should be above the threshold that causes aliasing or overflow of color pixels. “Color gain” was set about 70–80 % so that no blooming of the color pixels was found. “Wall filter” was set as “Med”, “Persistence” was “Low”, “Color priority” was “Med”, and “Sensitivity” was “Med” in all subjects. Then, a smooth and uniform color Doppler flow video was obtained. The DICOM files (image matrix, 600 × 800; pixel spacing, 0.085 × 0.085 mm) were imported into the experimental program utilizing MATLAB (The Mathworks Inc. Natick, MA, USA). This program could implement shear stress analyses and produce graphic outputs on a personal computer.
All WSS data were run with Microsoft Excel and SPSS 17.0 software (SPSS Inc., Chicago, IL, USA). The mean values of WSS distribution from 50 volunteers were compared to those calculated by Hagen–Poiseuille formula (see Eq. 3) using the t test method.
 |
3 |
Where τw is wall shear stress, μ is blood viscosity, um is the highest velocity of flow (velocity at the center of the lumen), and R is the inner radius of the lumen.
Results
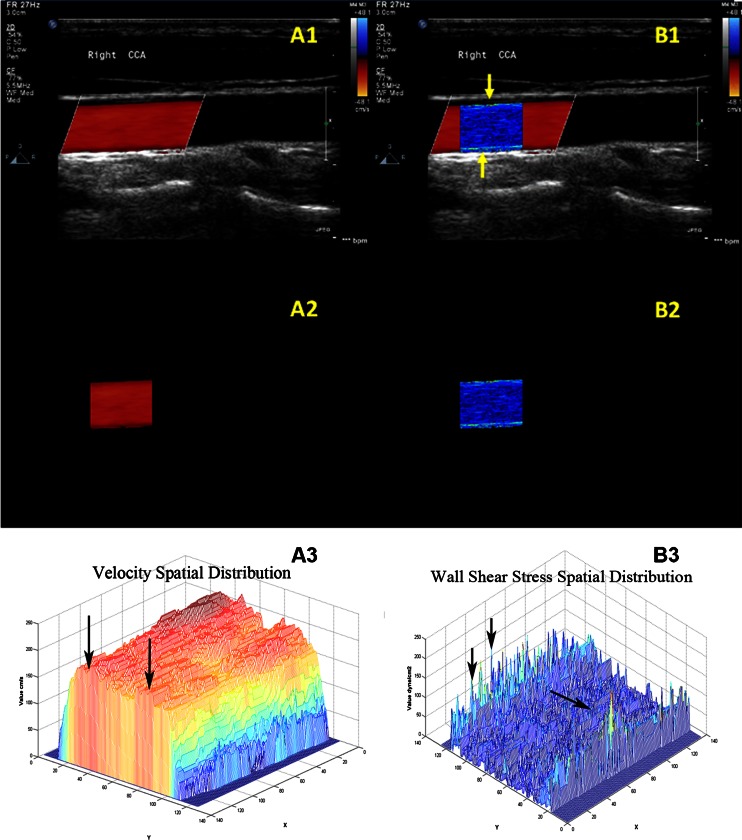
The imaging program provided ultrasonic images, three-dimensional velocity profiles, two-dimensional and three-dimensional distribution of shear stress, and fusion image of shear stress with ultrasonic image for every volunteer. It made WSS in CCA “visible” through the spatial distribution. Figure 2 represents the typical result from one of the volunteers.
Fig. 2.
The spatial distribution of shear stress produced by special designed program. A1 and B1 were the CDFI of CCA and the fusion image of shear stress distribution with ultrasonic image. A2 and B2 were the segmented CDFI of CCA and the two-dimensional distribution of shear stress. A3 and B3 were the three-dimensional distribution of blood velocity profile in CCA and the three-dimensional distribution of shear stress
Graphic Outputs of Shear Stress Quantitative Analysis Software
The CDFI of CCA on longitudinal section was shown in Fig. 2(A1). Doppler flow filled with the lumen without overflow in the diastolic period. Meanwhile, Doppler flow was not influenced by image noise. The segmented CDFI of CCA was shown in Fig. 2(A2). The blood vessel was deleted from CDFI using digital image processing technology. Only Doppler blood flow remained. Figure 2(A2) showed that the edge of Doppler blood flow was reserved completely. There was no loss in the process of image segmentation. The three-dimensional distribution of blood velocity profile in CCA was shown in Fig. 2(A3). Where X- and Y-axis represented pixel coordinates. Z-axis represented the blood flow velocity distribution. The distribution of velocity was a rough parabolic pattern. However, the maximum velocity was not at the center of the lumen, but at the location marked by the arrow in Fig. 2(A3). Hence, Hagen–Poiseuille formula could cause errors when selecting the maximum blood velocity at the center of blood vessel.
The fusion image of shear stress distribution with ultrasonic image was shown in Fig. 2(B1). Two bright WSS distributions were located near the anterior and posterior wall of the CCA (marked by yellow arrows). The WSS distributions of healthy CCA were relatively coarse and uniform. It proved that the imaging program was able to provide a visualized method for WSS analyses. The fusion image could help physicians observe the relationship between the WSS distribution and the vessel wall. The two-dimensional distribution of shear stress was shown in Fig. 2(B2). Since all factors unrelated to shear stress were removed, the two-dimensional distribution of shear stress could be utilized for the quantitative analysis. Because each pixel of WSS in the two-dimensional distribution was analyzed, the mean value of WSS distribution was not affected by the measured error of blood diameter or velocity. The three-dimensional distribution of shear stress was shown in Fig. 2(B2). The unit of the X- and Y-axis was the number of pixel, and that of Z-axis was dyne per square centimeter. The three-dimensional distribution of shear stress was low at the center (marked by single arrow) and high near the wall (marked by double arrow). The three-dimensional distribution suggested that the values of WSS at different locations were different despite having the same algorithm. If the local WSS was abnormal, the three-dimensional distribution would alert us sensitively and show us the location of abnormal WSS.
WSS Analyses of Shear Stress Quantitative Analysis Software
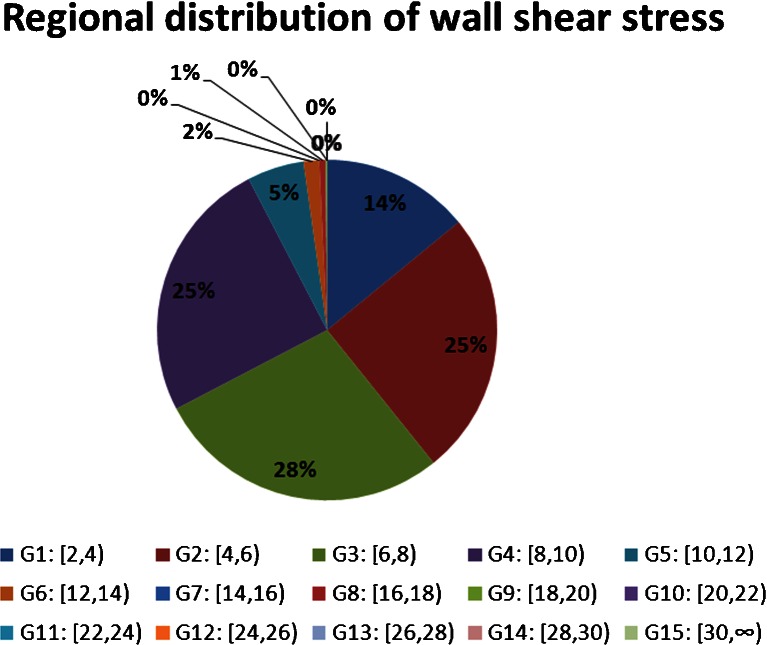
The detailed values of WSS in CCA were classified into 15 groups from 2 to 30 dyne/cm2 since WSS in CCA ranges in 2–26 dyne/cm2 [10]. They were arranged as group 1: [2, 4) dyne/cm2, group 2: [4, 6) dyne/cm2… group 14: [28, 30) dyne/cm2, group 15: [30, ∞) dyne/cm2. These 15 groups were used to show the proportion of different range in the overall WSS near the vessel wall. The typical WSS analysis from one of the volunteers was represented as the pie chart in Fig. 3. It showed that the largest proportion of WSS in healthy subjects was 4–10dyne/cm2. Twenty-five percent of WSS varied in 4–6 dyne/cm2, 28 % in 6–8 dyne/cm2, and 25 % in 8–10 dyne/cm2. The mean value of WSS distribution from this subject was (6.22 ± 2.73) dyne/cm2. The result of Hagen–Poiseuille formula was 6.63 dyne/cm2. The difference between them was not statistically significant (t = −0.461, p = 0.647). In addition, there were 8 % of WSS varied in 10–18dyne/cm2, which was higher than the normal range (4–10 dyne/cm2). These high values were difficult to discover by Hagen–Poiseuille formula, but could be displayed by the three-dimensional distribution of shear stress (marked by double arrow). The fusion image showed that the local vessel wall were normal for the high values of WSS.
Fig. 3.
Pie chart of the regional distribution of wall shear stress. The WSS values in CCA were arranged as 15 groups. The percentage of each group represented the proportion of defined values range inside the total amount of WSS
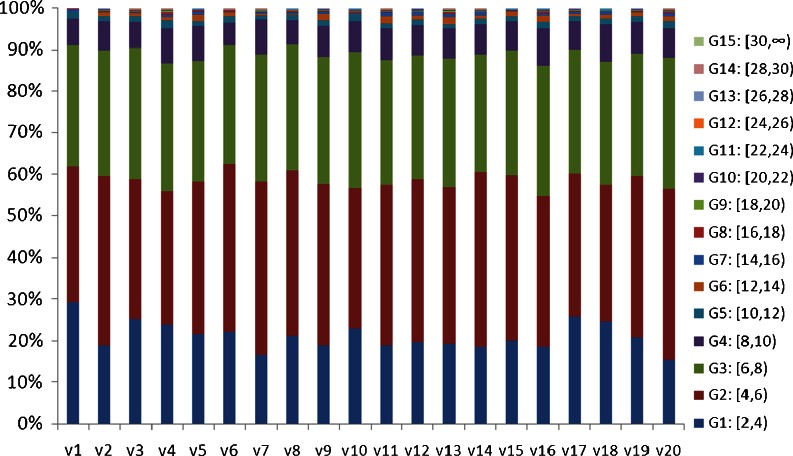
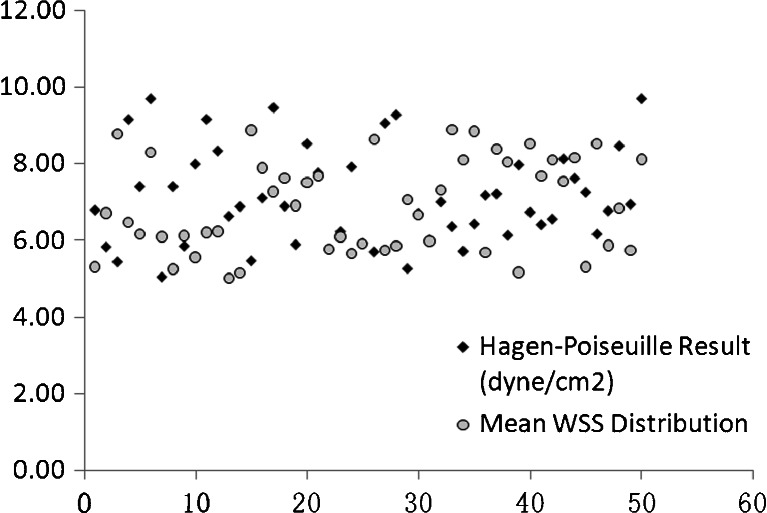
The proportions of WSS among 20 randomly selected volunteers were shown in Fig. 4. It showed that over 50 % of the WSS varied in 4–8dyne/cm2, and only 10 % of WSS was higher than 8 dyne/cm2. The scatter diagram of the mean values from WSS distribution and Hagen–Poiseuille formula among 50 subjects were shown at Fig. 5. It showed that the mean values of WSS calculated from two methods varied in 6–10 dyne/cm2. The mean value of WSS distribution among 50 cases of normal CCA was (6.91 ± 1.20) dyne/cm2, while it was 7.13 ± 1.24 dyne/cm2 by Hagen–Poiseuille formula. The difference was not statistically significant (t = −0.864, p = 0.604). It indicated the mean value of WSS distribution was similar to that of Hagen–Poiseuille formula. Hence, it was proved that the spatial distribution of WSS was able to measure the value of WSS in arterial blood flow.
Fig. 4.
The percentages of the defined WSS groups among 20 volunteers
Fig. 5.
The comparison between mean WSS values calculated from WSS distribution and the Hagen–Poiseuille approach. The mean values of WSS calculated from the two methods varied in 6–10 dyne/cm2
Discussion
WSS has been characterized intensively in vitro studies, which has documented a statistical correlation between atherosclerosis and specific WSS conditions in molecular biology [11, 12]. Previous in vivo investigations have reported that the atheromatous plaque always appeared at the local position along carotid artery [13]. Hence, accurate regional measurement of WSS is important to predict the regional development of vascular disorders. But the Hagen–Poiseuille approach is difficult to obtain the spatial distribution of shear stress along the blood vessel and identify the specific locations where abnormal WSS exists [14]. Several investigations about the distribution of shear stress have been reported. Fukumoto et al. [15] assessed the relationship between shear stress distribution and coronary plaque rupture with three-dimensional intravascular ultrasound. Wellnhofer et al. [16] characterized patterns of local wall shear stress associated with distinct types of remodeling in coronary arteries.
We designed an experimental program for measuring the spatial distribution of shear stress in CCA through CDFI in vivo. It is known that WSS can be assessed with ultrasound or magnetic resonance imaging. We chose ultrasound because the vessel wall boundary could be identified with good image quality in CDFI. MRI was limited in assessment of blood flow velocity because its spatial resolution is low (MRI pixel space, 0.5–1 mm), since maximal shear stress is at a distance of 250 to 300 μm from the vascular wall [17–19]. Moreover, it is difficult to identify the boundary of vessel wall in MRI because both vessel pixels and velocity pixels are gray scale. In CDFI, the color pixels represent blood flow while gray pixels stand for vessel wall. This feature demonstrates that the vessel pixels do not contribute to the blood velocity nearby. Therefore, complex information such as velocity profiles along vessel wall is available through CDFI. When gray pixels in the ultrasonic image were properly suppressed, it was possible to precisely measure the flow velocity near the vessel wall.
Three-dimensional distribution of shear stress could be rotated freely if necessary. It showed that the spatial distribution of shear stress was low at the center and high near the vessel wall. It also showed that the values of WSS varied with different locations, suggesting that the WSS values changed along the vessel wall even in normal CCA. Fusion of shear stress distribution with ultrasonic image could be used to observe the relationship between the abnormal WSS and the situation of local blood vessel. The fusion image in our study showed that the WSS distribution of anterior and posterior wall was not entirely consistent. It indicated that WSS had its variation range though they were under the similar diameter and velocity condition. However, the difference was impossible to discover with the Hagen–Poiseuille approach.
Figure 3 represented the WSS analysis from one volunteer. It showed that the percentage in 4–10 dyne/cm2 was the largest (78 %). It indicated that the WSS values ranging from 4 to 10 dyne/cm2 in CCA were the widest range. In addition, there were 8 % of WSS higher than the normal range (4–10 dyne/cm2). These high values were difficult to discover by Hagen–Poiseuille formula, but could be displayed by the three-dimensional distribution of shear stress (marked by double arrow). It implied that the Hagen–Poiseuille approach was not sufficient to evaluate detailed distribution of shear stress. The pie chart analysis of shear stress in our program might be a practical modality and would provide a more accurate analysis for WSS in CCA.
Because the direction of blood flow is steady in CCA, and the lumen is relatively coarse and uniform, the blood flow in CCA is close to Poiseuille flow [17]. The WSS in CCA calculated from Hagen–Poiseuille formula is approximately accurate. Now many literatures have reported the clinical application with the Hagen–Poiseuille formula. Hence, we believe it is applicable to compare the mean values of WSS distribution with those by Hagen–Poiseuille formula in order to evaluate the feasibility of our novel approach. The comparison between the mean values from WSS distribution and the results from Hagen–Poiseuille approach were similar (t = −0.864, p = 0.604). It suggested that the mean WSS value calculated from spatial distribution was feasible. Although the spatial distribution of shear stress is more complex than the Hagen–Poiseuille formula, it provided a visualization tool to observe WSS and related vessel wall.
Conclusion
In conclusion, this study presented a novel method for analyzing the spatial distribution of WSS which also provided detailed location-dependent WSS. It was proved that the spatial distribution of WSS in CCA was feasible through the comparison with the conventional WSS calculation method—Hagen–Poiseuille formula. This novel method can hopefully present more accurate and detailed values of regional WSS near vessel walls to predict atherosclerosis.
Electronic Supplementary Material
(WMV 661 kb)
Acknowledgments
The study was financed by the fund of scientific and technological development in Pudong New District of Shanghai, China (no. PKJ2010-Y16) and the fund for cardiovascular diseases in Pudong New District of Shanghai, China (No. PWZxkq).
References
- 1.Busse R, Fleming I. Pulsatile stretch and shear stress: physical stimuli determining the production of endothelium-derived relaxing factors. J Vasc Res. 1998;35:73–84. doi: 10.1159/000025568. [DOI] [PubMed] [Google Scholar]
- 2.Koller A, Kaley G. Shear stress dependent regulation of vascular resistance in health and disease: role of endothelium. Endothelium. 1996;4:247–272. doi: 10.3109/10623329609024701. [DOI] [Google Scholar]
- 3.Reneman RS, Arts T, Hoeks AP. Wall shear stress– an important determinant of endothelial cell function and structure–in the arterial system in vivo. Discrepancies with theory. J Vasc Res. 2006;43:251–269. doi: 10.1159/000091648. [DOI] [PubMed] [Google Scholar]
- 4.Efstathopoulos EP, Patatoukas G, Pantos I, Benekos O, Katritsis D, Kelekis NL. Measurement of systolic and diastolic arterial wall shear stress in the ascending aorta. Phys Med. 2008;24:196–203. doi: 10.1016/j.ejmp.2008.02.001. [DOI] [PubMed] [Google Scholar]
- 5.Gnasso A, Carallo C, Irace C, Spagnuolo V, De Novara G, Mattioli PL, Pujia A. Association between intima-media thickness and wall shear stress in common carotid arteries in healthy male subjects. Circulation. 1996;94:3257–3262. doi: 10.1161/01.CIR.94.12.3257. [DOI] [PubMed] [Google Scholar]
- 6.Oshinski JN, Curtin JL, Loth F. Mean-average wall shear stress measurements in the common carotid artery. J Cardiovasc Magn Reson. 2006;8:717–722. doi: 10.1080/10976640600723839. [DOI] [PubMed] [Google Scholar]
- 7.Milnor W. Hemodynamics. Philadelphia: Williams & Wilkins; 1982. [Google Scholar]
- 8.Nichols W, O'Rourke M. McDonald's blood flow in arteries: Theoretical, experimental and clinical principles. London: Hodder Arnold; 2005. [Google Scholar]
- 9.Shames IH. Mechanics of fluids. Boston: McGraw-Hill; 2003. [Google Scholar]
- 10.Reneman RS, Vink H, Hoeks A. Wall shear stress revisited. Artery Res. 2009;3:73–78. doi: 10.1016/j.artres.2009.02.005. [DOI] [Google Scholar]
- 11.Chien S, Li S, Shyy YJ. Effects of mechanical forces on signal transduction and gene expression in endothelial cells. Hypertension. 1998;31:162–169. doi: 10.1161/01.HYP.31.1.162. [DOI] [PubMed] [Google Scholar]
- 12.Irace C, Carallo C, Crescenzo A, Motti C, De Franceschi MS, Mattioli PL, Gnasso A. NIDDM is associated with lower wall shear stress of the common carotid artery. Diabetes. 1999;48:193–197. doi: 10.2337/diabetes.48.1.193. [DOI] [PubMed] [Google Scholar]
- 13.Brands PJ, Hoeks AP, Hofstra L, Reneman RS. A noninvasive method to estimate wall shear rate using ultrasound. Ultrasound Med Biol. 1995;21:171–185. doi: 10.1016/S0301-5629(94)00111-1. [DOI] [PubMed] [Google Scholar]
- 14.Blake JR, Meagher S, Fraser KH, Easson WJ, Hoskins PR. A method to estimate wall shear rate with a clinical ultrasound scanner. Ultrasound Med Biol. 2008;34:760–770. doi: 10.1016/j.ultrasmedbio.2007.11.003. [DOI] [PubMed] [Google Scholar]
- 15.Fukumoto Y, Hiro T, Fujii T, Hashimoto G, Fujimura T, Yamada J, Okamura T, Matsuzaki M. Localized elevation of shear stress is related to coronary plaque rupture: a 3-dimensional intravascular ultrasound study with in-vivo color mapping of shear stress distribution. J Am Coll Cardiol. 2008;51:645–650. doi: 10.1016/j.jacc.2007.10.030. [DOI] [PubMed] [Google Scholar]
- 16.Wellnhofer E, Goubergrits L, Kertzscher U, Affeld K, Fleck E. Novel non-dimensional approach to comparison of wall shear stress distributions in coronary arteries of different groups of patients. Atherosclerosis. 2009;202:483–490. doi: 10.1016/j.atherosclerosis.2008.05.044. [DOI] [PubMed] [Google Scholar]
- 17.Katritsis D, Kaiktsis L, Chaniotis A, Pantos J, Efstathopoulos EP, Marmarelis V. Wall shear stress: theoretical considerations and methods of measurement. Prog Cardiovasc Dis. 2007;49:307–329. doi: 10.1016/j.pcad.2006.11.001. [DOI] [PubMed] [Google Scholar]
- 18.Oyre S, Pedersen EM, Ringgaard S, Boesiger P, Paaske WP. In vivo wall shear stress measured by magnetic resonance velocity mapping in the normal human abdominal aorta. Eur J Vasc Endovasc Surg. 1997;13:263–271. doi: 10.1016/S1078-5884(97)80097-4. [DOI] [PubMed] [Google Scholar]
- 19.Oyre S, Paaske WP, Ringgaard S, Kozerke S, Erlandsen M, Boesiger P, Pedersen EM. Automatic accurate noninvasive quantitation of blood flow, cross-sectional vessel area, and wall shear stress by modelling of magnetic resonance velocity data. Eur J Vasc Endovasc Surg. 1998;16:517–524. doi: 10.1016/S1078-5884(98)80244-X. [DOI] [PubMed] [Google Scholar]
Associated Data
This section collects any data citations, data availability statements, or supplementary materials included in this article.
Supplementary Materials
(WMV 661 kb)


