Abstract
The field of sugar metabolism, and fructose metabolism in particular, has experienced a resurgence of interest in the past decade. The “fructose hypothesis” alleges that the fructose component common to all major caloric sweeteners (sucrose, high-fructose corn syrup, honey, and fruit juice concentrates) plays a unique and causative role in the increasing rates of cardiovascular disease, hypertension, diabetes, cancer, and nonalcoholic fatty liver disease. This review challenges the fructose hypothesis by comparing normal U.S. levels and patterns of fructose intake with contemporary experimental models and looking for substantive cause-and-effect evidence from real-world diets. It is concluded that 1) fructose intake at normal population levels and patterns does not cause biochemical outcomes substantially different from other dietary sugars and 2) extreme experimental models that feature hyperdosing or significantly alter the usual dietary glucose-to-fructose ratio are not predictive of typical human outcomes or useful to public health policymakers. It is recommended that granting agencies and journal editors require more physiologically relevant experimental designs and clinically important outcomes for fructose research.
Introduction
Few nutrients have received the level of scrutiny in the past 30 y that fructose has. It has been promoted as a unique dietary risk factor, likened to addictive drugs and reviled as a scourge of the modern diet. Fructose research has become a major research topic: PubMed and Google Scholar list >1500 and 2600 publications, respectively, with fructose in the title since 2004, attesting to its priority within granting agencies. It has recently become the indirect target of municipal government taxation schemes.
On closer examination, much of the accusing evidence appears based on confusion of fructose-containing sweeteners and their compositions, incorrect reporting of fructose use and intake figures, extreme experimental designs bearing little resemblance in amount or pattern to actual human use, and emphasis on statistical rather than clinical importance.
Challenges to fructose
Fructose received its first serious challenge in the 1980s from the research labs of USDA’s Sheldon Reiser (1, 2), Stanford’s Gerald Reaven (3, 4), and others, who alleged fructose altered glucose, lipid, uric acid, and copper metabolism and was a risk factor for cardiovascular disease (CVD)4 and hypertension. These issues were reviewed in a comprehensive monograph published in The American Journal of Clinical Nutrition in 1993. In the monograph Introduction (5), coeditors Forbes and Bowman made insightful observations on experimental protocols that are still applicable today:
The editors emphasize that careful consideration should be given to the effects of other macronutrients, particularly carbohydrates other than fructose, that are consumed as part of the total daily diet. Fructose is rarely consumed in its pure form, without other foods. We urge caution in interpreting studies of the health effects of fructose because many published studies have used extremely high fructose intakes, which far exceed the estimated intakes described in the paper by Park and Yetley. At times, these high-intake studies are extremely difficult to interpret because the quantities used are unphysiologic and associated with significant changes in dietary composition. In fact, as for many macronutrients, extremely high levels of fructose intake can be toxic. Difficulties also occur in making extrapolations to humans from results obtained in experimental animals because results vary for different species, strains, and sexes, and with the specific source of dietary protein.
Glinsmann and Bowman (6) wrote the following summary statement regarding the impact of fructose on public health: “On the basis of currently available information, as reviewed in this monograph, fructose is a valuable, traditional source of food energy, and there is no basis for recommending increases or decreases in its use in the general food supply or in special dietary use products.”
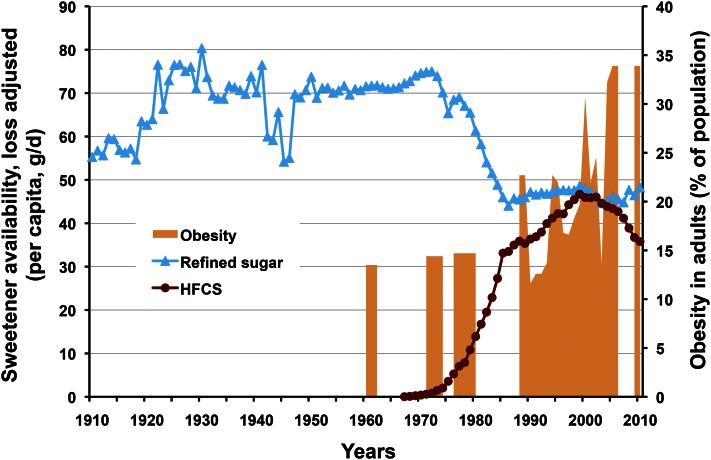
The second challenge to fructose came indirectly in 2004 via the “high-fructose corn syrup (HFCS) hypothesis” of Bray et al. (7) that asserted “the increase in consumption of HFCS has a temporal relation to the epidemic of obesity, and the overconsumption of HFCS in calorically sweetened beverages may play a role in the epidemic of obesity” (Fig. 1). This correlation-based hypothesis came as a surprise to many scientists, both within and outside the industry, because it did not include sucrose, a sweetener with similar composition, energy content, sweetness, functionality, consumption levels, and metabolism.5 The HFCS hypothesis brought about several significant consequences: attention was focused squarely on HFCS as a unique cause of obesity, whereas sucrose was ignored or viewed as a healthier sweetener; fructose research, dormant for a decade, was re-ignited; and HFCS was vilified in the popular culture when the hypothesis was accepted as fact rather than a premise requiring proof.
Figure 1.
Historical trends in sucrose and high-fructose corn syrup (HFCS) consumption (availability) versus rates of obesity in adults. After significant gain in market share at the expense of sucrose, HFCS consumption has been decreasing since 1999 and there is no correlation with obesity. From USDA Economic Research Service per capita consumption data, adjusted for loss and WHO Global Database on BMI.
The most recent challenge targeted fructose from all added sugars. Lustig (8) speculated that fructose has toxicity similar to that of ethanol, Johnson et al. (9) warned that “excessive fructose intake should be considered an environmental toxin with major health implications,” and Bray (10) promoted fructose as the specific object of Yudkin’s Pure, White and Deadly (11), a 1980s polemic against sugar. Although all 3 would likely agree with the general scientific concurrence that sucrose and HFCS are metabolically equivalent, they would also likely advocate limiting both sweeteners because of the claimed health risks associated with fructose, a component of both.
Fructose and chronic diseases
The 2010 Dietary Guidelines (12) listed 5 significant diet-related chronic diseases faced by Americans today: CVD (37% of the population), hypertension (34% of U.S. adults), diabetes (nearly 11% of the population), cancer (∼41% of the population), and osteoporosis (half of American women and 1 in 4 men 50 y of age and older).
Fructose has been called a risk factor for the first 4 of these diseases and most recently for nonalcoholic fatty liver disease, a clear indication of the broad scope of the research on this sugar and of the popular belief that it is a significant and unique cause of many of the diseases that Americans face. But is it really?
The fructose hypothesis
The assertion that fructose is at the root of many of contemporary America’s health problems may be termed the fructose hypothesis. Its rationale has 2 essential justifications: 1) Significant diseases related to intermediary metabolism—obesity, diabetes, CVD, hypertension, cancer, nonalcoholic fatty liver disease, and metabolic syndrome―are increasing among Americans in step with disproportionate fructose increases in the human diet; and 2) Cause-and-effect evidence uniquely links the metabolism of fructose to these diseases in humans at typical U.S. dietary exposure levels and intake patterns.
There are significant flaws in the fructose hypothesis that are seldom acknowledged: historical sugars intake trends are incompletely or incorrectly represented and are seldom presented alongside comparable fats and oils or cereal grains intakes for perspective; contemporary experimentation poorly models human fructose consumption levels and patterns, distorting normal dietary sugars ratios and biasing metabolic outcomes; and cause-and-effect support is poor for fructose as a biochemical/metabolic threat in humans at typical exposures and patterns―the evidence does not support extreme fructose biochemistry.
It is the purpose of this review to challenge the fructose hypothesis by offering new perspectives on fructose consumption and metabolism, with the aim of restoring reason and objectivity to the fructose debate.
Current status of knowledge
Historical sugars consumption trends
Historical sugars consumption trends in the United States.
Sucrose and HFCS consumption statistics are often incompletely reported or exaggerated to justify research. USDA Economic Research Service per capita availability trends (with the latest USDA loss factors) for sucrose and HFCS, the 2 dominant sweeteners in the United States, are shown in Figure 1, covering the historical period from 1910 to the present (13). Sucrose consumption increased 40% between 1910 and 1921, but then remained relatively constant for >50 y, except for the supply interruption during World War II. HFCS was introduced to the food and beverage industry as a liquid alternative to sucrose in the late 1960s and rapidly gained market share over the next two decades at the expense of sucrose, replacing almost half of it on a nearly 1:1 basis due to a) similarities in composition, energy (calories), and sweetness; b) ease of handling and consistent supply; and c) for some applications, improved functionality and cost savings. Although seldom acknowledged, it is undeniable that HFCS use peaked in 1999 and has been in steep decline for more than a decade; 2010 marked a return to 1989 use levels. It must be noted that this decade-long decline has occurred as obesity rates continued to climb.
Perspective.
Recent availability data invalidate the 2004 HFCS hypothesis; there has been no positive association between HFCS and obesity for 13 y. There is likewise no correlation with other diet-related chronic diseases that have increased over the past decade.
Commodity group energy intake trends in the United States.
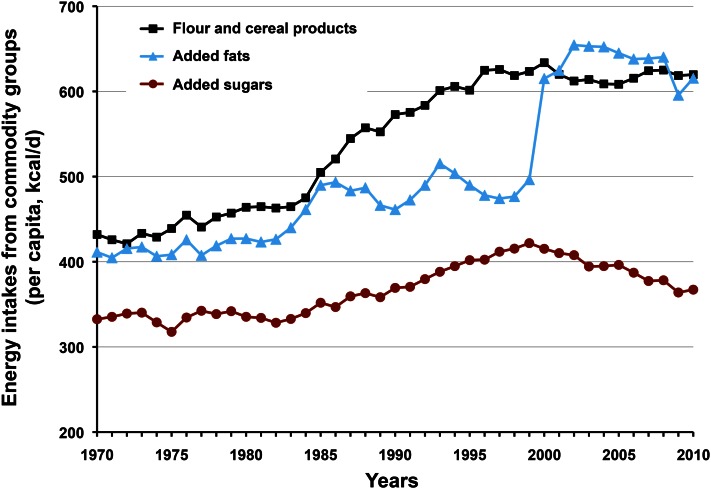
Per capita energy intake in the United States increased by 449 kcal/d between 1970 and 2010 (14). Swinburn et al. (15) observed that this increase in energy intake, coupled with insufficient compensating exercise, is a “more than sufficient” explanation for the overweight/obesity crisis. Figure 2 compares USDA commodity group energy increases over the past 40 y for caloric sweeteners, flour and cereal products, and added fats, oils, and dairy fats. Two surprising discoveries emerged from the comparison: first, increased energy from caloric sweeteners was minor, accounting for only 34 kcal/d (<8%) of the energy increase; and second, energy from flour/cereal products and added fats increased disproportionately in comparison with caloric sweeteners, accounting for >90% of the increase.
Figure 2.
Commodity group energy intakes, 1970–2010. Added sugars contribution to the 449 kcal/d increase in per capita energy intake over this period was small in comparison with flour-cereal products and added fats, accounting for <8% of the increase. Added sugars intake has been decreasing since 1999. From USDA Economic Research Service average daily per capita energy from the U.S. food availability, adjusted for loss.
Perspective.
Added sugars have not increased disproportionately as the modern diet inflated over the past 40 y; in fact, they have been in decline for more than a decade. To blame contemporary health problems on HFCS specifically, or caloric sweeteners generally, diverts attention from the most likely contributor to overweight and obesity: the imbalance between energy intake and expenditure.
USDA historical trends are supported in the NHANES study recently reported by Welsh et al. (16), which confirmed the decline in intake of added sugars in children of all ages and people of all ethnicities since 1999. It also reported a concomitant decline in energy from sugar-sweetened beverages (SSB) since 1999, correcting the misperception created by references to broad or outdated statistics that recent SSB intakes continue to increase (17–19).
Perspective.
The misperception that added sugars and SSB intakes continue to increase in the American population is simply untrue and should no longer be allowed as a justification for research.
Fructose increased little in 90 y; no association with increasing rates of obesity.
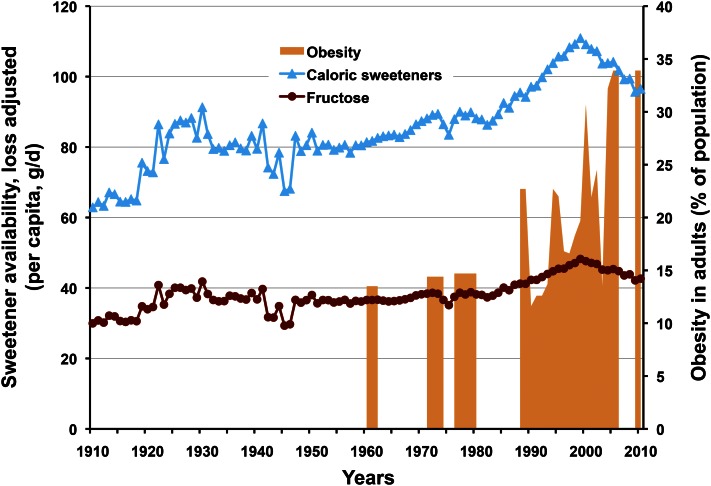
With the growing agreement among experts that HFCS and sucrose are metabolically equivalent has come a renewed focus by some on the fructose component common to both. As noted earlier, fructose has been investigated as a causative factor in many contemporary diseases with metabolic origins. However, the comparison in Figure 3 of historical trends in fructose exposure from added sugars between 1910 and 2010 with one of these, obesity, generates a useful perspective (13, 20). It is apparent that fructose intakes from caloric sweeteners over the past 90 y changed very little, averaging 39 ± 4 g/d/person and that there is no association with rates of obesity. Consistent with HFCS and SSB, intakes of fructose and total caloric sweeteners have also been decreasing since 1999 and are now comparable to 1991 levels. Thus, statements claiming that “[e]xposure to fructose was accelerated by the introduction of high fructose corn syrup (HFCS)” (10) and “[d]ietary fructose intake is increasing…it is increasing primarily from added sugars, including sucrose and high fructose corn syrup” (9) are inflammatory, but simply not true.
Figure 3.
Historical trends in fructose and caloric sweetener consumption (availability) versus contemporary rates of obesity in adults. Despite the introduction of new caloric sweeteners, fructose intake has not substantively increased since 1920; it has been decreasing since 1999 and there is no correlation with obesity. From USDA Economic Research Service per capita consumption data, adjusted for loss and WHO Global Database on BMI.
Perspective.
There is no correlation between consumption of fructose and increasing rates of obesity (Fig. 3) or, as noted with HFCS in Figure 1, with other diet-related chronic diseases that have increased over the past decade. Historical data from the past century invalidate the first tenet of the fructose hypothesis, which seeks to implicate fructose as an important risk factor through increasing intakes and correlation with obesity and associated diseases.
Sugars consumption patterns
Dietary fructose sources contain comparable glucose.
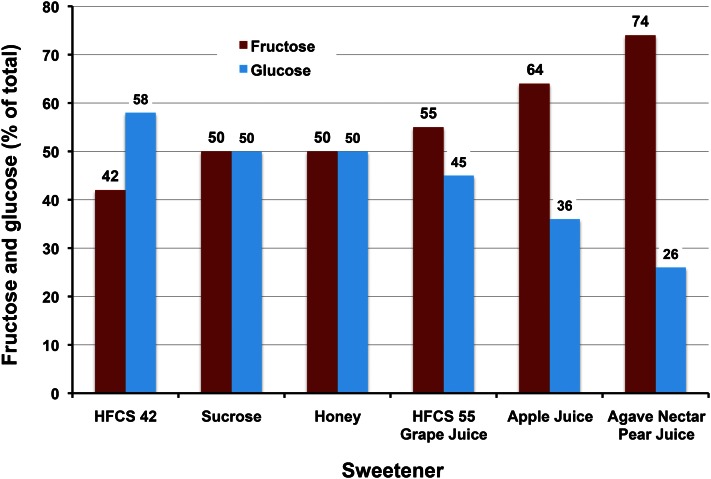
When considering the human diet, it is necessary to accept the reality that all sources of fructose contain comparable amounts of glucose. The primary dietary source of fructose is caloric sweeteners and their composition is shown in Figure 4. The most used sweeteners contain roughly equivalent amounts of fructose and glucose and are book-ended between HFCS-42 at 42% fructose and HFCS-55/grape juice concentrate at 55% fructose. HFCS seems a poor name in hindsight because medium fructose is more in line with its composition; the name has been a source of understandable confusion. Although apple juice concentrate (64% fructose), agave nectar/pear juice concentrate (74% fructose), and crystalline fructose (99%+ fructose) contain incrementally more fructose, their combined use is small and amounts to less than a few percent of annual caloric sweetener use.
Figure 4.
Comparison of the fructose and glucose compositions of caloric sweeteners. Fructose and glucose are consumed together and in relatively equal amounts from high-fructose corn syrup (HFCS), sucrose, honey, and grape juice concentrate.
The secondary dietary source of fructose is simple sugars in fruits, vegetables, and nuts. More than 50 of these commonly contain free fructose and glucose with minor amounts of sucrose and other glucose-based, short-chain oligomers. When the hydrolysis of sucrose to free fructose plus glucose and the oligomers to free glucose during digestion are accounted for, the net sugars contributed by this dietary source are also about half fructose and half glucose (21).
The incidence of a fructose- or glucose-only–sweetened diet is rare.
The fructose versus glucose comparison common in many contemporary studies carries with it the tacit assumption that the results generated are applicable to a substantive segment of the population. This assumption is false.
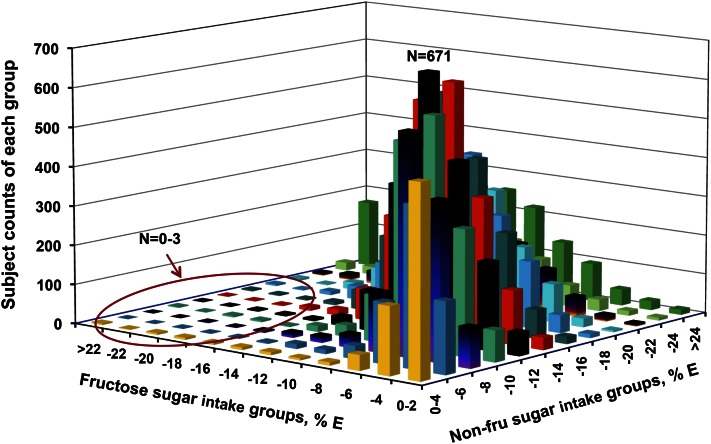
Sun et al. (22) tested this assumption by comparing fructose and nonfructose (mostly glucose-based and lactose) intake patterns of >25,000 subjects in the 1999–2006 NHANES databases (Fig. 5). They discovered that not only was fructose rarely consumed solely or in excess over nonfructose sugars, the fructose energy contribution was lower that that of nonfructose sugars in >97% of subjects studied.
Figure 5.
Sample size distribution by interaction of fructose and nonfructose (non-fru) intakes (NHANES; % kcal in adults; n = 17,749). X-axis = fructose % E (percentage of total energy), y-axis = nonfructose sugars % E, and z-axis = subject frequency (counts from 0 to 671). Fructose generally contributed less daily energy than nonfructose sugars, the ratios of fructose to nonfructose sugars were held in a fairly narrow range, and consumption of fructose or nonfructose sugar alone as the dominant sugar was uncommon in the typical American diet. For example, in the circled left-front area, the frequencies of participants who had higher fructose intakes without allied high nonfructose sugar intakes are very low (0–3 subjects for many cells). Humans consume mixtures of sugars, not fructose or glucose in isolation. % E, percentage of total energy. Reproduced with permission from (22).
Glucose is the dominant sugar in the human diet.
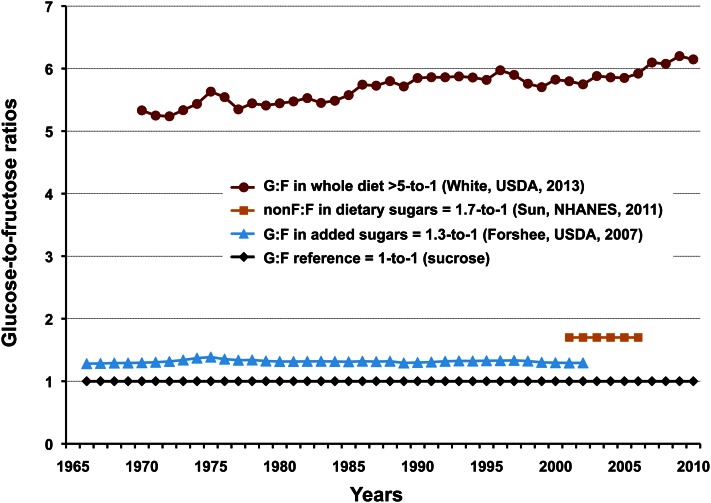
Glucose-to-fructose ratios in various commodity combinations have been calculated in the past to add additional insight about how we consume simple sugars. These are collected in Figure 6, along with a recently introduced whole diet ratio. Using USDA caloric sweetener availability data between 1966 and 2002, Forshee et al. (23) reported that glucose consistently exceeded fructose in added sugars by 1.3-to-1,6 a ratio that was unchanged by the introduction of HFCS in the 1970s. Sun et al. (22) analyzed added sugars intakes from NHANES subjects in reporting an aggregate nonfructose-to-fructose ratio of 1.7:1,7 showing that nonfructose sugars exceed fructose in the diet by nearly 2-fold.
Figure 6.
Comparison of glucose-to-fructose (G:F) ratios of added sugars, dietary sugars (nonfructose to fructose), and the whole diet. Glucose is by far the dominant sugar in our food supply, exceeding fructose in the whole diet by a ratio of more than 5:1 for the past 40 y. Key provides commodity category and ratio (author, data source, publication year).
For this paper, White (24) used 1970–2010 USDA loss-adjusted per capita commodity group energy availability and specific sugars composition data (14, 24, 25) for all dietary sources of glucose and fructose to estimate the total diet ratio at >5:1 for this time period.8 This higher ratio is more representative of real-world diets. The upward trend from 1970 onward is reasonable when the increasing energy contributions of glucose-based flours and cereal grain products (Fig. 2), starches, maltodextrins, corn syrups, and dextrose are considered.
Although it has been estimated that only 20% of dietary glucose is taken up by the liver, short-term and nonhuman studies suggest that fructose is metabolized predominantly, although not entirely, in the liver; for example, 12% of absorbed fructose was converted to intestinal lactate in miniature swine (26). However, once absorbed by the liver, half of the fructose is rapidly metabolized to glucose (27). This has 2 important, but poorly recognized, consequences: 1) when dietary conversion of fructose to glucose is accounted for, the initial dietary glucose-to-fructose ratio of >5:1 reported above now approaches 11:1 in the whole body;9 and 2) this conversion shifts the initial glucose-to-fructose ratio in the liver from 1:1 to 3:1.10
Perspective.
Fruits, vegetables, and nuts and the principal sweeteners sucrose, HFCS, and honey contain comparable proportions of fructose and glucose. The incidence of individuals consuming predominantly fructose- or glucose-sweetened diets is rare. Fructose versus glucose experiments targeting these extremes are neither physiologically relevant nor useful in predicting mixed-sweetener outcomes for the general population consuming an overwhelmingly glucose-based diet. Considering the dominance of glucose in both the overall diet and the liver, a strong case could be made that fructose-only studies exaggerate the contribution of fructose to overall metabolism, while ignoring the overarching regulatory and metabolic presence of this principal sugar.
Exaggerated protocols bias biochemical outcomes
Fructose-only/extreme dosing protocols significantly shift both dose and glucose-to-fructose ratio.
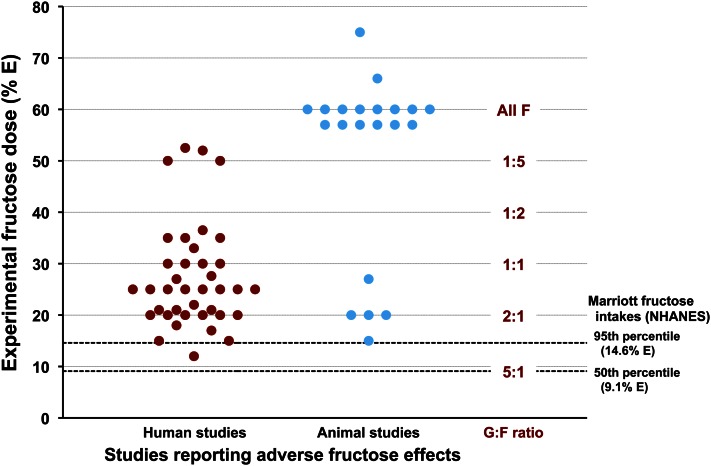
Using NHANES data, Marriott et al. (28) estimated whole-population fructose intakes at 9.1% E (percentage of total energy; range, 7.4%–11.6%) for the population mean and 14.6% E (range, 12.8%–17.9%) for the 95th population percentile, the highest 5% of fructose consumers. Benchmarks for the 50th and 95th percentiles are represented as dashed black horizontal lines in Figure 7. Colored dots were plotted representing fructose amounts (% total E) fed to human (red) and animal (blue) subjects in 57 studies reporting adverse effects of fructose. These examples were culled from articles and reviews representing a cross section of opinions on the fructose debate (29–33). Although more could be added to the graph, the present number is sufficient to illustrate that human and animal subjects in studies reporting adverse effects are routinely given extreme fructose doses, exceeding even 95th population percentile intakes in many human studies by 1.5- to 3-fold excess. Fructose doses administered to animals are more extreme yet, exceeding the 95th human percentile intake by >4 to 5 times. Extreme dosing produces a biochemically significant shift in the ratio of glucose to fructose that must be accounted for.
Figure 7.
Experimental fructose dose (%E, percentage of total energy) in representative human and animal studies claiming adverse fructose effects versus Marriott’s 50th and 95th percentile fructose intake estimates. Most experimental doses exceed even the 95th percentile for human fructose intake. Few Americans consume the levels of fructose being tested, and fewer still consume these levels in the absence of glucose. Extreme dosing protocols drastically alter glucose-to-fructose (G:F) ratios and promote a distorted view of fructose metabolism.
Perspective.
Widely practiced fructose-only protocols using extreme dosing to accentuate metabolic differences shift the glucose-to-fructose ratio from 5:1 at the population mean to 1:1, 1:2, and 1:4 at doses of 30%, 40%, and 50% E as fructose, respectively; the ratio becomes incalculable and meaningless in animal studies at 60% E, where fructose doses exceed dietary recommendations for total carbohydrates. Fructose overfeeding studies are clearly not physiological, are likely to provoke abnormal metabolism through radical shifts in glucose-to-fructose ratios, and cannot be relied on to assess human risk.
Extreme dosing outcomes are not supported by real-world studies
Effects of fructose alone.
Numerous studies have reported differences in metabolic outcomes in dietary comparisons of fructose alone and glucose alone [see, for example, references (34–37)]. Most are poorly suited for use in assigning health risk because the comparison is artificial—humans consume both together, not in isolation, and the typical diet contains >5 times more glucose than fructose—and because the dose is often extreme (typically 1.5 to 3 times the 95th population intake), as noted above, to accentuate differences.
Several recent meta-analyses have attempted to put human fructose-alone experimentation into a dose-dependent perspective. In a series of papers from the research group of Sievenpiper and Jenkins, isocaloric comparisons of fructose with other carbohydrates (sucrose, HFCS, lactose, starch) were found not to affect weight gain (33) or blood pressure (38), did not increase uric acid in nondiabetic and diabetic subjects (39), and improved glycemic control (40). Some differences were observed with hypercaloric feeding trials, but that was likely due to confounding from extra calories rather than fructose.
Two meta-analyses by Dolan et al. reviewed the effect of normal dietary levels of fructose on the development of hyperlipidemia and obesity in healthy, normal weight subjects (42) and on blood lipids and body weight in overweight and obese subjects (30). They concluded that fructose does not cause relevant changes in triglycerides or body weight when consumed at levels approaching the 95th percentile. As Livesey (43) pointed out, bidirectional effects of fructose can be missed when dose dependency is overlooked. For example, effects on specific markers may be absent or positive at moderate to high doses, but adverse at very high to excessive doses.
Caloric sweetener comparisons.
The abnormal biochemistry reported in metabolically extreme fructose-alone protocols is not observed in short-term studies of human subjects consuming real-world mixed sugars and mixed nutrient meals. When Melanson et al. (43), Soenen and Westerterp-Plantenga (44), and Stanhope et al. (45) compared the biochemical consequences of HFCS and sucrose in randomized, controlled trials, they found metabolic comparability between sweeteners and normal clinical values for a number of metabolic markers of obesity (plasma glucose and insulin, ghrelin and leptin, triglycerides and uric acid, hunger and satiety) over the range of exposure from 9% to 15% E as fructose (45–75 g/d; 50th–95th intake percentile). [See the accompanying paper in this thematic group by Rippe and Angelopolous (46).]
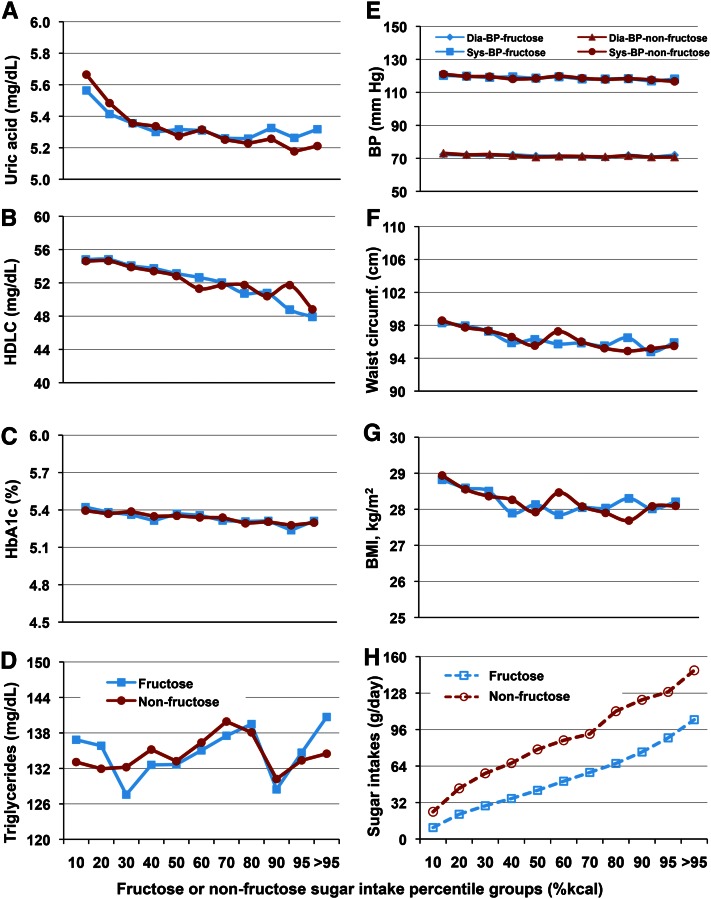
This was verified over a period of 7 y in free-living human participants in the 1999–2006 NHANES studies. Sun et al. (22) correlated dietary fructose and nonfructose sugar intakes of >17,700 individuals, 19–80 y of age, with biochemical markers for metabolic syndrome. They observed no differences in endpoints comparing fructose and nonfructose sugars, no changes of clinical importance over the whole range of sugars intakes, and no positive association between sugars consumption and triglycerides, HDL cholesterol, glycohemoglobin (HbA1c), uric acid, blood pressure, waist circumference, and BMI (Fig. 8).
Figure 8.
Relationship of biochemical markers for metabolic syndrome with fructose/nonfructose sugar intakes (energy percentile) in adults, n = 8065. Solid lines connecting filled blue squares and red circles represent the biochemical markers against fructose and nonfructose, respectively, for A through G. In H, broken lines and open blue squares and red circles represent fructose and nonfructose sugars intakes in g/d, respectively, across the sugar intake percentile groups. There were no significant differences between fructose and nonfructose sugars for any of the markers and no changes in clinical importance across all intake percentiles. BP, blood pressure; HDLC, HDL cholesterol; HbA1c, glycohemoglobin. Adapted with permission from (22).
Perspective.
The second tenet of the fructose hypothesis, that cause-and-effect evidence uniquely links fructose to diseases related to intermediary metabolism in humans at normal U.S. dietary exposure levels and intake patterns, is refuted by studies using real-world fructose exposures showing no differential effects versus controls. Head-to-head comparisons of sucrose and HFCS demonstrate the metabolic equivalence between the 2, as would be expected based on similarities in composition.
Epidemiological and animal studies have low evidentiary value
Epidemiological studies.
Epidemiologists have found fructose to be fertile ground for study, although FDA considers them to be of low evidentiary value for establishing cause and effect (47). Rizkalla (32) recently reviewed the epidemiological literature reporting associations between fructose and body weight, obesity, lipogenesis, CVD, insulin resistance, blood pressure, and gout and concluded that “most of such studies have been cross-sectional or based on passive inaccurate surveillance, especially in children and adolescents, and thus have not established direct causal links.”
In their recent review, Tappy and Mittendorfer (48) exposed a significant problem with nutritional tables frequently referenced for epidemiological studies: they typically lack specific fructose data, necessitating the reliance on associations between metabolic diseases and sucrose or SSB intake. They concluded that, although “data collected from epidemiological studies therefore support the idea that sugar and sweetened beverage consumption most likely contribute quite significantly to excess energy intake and obesity, [they] do not demonstrate that fructose per se or even just sugar are responsible for increased energy intake or metabolic diseases.”
An important issue with epidemiological studies is the inaccessibility of the data to reader analysis. Data are so heavily processed through multiple layers of mathematical filters that results are intractable to nonstatisticians; conclusions must be accepted on faith. The previously cited NHANES study by Sun et al. (22) is a refreshing departure from the norm with the authors’ use of raw, unmanipulated data in the analysis.
Animal studies.
Animal studies have been widely used in fructose research, with some authors making public health recommendations based on their outcomes. For example, rats were the only intact species used for experimental support of a recent hypothesis that fructose plays a causal role in chronic kidney disease (9). The animal studies on renal disease contributed materially to the author’s generalized warning that “excessive fructose intake should be considered an environmental toxin with major health implications.”
The FDA considers animal studies to be low on the evidentiary scale in establishing cause and effect for many reasons, including obvious size differences; different metabolism (e.g., rats retain the enzyme uricase); different anatomy [rats lack a prefrontal cortex and consequently lack higher cognitive (executive) function]; different native diets (rats subsist in nature on diets of complex carbohydrates, not simple sugars); and different digestion (rats seem to tolerate imposed diets of ≥60% E as fructose, whereas humans may develop gastric distress if fed diets of ≥10% E as fructose in the absence of glucose).
In fact, the differences between rats and humans are so significant that a group of concerned clinicians and scientists wrote an open letter to the Prime Minister of England decrying the high failure rate of new drugs, which they blamed on an overreliance of the pharmaceutical industry use of animals (especially rats) to predict drug behavior in humans (49):
The stark differences, not only in the diseases of different animal species, but also the ways that they respond to drugs, are now well known. Many studies have shown that animal tests frequently fail to translate to the clinic, with estimates of their ability to predict effects on people as low as 37–50%, or no better than the toss of a coin.
Can we realistically expect any better from extreme dose testing of fructose in rats?
Perspective.
Although useful for suggesting areas for future research, epidemiological and animal studies are given relatively low value for establishing cause and effect in evidence-based reviews. The greatest value is given to human intervention studies.
Clinical importance and public health implications
Statistical significance versus clinical importance.
The researcher’s obsession with statistical significance is often at odds with the physician’s need for clinical importance. This conflict was clearly stated by Birkmeyer (50):
Although it is tempting to equate statistical significance with clinical importance, critical readers should avoid this temptation. To be clinically important requires a substantial change in an outcome that matters. Statistically significant changes, however, can be observed with trivial outcomes.
The recent fructose literature is replete with examples of statistically significant reports that, on examination, are slight and of questionable clinical importance. Metabolic markers and disease indicators for which statistical significance has been achieved with little apparent clinical importance include LDL subclasses, adiponectin, ghrelin, glucose, C-peptide, HOMA2-IR (homeostasis model assessment system), FFA, aspartate aminotransferase, and alanine aminotransferase (51); blood pressure (52); monocyte chemoattractant protein-1, plasminogen activator inhibitor-1, and soluble leukocyte adhesion molecule-1 (E-selectin) (53); CVD risk factors (54); triglycerides, LDL cholesterol, non-HDL cholesterol, and apolipoprotein B (55); and markers for CVD and type 2 diabetes (56).
Public health implications.
Tappy wrote 2 thoughtful reviews on fructose metabolism, published 2 y apart. In the first of these (27), the following guarded observations were made:
Although there is compelling evidence that very high fructose intake can have deleterious metabolic effects in humans as in rodents, the role of fructose in the development of the current epidemic of metabolic disorders remains controversial…There is, however, no unequivocal evidence that fructose intake at moderate doses is directly related with adverse metabolic effects.
Comments made 2 y later in 2012 (48) were more direct:
Public health policies to eliminate or limit fructose in the diet should be considered premature. Instead, efforts should be made to promote a healthy lifestyle that includes physical activity and nutritious foods while avoiding intake of excess calories until solid evidence to support action against fructose is available. Public health is almost certainly to benefit more from policies that are aimed at promoting what is known to be good than from policies that are prohibiting what is not (yet) known to be bad.
Tappy’s change in tone appears to be an acknowledgment that much of the fructose literature is poorly suited to public health policy decision making and a caution that policy making is ill advised without compelling cause-and-effect data.
Perspective.
In evaluating fructose research for public health implications, clinical importance in human subjects should be required wherever statistical significance is claimed.
Conclusions
In considering the volume of contemporary literature on fructose, 1 conclusion stands clear: fructose is safe at typical intake levels but can produce adverse metabolic effects when abused—as is true of most nutrients. It turns out that the largest abusers of fructose are not American consumers, but research scientists. For the adult population as a whole, dietary fructose exposure ranges from very low to <18% E. Over this range, recent meta- and NHANES analyses demonstrate no differential effects of fructose compared with other sugars on weight gain, blood pressure, uric acid, blood lipids, and hyperlipidemia; indeed, there may be a positive role for fructose in glycemic control at normal exposures. It is only when researchers hyperdose human and animal subjects with fructose in amounts that exceed the 95th percentile by 1.5- to 3- and 4- to 5-fold, respectively, that adverse effects are provoked.
Humans consume fructose with lots and lots of glucose; >5 times as much glucose as fructose. The NHANES data from >17,700 subjects analyzed by Sun et al. demonstrate that humans exhibit clinically normal metabolite levels over the normal range of fructose intakes. But it is also clear that researchers can provoke extreme biochemical responses by significantly shifting the dietary glucose-to-fructose ratio from 5:1 at the 50th percentile (9.1% E) to 1:1, 1:2, and 1.5 at 30%, 40%, and 50% E, respectively, through extreme dosing. Surely we cannot expect such exaggerated experimental systems to model the typical human experience with fructose.
The fructose hypothesis claims that 1) significant diseases related to intermediary metabolism are increasing among Americans in step with disproportionate fructose increases in the human diet and 2) cause-and-effect evidence uniquely links the metabolism of fructose to these diseases in humans at typical human exposures and intake patterns. Evidence is presented in this review that fructose has not disproportionately increased in the human diet (in fact, it has increased very little in the past 90 y) and that cause-and-effect evidence of adverse effects is lacking at typical human exposure levels and patterns. The fructose hypothesis must be continually challenged for human relevance.
We are amassing tremendous amounts of data gathered at great taxpayer expense that has proved to be of little value to public health policymakers. The last 2 Dietary Guidelines Committees routinely ignored reports of abnormal biochemistry related to fructose because of the unrealistic conditions required to provoke it, choosing instead to focus health recommendations on moderate intake of added sugars and all macronutrients. Is it time for granting agencies and journal editors to require more physiologically relevant experimental designs and clinically important outcomes for fructose research? I think it is.
Acknowledgments
Stimulating discussions, generous suggestions, and kind encouragement from the following friends and colleagues, from both academia and industry, are gratefully acknowledged: Mark Empie, PhD (Archer Daniels Midland Company, Decatur, IL), Walter Glinsmann, MD (Glinsmann, Inc, Arlington, VA), Theresa Nicklas, DrPH (Baylor College of Medicine, Houston, TX), and Luc Tappy, MD (Department of Physiology, Faculty of Biology and Medicine, University of Lausanne, Switzerland). Sam Sun, PhD (Archer Daniels Midland Company) graciously lent his expertise in formatting the figures for publication. The sole author had responsibility for all parts of the manuscript.
Footnotes
Abbreviations used: CVD, cardiovascular disease; % E, percentage of total energy; HFCS, high-fructose corn syrup; SSB, sugar-sweetened beverage.
Sucrose could not be included in the hypothesis because its use did not correlate with increasing obesity rates. Due to their interchangeability, HFCS replaced sucrose on a 1:1 basis in many food and beverage applications; as HFCS use increased, the use of sucrose decreased.
Glucose = ∑ (0.5 × (sucrose + honey + edible syrups) + 0.58 × HFCS-42 + 0.45 × HFCS-55 + corn syrup + glucose); fructose = ∑ (0.5 × (sucrose + honey + edible syrups) + 0.42 × HFCS-42 + 0.55 × HFCS-55).
Fructose was calculated from intrinsic amounts in food commodities and added sugars; nonfructose sugar (principally glucose based and lactose) was calculated by subtracting fructose from total sugars.
Energy contributions for all dietary sources of glucose and fructose were extracted from USDA loss-adjusted per capita food availability data tables. Dietary sources included meat, eggs, and nuts; dairy; fruit; vegetables; grains; and added sugars. Appropriate adjustments based on sugars composition data from NutritionData.com yielded the glucose and fructose values used to generate yearly ratios. NutritionData.com uses USDA’s National Nutrient Database for Standard Reference supplemented with data from food manufacturers and restaurants.
Considering the whole body, a meal containing 50 g glucose and 10 g fructose (5:1 ratio) would effectively generate 55 g glucose and 5 g fructose (11:1 ratio) after conversion of half of the fructose to glucose in the liver.
Using the previous example, 20% uptake of glucose (10 g) and near-quantitative uptake of fructose (10 g) would generate a 1:1 ratio in the liver; after conversion of half of the fructose to glucose, the glucose-to-fructose ratio would become 3:1.
Literature Cited
- 1.Hallfrisch J, Reiser S, Prather ES. Blood lipid distribution of hyperinsulinemic men consuming three levels of fructose. Am J Clin Nutr. 1983;37:740–8 [DOI] [PubMed] [Google Scholar]
- 2.Reiser S, Smith JC, Jr, Mertz W, Holbrook JT, Scholfield DJ, Powell AS, Canfield WK, Canary JJ. Indices of copper status in humans consuming a typical American diet containing either fructose or starch. Am J Clin Nutr. 1985;42:242–51 [DOI] [PubMed] [Google Scholar]
- 3.Reaven GM. Effects of fructose on lipid metabolism. Am J Clin Nutr. 1982;35:627. [DOI] [PubMed] [Google Scholar]
- 4.Hwang IS, Ho H, Hoffman BB, Reaven GM. Fructose-induced insulin resistance and hypertension in rats. Hypertension. 1987;10:512–6 [DOI] [PubMed] [Google Scholar]
- 5.Introduction to the health effects of dietary fructose. Am J Clin Nutr. 1993;58:721S–823S [PubMed] [Google Scholar]
- 6.Glinsmann WH, Bowman BA. The public health significance of dietary fructose. Am J Clin Nutr. 1993;58:820S–3S [DOI] [PubMed] [Google Scholar]
- 7.Bray GA, Nielsen SJ, Popkin BM. Consumption of high-fructose corn syrup in beverages may play a role in the epidemic of obesity. Am J Clin Nutr. 2004;79:537–43 [DOI] [PubMed] [Google Scholar]
- 8.Lustig RH. Fructose: metabolic, hedonic, and societal parallels with ethanol. J Am Diet Assoc. 2010;110:1307–21 [DOI] [PubMed] [Google Scholar]
- 9.Johnson RJ, Sanchez-Lozada LG, Nakagawa T. The effect of fructose on renal biology and disease. J Am Soc Nephrol. 2010;21:2036–9 [DOI] [PubMed] [Google Scholar]
- 10.Bray GA. Fructose: pure, white, and deadly? Fructose, by any other name, is a health hazard. J Diabetes Sci Technol. 2010;4:1003–7 [DOI] [PMC free article] [PubMed] [Google Scholar]
- 11.Yudkin J. Pure, white and deadly. London: Penguin Books; 1986 [Google Scholar]
- 12.U.S. Department of Agriculture, Center for Nutrition Policy and Promotion. Report of the Dietary Guidelines Advisory Committee on the Dietary Guidelines for Americans, 2010. Washington, DC. Available from: http://www.cnpp.usda.gov/DietaryGuidelines.htm. Accessed September 5, 2012.
- 13.USDA/Economic Research Service. Food Availability (Per capita) Data System: Food availability. Available from: http://www.ers.usda.gov/data-products/food-availability-%28per-capita%29-data-system.aspxSweets.xls, updated 20 Aug 2012. Accessed September 5, 2012.
- 14.USDA/Economic Research Service. Food Availability (Per capita) Data System: Loss-adjusted food availability. Available from: http://www.ers.usda.gov/data-products/food-availability-%28per-capita%29-data-system.aspx Calories.xls, updated 20 Aug 2012. Accessed September 5, 2012.
- 15.Swinburn B, Sacks G, Ravussin E. Increased food energy supply is more than sufficient to explain the US epidemic of obesity. Am J Clin Nutr. 2009;90:1453–6 [DOI] [PubMed] [Google Scholar]
- 16.Welsh JA, Sharma AJ, Grellinger L, Vos MB. Consumption of added sugars is decreasing in the United States. Am J Clin Nutr. 2011;94:726–34 [DOI] [PMC free article] [PubMed] [Google Scholar]
- 17.Bray GA. How bad is fructose? Am J Clin Nutr. 2007;86:895–6 [DOI] [PubMed] [Google Scholar]
- 18.Johnson L, Mander AP, Jones LR, Emmett PM, Jebb SA. Is sugar-sweetened beverage consumption associated with increased fatness in children? Nutrition. 2007;23:557–63 [DOI] [PubMed] [Google Scholar]
- 19.Bray GA. Soft drink consumption and obesity: it is all about fructose. Curr Opin Lipidol. 2010;21:51–7 [DOI] [PubMed] [Google Scholar]
- 20.World Health Organization (WHO) Global database on body mass index. Global InfoBase. Available from: apps.who.int/bmi/index.jsp. Accessed September 5, 2012.
- 21.White JS. Straight talk about high-fructose corn syrup: what it is and what it ain't. Am J Clin Nutr. 2008;88:1716S–21S [DOI] [PubMed] [Google Scholar]
- 22.Sun SZ, Anderson GH, Flickinger BD, Williamson-Hughes PS, Empie MW. Fructose and non-fructose sugar intakes in the US population and their associations with indicators of metabolic syndrome. Food Chem Toxicol. 2011;49:2875–82 [DOI] [PubMed] [Google Scholar]
- 23.Forshee RA, Storey ML, Allison DB, Glinsmann WH, Hein GL, Lineback DR, Miller SA, Nicklas TA, Weaver GA, White JS. A critical examination of the evidence relating high fructose corn syrup and weight gain. Crit Rev Food Sci Nutr. 2007;47:561–82 [DOI] [PubMed] [Google Scholar]
- 24.Conde Nast Publications. Glucose. Available from: http://www.nutritiondata.com/. Accessed April 10, 2012.
- 25.Conde Nast Publications. Fructose. Available from: http://www.nutritiondata.com/. Accessed April 10, 2012.
- 26.Bjorkman O, Crump M, Phillips RW. Intestinal metabolism of orally administered glucose and fructose in Yucatan miniature swine. J Nutr. 1984;114:1413–20 [DOI] [PubMed] [Google Scholar]
- 27.Tappy L, Le KA. Metabolic effects of fructose and the worldwide increase in obesity. Physiol Rev. 2010;90:23–46 [DOI] [PubMed] [Google Scholar]
- 28.Marriott BP, Cole N, Lee E. National estimates of dietary fructose intake increased from 1977 to 2004 in the United States. J Nutr. 2009;139:1228S–35S [DOI] [PubMed] [Google Scholar]
- 29.Dolan LC, Potter SM, Burdock GA. Evidence-based review on the effect of normal dietary consumption of fructose on blood lipids and body weight of overweight and obese individuals. Crit Rev Food Sci Nutr. 2010;50:889–918 [DOI] [PubMed] [Google Scholar]
- 30.Havel PJ. Dietary fructose: implications for dysregulation of energy homeostasis and lipid/carbohydrate metabolism. Nutr Rev. 2005;63:133–57 [DOI] [PubMed] [Google Scholar]
- 31.Johnson RJ, Perez-Pozo SE, Sautin YY, Manitius J, Sanchez-Lozada LG, Feig DI, Shafiu M, Segal M, Glassock RJ, Shimada M, et al. Hypothesis: could excessive fructose intake and uric acid cause type 2 diabetes? Endocr Rev. 2009;30:96–116 [DOI] [PMC free article] [PubMed] [Google Scholar]
- 32.Rizkalla SW. Health implications of fructose consumption: A review of recent data. Nutr Metab (Lond). 2010;7:82. [DOI] [PMC free article] [PubMed] [Google Scholar]
- 33.Sievenpiper JL, de Souza RJ, Mirrahimi A, Yu ME, Carleton AJ, Beyene J, Chiavaroli L, Di Buono M, Jenkins AL, Leiter LA, et al. Effect of fructose on body weight in controlled feeding trials: a systematic review and meta-analysis. Ann Intern Med. 2012;156:291–304 [DOI] [PubMed] [Google Scholar]
- 34.Abdel-Sayed A, Binnert C, Le KA, Bortolotti M, Schneiter P, Tappy L. A high-fructose diet impairs basal and stress-mediated lipid metabolism in healthy male subjects. Br J Nutr. 2008;100:393–9 [DOI] [PubMed] [Google Scholar]
- 35.Lê KA, Ith M, Kreis R, Faeh D, Bortolotti M, Tran C, Boesch C, Tappy L. Fructose overconsumption causes dyslipidemia and ectopic lipid deposition in healthy subjects with and without a family history of type 2 diabetes. Am J Clin Nutr. 2009;89:1760–5 [DOI] [PubMed] [Google Scholar]
- 36.Stanhope KL, Schwarz JM, Keim NL, Griffen SC, Bremer AA, Graham JL, Hatcher B, Cox CL, Dyachenko A, Zhang W, et al. Consuming fructose-sweetened, not glucose-sweetened, beverages increases visceral adiposity and lipids and decreases insulin sensitivity in overweight/obese humans. J Clin Invest. 2009;119:1322–34 [DOI] [PMC free article] [PubMed] [Google Scholar]
- 37.Teff KL, Elliott SS, Tschop M, Kieffer TJ, Rader D, Heiman M, Townsend RR, Keim NL, D'Alessio D, Havel PJ. Dietary fructose reduces circulating insulin and leptin, attenuates postprandial suppression of ghrelin, and increases triglycerides in women. J Clin Endocrinol Metab. 2004;89:2963–72 [DOI] [PubMed] [Google Scholar]
- 38.Ha V, Sievenpiper JL, de Souza RJ, Chiavaroli L, Wang DD, Cozma AI, Mirrahimi A, Yu ME, Carleton AJ, Dibuono M, et al. Effect of fructose on blood pressure: a systematic review and meta-analysis of controlled feeding trials. Hypertension. 2012;59:787–95 [DOI] [PubMed] [Google Scholar]
- 39.Wang DD, Sievenpiper JL, de Souza RJ, Chiavaroli L, Ha V, Cozma AI, Mirrahimi A, Yu ME, Carleton AJ, Dibuono M, et al. The effects of fructose intake on serum uric acid vary among controlled dietary trials. J Nutr. 2012;142:916–23 [DOI] [PMC free article] [PubMed] [Google Scholar]
- 40.Cozma AI, Sievenpiper JL, de Souza RJ, Chiavaroli L, Ha V, Wang DD, Mirrahimi A, Yu ME, Carleton AJ, Dibuono M, et al. Effect of Fructose on Glycemic Control in Diabetes: A systematic review and meta-analysis of controlled feeding trials. Diabetes Care. 2012;35:1611–20 [DOI] [PMC free article] [PubMed] [Google Scholar]
- 41.Dolan LC, Potter SM, Burdock GA. Evidence-based review on the effect of normal dietary consumption of fructose on development of hyperlipidemia and obesity in healthy, normal weight individuals. Crit Rev Food Sci Nutr. 2010;50:53–84 [DOI] [PubMed] [Google Scholar]
- 42.Livesey G. Fructose ingestion: dose-dependent responses in health research. J Nutr. 2009;139:1246S–52S [DOI] [PubMed] [Google Scholar]
- 43.Melanson KJ, Zukley L, Lowndes J, Nguyen V, Angelopoulos TJ, Rippe JM. Effects of high-fructose corn syrup and sucrose consumption on circulating glucose, insulin, leptin, and ghrelin and on appetite in normal-weight women. Nutrition. 2007;23:103–12 [DOI] [PubMed] [Google Scholar]
- 44.Soenen S, Westerterp-Plantenga MS. No differences in satiety or energy intake after high-fructose corn syrup, sucrose, or milk preloads. Am J Clin Nutr. 2007;86:1586–94 [DOI] [PubMed] [Google Scholar]
- 45.Stanhope KL, Griffen SC, Bair BR, Swarbrick MM, Keim NL, Havel PJ. Twenty-four-hour endocrine and metabolic profiles following consumption of high-fructose corn syrup-, sucrose-, fructose-, and glucose-sweetened beverages with meals. Am J Clin Nutr. 2008;87:1194–203 [DOI] [PMC free article] [PubMed] [Google Scholar]
- 46.Rippe JM, Angelopolous TJ. Sucrose, High-Fructose Corn Syrup, and Fructose, Their Metabolism and Potential Health Effects: What Do We Really Know? Adv Nutr. 2013;4:236–45 [DOI] [PMC free article] [PubMed] [Google Scholar]
- 47.Food and Drug Administration, Department of Health and Human Services, Center for Food Safety and Applied Nutrition. Guidance for Industry: Evidence-Based Review System for the Scientific Evaluation of Health Claims - Final. 2009. Available from: http://www.fda.gov/Food/GuidanceComplianceRegulatoryInformation/GuidanceDocuments/FoodLabelingNutrition/ucm073332.htm. Accessed September 5, 2012. [Google Scholar]
- 48.Tappy L, Mittendorfer B. Fructose toxicity: is the science ready for public health actions? Curr Opin Clin Nutr Metab Care. 2012;15:357–61 [DOI] [PMC free article] [PubMed] [Google Scholar]
- 49.Archibald K, Coleman R, Foster C. Open letter to UK Prime Minister David Cameron and Health Secretary Andrew Lansley on safety of medicines. Lancet. 2011;377:1915. [DOI] [PubMed] [Google Scholar]
- 50.Birkmeyer JD. Primer on statistical significance and P values. Eff Clin Pract. 2001;4:9–10 [PubMed] [Google Scholar]
- 51.Aeberli I, Gerber PA, Hochuli M, Kohler S, Haile SR, Gouni-Berthold I, Berthold HK, Spinas GA, Berneis K. Low to moderate sugar-sweetened beverage consumption impairs glucose and lipid metabolism and promotes inflammation in healthy young men: a randomized controlled trial. Am J Clin Nutr. 2011;94:479–85 [DOI] [PubMed] [Google Scholar]
- 52.Brown IJ, Stamler J, Van Horn L, Robertson CE, Chan Q, Dyer AR, Huang CC, Rodriguez BL, Zhao L, Daviglus ML, et al. Sugar-sweetened beverage, sugar intake of individuals, and their blood pressure: international study of macro/micronutrients and blood pressure. Hypertension. 2011;57:695–701 [DOI] [PMC free article] [PubMed] [Google Scholar]
- 53.Cox CL, Stanhope KL, Schwarz JM, Graham JL, Hatcher B, Griffen SC, Bremer AA, Berglund L, McGahan JP, Keim NL, et al. Circulating concentrations of monocyte chemoattractant protein-1, plasminogen activator inhibitor-1, and soluble leukocyte adhesion molecule-1 in overweight/obese men and women consuming fructose- or glucose-sweetened beverages for 10 weeks. J Clin Endocrinol Metab. 2011;96:E2034–8 [DOI] [PMC free article] [PubMed] [Google Scholar]
- 54.Welsh JA, Sharma A, Cunningham SA, Vos MB. Consumption of added sugars and indicators of cardiovascular disease risk among US adolescents. Circulation. 2011;123:249–57 [DOI] [PMC free article] [PubMed] [Google Scholar]
- 55.Stanhope KL, Bremer AA, Medici V, Nakajima K, Ito Y, Nakano T, Chen G, Fong TH, Lee V, Menorca RI, et al. Consumption of fructose and high fructose corn syrup increase postprandial triglycerides, LDL-cholesterol, and apolipoprotein-B in young men and women. J Clin Endocrinol Metab. 2011;96:E1596–605 [DOI] [PMC free article] [PubMed] [Google Scholar]
- 56.Pollock NK, Bundy V, Kanto W, Davis CL, Bernard PJ, Zhu H, Gutin B, Dong Y. Greater fructose consumption is associated with cardiometabolic risk markers and visceral adiposity in adolescents. J Nutr. 2012;142:251–7 [DOI] [PMC free article] [PubMed] [Google Scholar]


