

Abstract
We have visualized by cryo-electron microscopy (cryo-EM) the complex of the anthrax protective antigen (PA) translocon and the N-terminal domain of anthrax lethal factor (LFN) inserted into a nanodisc model lipid bilayer. We have determined the structure of this complex at a nominal resolution of 16 Å by single-particle analysis and three-dimensional reconstruction. Consistent with our previous analysis of negatively stained unliganded PA, the translocon comprises a globular structure (cap) separated from the nanodisc bilayer by a narrow stalk that terminates in a transmembrane channel (incompletely distinguished in this reconstruction). The globular cap is larger than the unliganded PA pore, probably due to distortions introduced in the previous negatively stained structures. The cap exhibits larger, more distinct radial protrusions, previously identified with PA domain three, fitted by elements of the NMFF PA prepore crystal structure. The presence of LFN, though not distinguished due to the seven-fold averaging used in the reconstruction, contributes to the distinct protrusions on the cap rim volume distal to the membrane. Furthermore, the lumen of the cap region is less resolved than the unliganded negatively stained PA, due to the low contrast obtained in our images of this specimen. Presence of the LFN extended helix and N terminal unstructured regions may also contribute to this additional internal density within the interior of the cap. Initial NMFF fitting of the cryoEM-defined PA pore cap region positions the Phe clamp region of the PA pore translocon directly above an internal vestibule, consistent with its role in toxin translocation.
Keywords: protective antigen, anthrax, pore translocon, lipid nanodiscs, lethal factor
INTRODUCTION
The protective antigen (PA) component of anthrax toxin delivers the two enzymic components of the toxin to the cytosol of mammalian cells, where the catalytic events for toxicity take place. After binding to host cell receptors and proteolytic activation, PA forms ring-shaped heptameric and octameric prepores, which are capable of binding the two enzymic moieties of the toxin (lethal factor, LF; and edema factor, EF) competitively and with high affinity (Kd ∼1 nM). The resulting complexes are endocytosed and transported to the endosomal compartment, where the prepores transform into membrane-inserted pores triggered by the acidic pH. These pores act as translocons, which unfold LF and EF and transport them across the endosomal membrane to the cytosol (see latest review).1
Prior to structural verification, biochemical and biophysical data indicated that domain 2 (residues 259–487) of the PA prepore rearranges to form a 100 Å-long beta barrel that connects the globular portion of the PA to the target membrane, forming a transmembrane pore. The overall shape of the translocon has been validated using both 2D and ultimately 3D electron microscopy.2–5 Low resolution reconstructions obtained by single particle analysis of EM images of negatively stained specimens verified the prediction that coordinated unfolding and refolding forms a long hollow stem between the globular “cap” of the PA and the membrane. Preliminary EM structures suggest that the lumen of the pore is not a smooth featureless surface. Rather, there may be various constrictions, and it is possible that associated dynamics in these regions play critical roles in controlling translocation of the enzymic toxin components. Extensive experimental evidence indicates that one of the most critical constrictions involves a flexible loop that contains Phe427.6 This region, called the Phe clamp, appears to contribute to interior bridges or ridges in our low resolution negatively stained reconstructions.4, 5 Higher resolution structures of the pore translocon will more precisely position the Phe clamp to help explain the dynamic movements that may be required in the function of this loop region.
We have recently developed a method relying on the high-affinity association of the PA with the truncated lethal factor (LFN) to isolate a relatively pure specimen of the anthrax translocon inserted into lipid nanodiscs, and have determined a preliminary 3D structure of the negatively-stained complex.7 Here we report the first use of these complexes for cryo-electron microscopy (cryoEM) imaging and 3D reconstruction. Nanodiscs when viewed edgewise have a distinct high-contrast shape that allows the use of automated particle selection procedures to potentially generate the large data sets of particles necessary for high resolution analysis.8–10 We have used a simple preparative procedure that preferentially displays the nanodiscs in edge-view, most useful for their identification and inherent angular variability. We have faced the problem of low contrast of the PA in these images, limiting the initial analysis to a modest (16 Å) nominal resolution. However, the structural envelope observed in the resulting cryoEM three dimensional reconstruction provides a much better representation of the outer surface of the PA pore compared to the considerable negative stain-induced shrinkage structure obtained from the previous three dimensional reconstructions. This more realistic envelope will provide adequate constraints for comparative high-resolution modeling of PA, which can then be explored using various molecular dynamic simulations.
RESULTS
In our earlier studies, preparation of the LFN–PA–nanodisc specimens for electron microscopy presented several problems. The samples appeared to be quasi-stable, in that the amount of PA visible in negatively stained preparations dropped precipitously in the hours following reconstitution and purification, possibly due to aggregation and adsorption of the nanodisc–PA complexes onto the walls of their containers. To avoid this problem, we prepared both cryoEM and negatively stained specimens immediately after the final step of purification. The apparent yield of PA–nanodisc complexes is substantially higher than in reconstitutions of other membrane proteins with detergent dialysis alone11; we estimate that 40–50% of the nanodiscs in the final purification contain one or more PA, judged by EM of negatively-stained samples.7 The presence of “empty” nanodiscs was unanticipated, given the extensive wash steps of the immobilized complexes in the first stage of purification. It is unclear whether they are a result of excess of lipid and membrane scaffold protein (modified apolipoprotein A-1) adsorbing nonspecifically to the matrix, instability of the PA in its pore conformation, or an effect of specimen preparation by negative staining. This heterogeneity of sample necessitates post-imaging identification of nanodiscs containing PA pore from those without the pore. A further heterogeneity is in the diameter of the nanodiscs, which varied from ∼100 Å to well over 500 Å in our preparations.
The majority of nanodiscs visible in negatively stained preparations are in edge-on orientations, which display the PA in all rotations about the axis normal to the nanodisc, presenting adequate views for a 3D analysis. In negatively stained images, apparent en face views of nanodiscs are also visible, though in much lower numbers than edge views. In our first cryoEM attempts, samples were frozen on perforated carbon films. Very few nanodiscs were visible over the holes, possibly due to preferred adsorption to the carbon, and the edge views were relatively indistinct. Some en face views of the nanodiscs may have been present in the cryoEM images, but in projection their lipid components do not adequately differ in density from that of the surrounding amorphous ice to be visible; moreover, en face orientations offer only one angular view of the PA, inadequate for 3D analysis. Hence to obtain adequate numbers of edge views of PA–nanodisc complexes, we used thin carbon films suspended over perforated carbon as supports. Though the presence of the carbon film reduces the contrast of biological material, the strong contrast of the lipid bilayer profile of nanodiscs allowed their ready identification and simplified the automated particle picking protocols (Fig. 1). However, the carbon layer significantly reduced the visibility of the PA pore outside the bilayer. Furthermore, the nanodisc edge views were found only in areas of relatively thick ice, additionally reducing the contrast of the PA pore in the cryoEM images. This factor was especially significant since the majority of nanodiscs in the usable preparations were much larger than their minimum “monomeric” size of approximately 100 Å diameter. A third imaging problem was the high contrast of the bilayer profile of the nanodiscs, which caused strong Fresnel fringes at the edges of nanodiscs, further suppressing the contrast of the PA pore.
Figure 1.
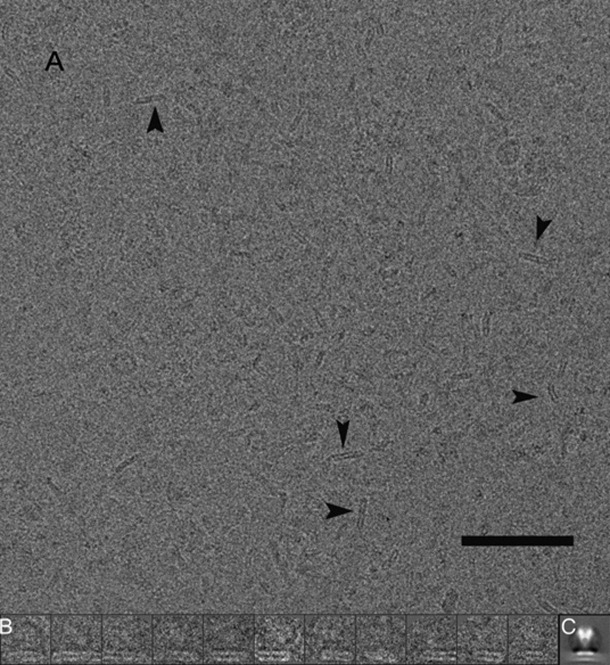
A: A cryoEM field displaying both nanodiscs and nanodisc–PA pore complexes; a few nanodiscs are indicated by arrowheads. The scale bar represents 1000 Å. B: Several of the 7083 nanodisc–PA pore complexes selected for 3D reconstruction is shown; for scale, the lateral dimension of each box is 304 Å. C: The images used for reconstruction were combined to yield a rotationally averaged projection of the LFN–PA nanodisc pore complex (same scale as in B).
The net effect of these multiple factors affecting image clarity was reduction of the projection density of the PA pore outside the nanodisc, to the extent that identification of LFN–PA pores was problematic. Simple visual inspection proved unreliable, so a multiple-step alignment and sorting protocol was developed to eliminate all but the most likely nanodisc–LFN–PA complexes. One cost of this procedure is the loss of many LFN–PA–nanodisc complexes from the data: 80% of all selected nanodisc images were rejected, rather than the anticipated 50–60% estimated from negative staining procedures. A related problem is the uncertainty that all selected particles do indeed contain LFN–PA, rather than some variation in background. Finally, the alignment of the low-contrast, noisy PA in these images is imperfect: 35% of the images had an obviously incorrect rotation, evident by the location of the nanodisc, and were rejected. Losses of particles due to the sorting and poor alignment, as well as the possible inclusion of PA-free nanodiscs, are factors that ultimately limited the resolution of the resulting 3D reconstruction to 16 Å.
The reconstructions of the unstained LFN–PA pore complex using three initial models (see image analysis in the Methods section) of varying detail display similar features, both in surface view and in central section (Fig. 2). Comparison of these alternative-model reconstructions to one another, after rotational alignment, by the Fourier shell correlation criterion yielded a comparative resolution of approximately 25 Å, providing an alternative estimate of the reliability of details in the structures obtained. The main body (cap) of the PA consists of seven vane-like protrusions projecting radially outward, with a slight twist with respect to the symmetry axis. The rather small portion of the nanodisc that was not masked out of the images is clearly represented by the headgroup regions below the PA cap, but the stalk connecting the cap to the nanodisc is obliterated by the strong Fresnel fringe in the images. As described in the Methods section, subtracting the bilayer and fringe reduced this imaging artifact in averaged projections (Supporting Information Fig. S2, panel B), but failed to reduce its effect in the reconstruction. There is no indication of the membrane-spanning sequence of the translocon, presumably because of its small size relative to the depth of nanodisc in the majority of the images.
Figure 2.
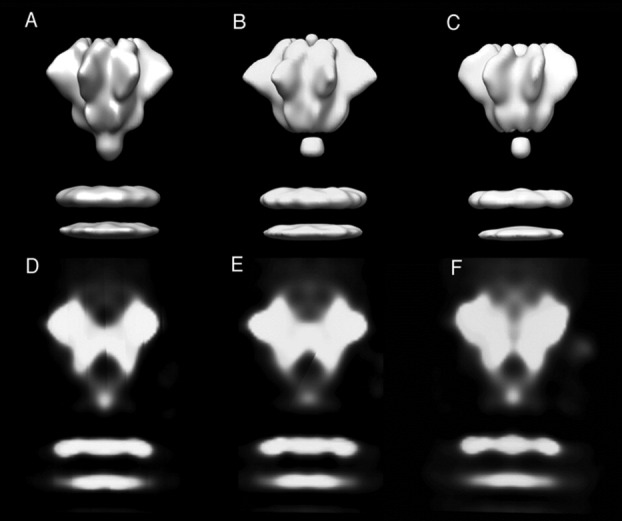
A–C: Surface representations of the LFN–PA pore cryoEM reconstructions using the starting models: (A) 25 Å resolution negative stain EM structure; (B) structure in A, Fourier filtered to a resolution of 100 Å; (C): simple cylinder model, Fourier filtered at 100 Å. D–F: Central sections of the reconstructions (∼15 Å thick) that illustrate the internal structure of the reconstructions in A–C.
Cross-sections of the reconstructions [Fig. 2(D–F)] provide a view of the interior of the PA structure. A cup-like indentation is located at the top of the structure, and contains diffuse low density. The base of the indentation appears to comprise a substantial layer of protein density forming a horizontal barrier. In some sections, a narrow low-density channel penetrates this barrier, for example visible in Figure 2(E). An apparently open chamber resides below the horizontal barrier, presumably feeding into the translocon channel, just before the stalk becomes obliterated by the Fresnel fringe imaging artifact.
Fitting of LFN–PA–nanodisc and PA–nanodisc negative stain 3D structures in to LFN–PA–nanodisc cryo 3D structure at the same thresholded values suggests that empty volume at “top” of PA cap region is most likely due to presence of LFN [Fig. 3(C)]. It is apparent that the size of the nanodisc in the stained unliganded PA pore structure is smaller in the LFN–PA pore. This difference in nanodisc length and thickness is due to deliberate masking of the prominent electron dense membrane during the previous reconstruction process,5 a step not used in the more recent work. There are also differences between the cryoEM and negative stain structures of the LFN–PA pore that may be attributed to artifacts of the process of negative staining, discussed below. In the stained structure, the extra density at the PA pore rim attributed to LFN is not as large as that in the cryoEM structure [Fig. 3(A)]. Besides the possible effects of staining and dehydration, this difference may be influenced by the lower nominal resolution of the negative stain reconstruction compared to its cryoEM counterpart (25 vs. 16 Å.). However, both of the LFN–PA pore reconstructions exhibit extra volume at the most membrane-distal region of the PA cap when compared to the unliganded PA pore [Fig. 3(B,C)].
Figure 3.
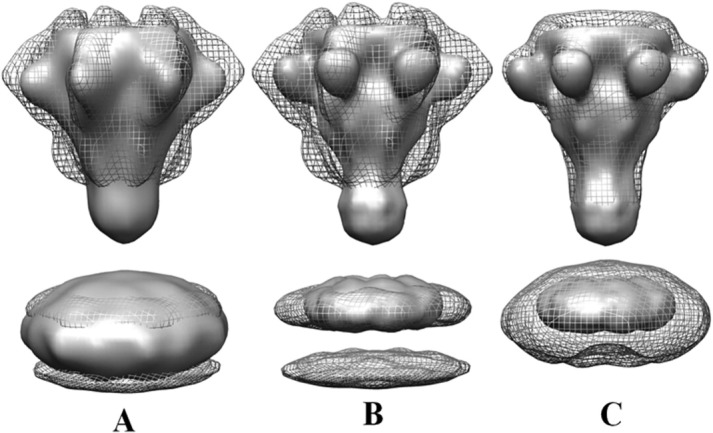
Comparison of cryoEM and negatively stained LFN–PA pore–nanodisc structures with negatively stained unliganded PA–nanodisc reconstruction. A: cryoEM LFN–PA pore–nanodisc in mesh view and negative stain LFN–PA pore–nanodisc in surface view.7 B: cryoEM LFN–PA pore–nanodisc in mesh view and negative stain unliganded PA–nanodisc in surface view.5 C: Both negatively stained structures, LFN–PA pore–nanodisc in mesh view and PA pore–nanodisc in surface view.
DISCUSSION
The cryoEM reconstruction of the LFN–PA pore complex is compared to the previous negative stain structures of unliganded PA pore and LFN–PA pore in Figures 3 and 5. The overall dimensions of the structures are similar, with the cryoEM reconstruction somewhat taller and wider, presumably due to a combination of differences in specimen preparation and the addition of LFN to the cryoEM specimen (in comparison with the unliganded PA pore). A major distinction between the two types of reconstructions is the prominence of the radial protrusions of the PA pore in the cryoEM structure, most like corresponding to PA domain 3 (residues 488–595) and a part of domain 2. These vane-like structures are represented in the negative stain reconstructions as more compact globular masses, probably due to the drying of the PA pore in the process of negative staining. The overall height of the cryoEM LFN–PA pore complex is substantially increased compared to the negatively stained unliganded PA pore, as well as the negatively stained LFN–PA pore, most likely a combination of the better preservation of native structure in amorphous ice, as well as the presence of LFN in the cryoEM sample (Fig. 3). The number of LFN molecules bound per heptameric PA has not been determined for the complexes used in this work. However, the crystal structure of the octameric prepore–LF complex3 contains four LF molecules bound to the PA octamer, on the surface facing away from the membrane, situated between pairs of PA subunits. In the case of the PA heptamer, a maximum of three LFN are likely to bind, in similar positions. The presence of excess LFN (cleaved off the immobilized bead surface), combined with the nanomolar Kd of PA for LFN, makes it likely that three binding sites on heptameric PA pore are occupied by LFN. Our reconstruction of the LFN–PA pore has seven-fold symmetry imposed, a symmetry mismatch that reduces the density of the LFN, though not uniformly at the low resolution of this reconstruction. Hence the LFN may appear distributed on the PA heptamer rim, at a reduced size when a surface compatible with the PA volume is used for visualization. The fitting of elements of the NMFF generated PA pore crystal structure5 to the EM density (discussed below, and shown in Figure 4 this work and in Figure 3 from our recent publication7) leaves space not occupied by the PA heptamer at the rim of the reconstruction. The presence of this unaccounted-for volume is consistent with the proposed distributed location of LFN.
Figure 5.
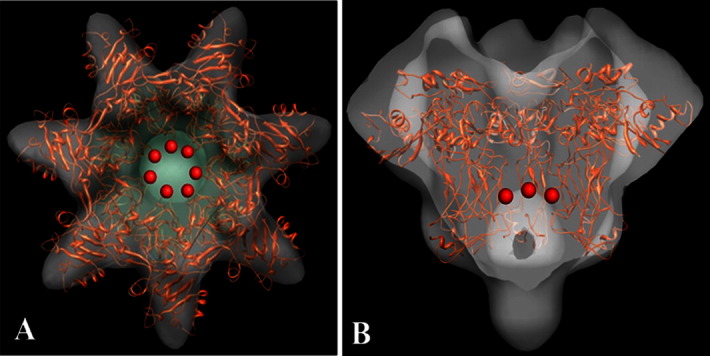
Preliminary fitting of PA pore X-ray crystallographic coordinates (truncated prepore to pore structure from NMFF fitting51TZO) in to the new LFN–PA pore EM density in (A) top and (B) cutaway side. Red spheres in represent the approximate locations of Phe427 (middle of flexible Phe clamp loop) that positions this clamp above the vestibule leading to the rest of the internal pore lumen.
Figure 4.
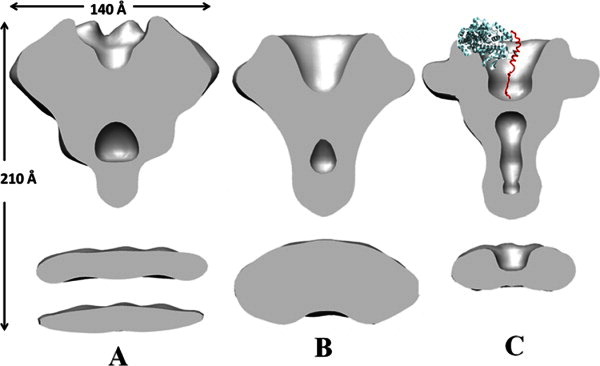
Cutaway surface views of LFN–PA pore and PA pore reconstructions. A: CryoEM PA–LFN pore reconstruction shown in Figure 2(A), with approximate dimensions indicated. B: Negative stain reconstruction of PA-LFN pore.7 C: Negative stain reconstruction of unliganded PA pore5; a molecule of LFN (N terminal fragment of 1JZN) is superimposed to indicate its proposed location in Figure 3(A,B). Nominal resolution of both negative stain reconstructions is 25 Å.
Cutaway views of the cryoEM and negative stain reconstructions (Fig. 4) illustrate the differences noted above, the radial and upward extensions of the PA. They also provide a comparison of the internal structures. In contrast to the better-defined “cup” in the unliganded negative stain structure (4C), the cryoEM LFN–PA pore reconstruction, and to a lesser extent the negative stain structure of LFN–PA pore contains diffuse density in this region, as well as a thicker base. These density differences may be a reflection of native protein conformations eliminated by drying in negative stain, or a conformation induced by binding of LFN. Indeed, the unstructured ∼15 N-terminal residues of LFN may themselves contribute somewhat to the density differences as they extend toward the translocon channel,3, 12, 13 though they do not have adequate mass to explain the changes visualized. The low-density region below the bottom wall of the cup forms a clearly-defined stain-filled vestibule that extends into the stalk of the negative stain PA pore reconstruction [Fig. 3(C)]. The upper portion of this vestibule is also indicated in the LFN–PA pore structures [Fig. 4(A,B)], though its extent is eliminated, along with the stalk, by the Fresnel fringe problem.
In our previous work, the NMFF fitting of the truncated PA prepore crystal structure (1TZO) into the negative stain EM reconstruction resulted in a correlation score of 0.89.5 This fitted structure was now positioned into the 16 Å cryoEM density map by rigid-body fitting only (Fig. 5). Surprisingly, even the minor changes allowed by a rigid body fit resulted in a slightly higher correlation of 0.91. The primary reason for this improvement appears to be the visualization of a smaller radial density corresponding to PA domain 2 in the lower cap region just before the beginning of the beta barrel. In comparison, this part of the PA was greatly reduced in the negative stain reconstructions [compare side views Fig. 4(B,C)]. In addition, the Phe427 (unresolved in the crystal structure) region, as judged by the nearest resolved residue (Asp424) seems to have been placed the density bridge formed right above the internal vestibule discussed above [Fig. 5(A,B)]. The empty volume at the “top” of the PA, presumably occupied in some of the locations by LFN, was not fitted with the LFN crystal structure, since the seven symmetrical positions are expected to be occupied only partially.
The work reported here is a step in determining the high-resolution structure of the anthrax translocon in various stages of toxin passage. In this preliminary work, resolution was limited in part by the thickness of ice required to capture the PA–nanodisc complexes in edge-view, leading to elimination of most of the recorded images due to uncertainty in the presence of PA. We have recently found experimental conditions that minimize the size of the PA–nanodisc complex, which may allow use of thinner ice, leading to higher contrast of the protein component. We are also exploring alternative schemes for binding the complexes to a solid matrix, thus allowing the direct comparison of unliganded with variously liganded PA structures. A range of higher-resolution EM reconstructions of PA–nanodisc complexes will provide better restraints to use in the molecular modeling and dynamic simulations of translocon mechanics.
METHODS
Expression and purification of proteins
Wild type PA was expressed recombinantly in the periplasm of Escherichia coli BL21 (DE3) and purified by anion exchange chromatography.14 PA prepore was formed activating PA with trypsin and purified by anion-exchange chromatography after activation of PA with trypsin. QuikChange Site-Directed Mutagenesis (Stratagene) was used to introduce mutations into plasmids [pETSUMO (Invitrogen)] encoding recombinant LFN E126C, consisting of residues 1–263, with the indicated amino acid modification. Mutants were expressed as His6-SUMO-LFN variants, which were subsequently cleaved by SUMO protease, revealing the native LFN E126C amino terminus.15 His-tagged membrane scaffold protein 1D1 (MSP1D1 was provided by the S. Sligar laboratory; all genetic constructs are available from AddGene (http://www.addgene.org/pgvec1) MSP1D1 was expressed recombinantly in the periplasm of E. coli BL21 (DE3) and purified by immobilized Ni-NTA affinity chromatography as described previously.11
Preparation of LFN–PA pore in nanodiscs
LFN–PA pore–nanodisc complexes were formed and purified according to a previously described method.7 Briefly, 100 μL of LFN E126C affinity beads were packed into a spin column (Pierce Centrifuge Columns 0.8 mL, Thermo scientific, USA) and equilibrated with 50 mM NaCl, 50 mM Tris-HCl, pH 7.5 (Buffer A). About 200 μL of 0.2 μM PA prepore was applied to the spin column to bind LFN affinity beads. The prepore was converted to pore incubating for 5 min at 37°C in the presence of 1M urea. The beads with bound PA pore were spun at low speed for 30 sec to remove the supernatant. A mixture of His tagged membrane scaffold protein (MSP1D1), palmitoyloleoyl phosphatidylcholine (POPC) and cholate was added to the PA pore bound to the LFN E126C beads, and dialyzed against buffer to remove the cholate and form nanodiscs. The LFN beads were collected after dialysis, and washed extensively with Buffer B (50 mM NaCl, 50 mM Tris-HCl, pH 7.5, and 0.5 mM EDTA) to remove any empty nanodiscs. The LFN–PA–nanodisc complex was covalently uncoupled from the bead matrix by disulfide reduction with 50 mM dithiothreitol (DTT). The eluted complex was applied to a second spin column containing Ni-NTA resin to bind the newly formed nanodiscs. The column was washed with Buffer A to remove nanodisc-free PA aggregates, as well as any lipid vesicles. The LFN–PA–nanodisc complexes were then eluted from the Ni-NTA column with Buffer A containing 100 mM imidazole and used for cryoEM grid preparation within 1 h of elution.
CryoEM specimen preparation and data collection
Aliquots of 3–4 μL of purified LFN–PA pore–nanodisc sample were applied to EM support grids consisting of a layer of perforated carbon supporting a thin solid carbon film. Grids were either prepared from carbon films with regular arrays of holes (Quantifoil) that we coated with a thin solid carbon film, or purchased as lacy carbon films precoated with solid carbon (Ted Pella). Grids were manually blotted after 1min of absorption, plunged into liquid ethane, and transferred to and stored in liquid nitrogen. Specimen preparation was complete within 10–30 min of elution of the LFN–PA pore–nanodisc complexes. Samples were prepared in parallel by negative staining with methylamine tungstate at neutral pH for confirmation of successful PA pore nanodisc formation.
Negatively stained specimens were examined using a JEOL 1200 EXII electron microscope to verify the presence of LFN–PA pore–nanodisc complexes. Representative cryoEM grids were screened using the same microscope to select preparations with adequate concentrations of nanodiscs and the presence of appropriate thicknesses of ice on the grids. Higher-resolution data collection was performed at NRAMM at the Scripps Research Institute, recording images using Leginon16 on an FEI Tecnai F20 Twin electron microscope over the course of approximately 48 h of microscope time. Images were recorded on a Tietz F415 4k × 4k CCD camera, using a magnification that resulted in a pixel size 1.69 Å, over a range of defocus values of one to five microns, and at a dose of approximately 10 e−/Å2. Five cryoEM grids were examined, two of which were used to record approximately 1800 micrographs. Approximately, 400 of these micrographs were rejected by inspection and/or examination of Fourier transforms, due to gross contamination, paucity of nanodiscs, or apparent systematic charging of the sample.
Image analysis
Defocus values for each image were determined by ACE2 or ctfFind used in the Appion image processing suite.17 Fits for about half the images were quite poor, and were repeated locally with ACE,18 and the few images with indeterminate defocus were rejected. About 100 nanodisc images were manually selected and averaged from 30 micrographs. This averaged image was used as a template to automatically select coordinates of approximately 56,000 initial images from all micrographs and displayed with Boxer.19 Since many of the “particles” corresponded to edges of carbon support film holes or obvious ice contamination, the displays of each image were manually edited to discard approximately one-third of the initial coordinates in order to reduce aberrant selections, leaving 35,000 particles.
Images were corrected for phase inversion and aligned to a horizontal nanodisc reference image using EMAN.19 Misaligned nanodiscs were rejected, leaving 23,000 horizontally aligned nanodiscs. To identify those nanodiscs that contain one or more LFN–PA pore–nanodisc, the horizontally aligned images were translationally aligned to a reference of manually selected cryoEM nanodisc images that appear to contain PA pore. Since the PA pore is not easily visible in most of the images, both “sides” of the nanodisc were aligned to maximize the identification of PA-containing nanodiscs. Correlation coefficients of the aligned particles, even when limited to the area of the presumed PA pore, were not sufficiently discriminatory to identify those nanodiscs with PA pore, since other structures or contaminants gave false positives. The aligned images were thus analyzed by correspondence analysis and hierarchical classification, as implemented in SPIDER.20 Each class that appeared consistent with the presence of a PA pore embedded in the nanodisc was then correlated to the average of the class, and a correlation coefficient cutoff was selected to eliminate particles so as to maximize the presence of density consistent with a PA pore complex. This procedure to isolate the PA pore-containing nanodiscs, and align the density in the image with a crude average, yielded a total of 7083 particles deemed likely to represent the LFN–PA pore–nanodisc complex.
3D reconstruction of the LFN–PA pore–nanodisc complex was performed using SPIDER by projection matching and iterative refinement of the images to three different initial models: (1) the PA–nanodisc complex reconstruction previously derived from negatively-stained particles4; (2) the negative stain reconstruction Fourier filtered to a resolution of 100 Å; and (3) a simple two-cylinder model of PA perched on a model bilayer, likewise Fourier filtered. The latter two models were used to test for model bias in the analysis. In each case, model projections were initially calculated at 5° angular increments, applying seven-fold symmetry, and subsequently reduced in steps to 1° increments during refinement. Since the PA density is very weak in these images, particularly compared to the strong nanodisc density, the rotationally pre-aligned images were limited to a ± 20° maximum in-plane rotation to avoid obvious misalignment. Furthermore, since the images selected are edge-views of the nanodisc, the maximum out-of-plane rotation was also limited to 20°, rejecting the images that fell outside this range. Finally, images that met these criteria but whose correlation to their corresponding projections was in the bottom 20% were also eliminated. Fourier reconstruction of the resulting images was by inverse transformation of the interpolated Fourier transform, and iterative refinement was performed until fewer than 5% of the images changed between classes. Resolutions of the reconstructions were calculated by Fourier shell correlation, and a limit of 0.5 yielded a resolution of 16 Å for each reconstruction. Amplitude corrections were estimated and applied to the final reconstructions by comparing the power spectrum of the reconstruction with the X-ray scattering curve from a macromolecular complex of similar size, GroEL.21 The amplitude correction failed to eliminate the very strong Fresnel fringe outlining the nanodisc, even when boosted at low resolution.
Fitting of CryoEM density map into negative stain density map
In order to overlay and compare the cryoEM LFN–PA pore–nanodisc structure with previous negative stain 3D structures of the LFN–PA pore–nanodisc7 and unliganded PA pore–nanodisc complexes,5 the reconstructions were adjusted to the same voxel size and aligned with Chimera.22 Volume representations, as either solid or mesh surfaces, were represented at approximately the sharpest fall-off in density.
Fitting of the crystal structure of PA to the cryoEM density map
In our previous work,5 the 2.8 Å X-ray crystallographic structure (PDB Id: 1TZO) of PA was flexibly fitted onto the electron density map of the PA pore structure obtained using negative staining EM, using the Normal Mode Flexible Fitting package.23 The final Cα trace obtained was refitted to the cryoEM density manually using Chimera.22 The Cα trace was then refined to produce a full atomic structure. First, the backbone atoms were added using the program pulchra24 followed by the addition of the side chain rotamers by SCRWL.25 The full atomic structure thus obtained was further refined using Fragment Guided Molecular Dynamics (FG-MD)26 to generate an energetically reasonable structure. During this process the Cα atoms are kept rigid by imposing a strong restraint potential. The final full atomic model was then re-fitted by rigid body fitting onto the cryoEM density map using Chimera.
Supplementary material
Additional Supporting Information may be found in the online version of this article.
References
- 1.Feld GK, Brown MJ, Krantz BA. Ratcheting up protein translocation with anthrax toxin. Protein Sci. 2012;21:606–624. doi: 10.1002/pro.2052. [DOI] [PMC free article] [PubMed] [Google Scholar]
- 2.Vernier G, Wang J, Jennings LD, Sun J, Fischer A, Song L, Collier RJ. Solubilization and characterization of the anthrax toxin pore in detergent micelles. Protein Sci. 2009;18:1882–1895. doi: 10.1002/pro.199. [DOI] [PMC free article] [PubMed] [Google Scholar]
- 3.Feld GK, Thoren KL, Kintzer AF, Sterling HJ, Tang II, Greenberg SG, Williams ER, Krantz BA. Structural basis for the unfolding of anthrax lethal factor by protective antigen oligomers. Nat Struct Mol Biol. 2010;17:1383–1390. doi: 10.1038/nsmb.1923. [DOI] [PMC free article] [PubMed] [Google Scholar]
- 4.Katayama H, Janowiak BE, Brzozowski M, Jurcyk J, Falke S, Gogol EP, Collier RJ, Fisher MT. GroEL as a molecular scaffold for structural analysis of the anthrax toxin pore. Nat Struct Mol Biol. 2008;15:754–760. doi: 10.1038/nsmb.1442. [DOI] [PMC free article] [PubMed] [Google Scholar]
- 5.Katayama H, Wang J, Tama F, Chollet L, Gogol EP, Collier RJ, Fisher MT. Three-dimensional structure of the anthrax toxin pore inserted into lipid nanodiscs and lipid vesicles. Proc Natl Acad Sci USA. 2010;107:3453–3457. doi: 10.1073/pnas.1000100107. [DOI] [PMC free article] [PubMed] [Google Scholar]
- 6.Krantz BA, Melnyk RA, Zhang S, Juris SJ, Lacy DB, Wu Z, Finkelstein A, Collier RJ. A phenylalanine clamp catalyzes protein translocation through the anthrax toxin pore. Science. 2005;309:777–781. doi: 10.1126/science.1113380. [DOI] [PMC free article] [PubMed] [Google Scholar]
- 7.Akkaladevi N, Hinton-Chollet L, Katayama H, Mitchell J, Szerszen L, Gogol EP, Pentelute B, Collier RJ, Fisher MT. Assembly of anthrax toxin pore: lethal-factor complexes into lipid nanodiscs. Protein Sci. 2013 doi: 10.1002/pro.2231. Article first published online: 26 FEB 2013 DOI: 10.1002/pro.2231. [DOI] [PMC free article] [PubMed] [Google Scholar]
- 8.Carragher B, Kisseberth N, Kriegman D, Milligan RA, Potter CS, Pulokas J, Reilein A. Leginon: an automated system for acquisition of images from vitreous ice specimens. J Struct Biol. 2000;132:33–45. doi: 10.1006/jsbi.2000.4314. [DOI] [PubMed] [Google Scholar]
- 9.Zhu Y, Carragher B, Glaeser RM, Fellmann D, Bajaj C, Bern M, Mouche F, de Haas F, Hall RJ, Kriegman DJ, Ludtke SJ, Mallick SP, Penczek PA, Roseman AM, Sigworth FJ, Volkmann N, Potter CS. Automatic particle selection: results of a comparative study. J Struct Biol. 2004;145:3–14. doi: 10.1016/j.jsb.2003.09.033. [DOI] [PubMed] [Google Scholar]
- 10.Lyumkis D, Moeller A, Cheng A, Herold A, Hou E, Irving C, Jacovetty EL, Lau PW, Mulder AM, Pulokas J, Quispe JD, Voss NR, Potter CS, Carragher B. Automation in single-particle electron microscopy connecting the pieces. Methods Enzymol. 2010;483:291–338. doi: 10.1016/S0076-6879(10)83015-0. [DOI] [PubMed] [Google Scholar]
- 11.Ritchie TK, Grinkova YV, Bayburt TH, Denisov IG, Zolnerciks JK, Atkins WM, Sligar SG. Chapter 11—reconstitution of membrane proteins in phospholipid bilayer nanodiscs. Methods Enzymol. 2009;464:211–231. doi: 10.1016/S0076-6879(09)64011-8. [DOI] [PMC free article] [PubMed] [Google Scholar]
- 12.Jennings-Antipov LD, Song L, Collier RJ. Interactions of anthrax lethal factor with protective antigen defined by site-directed spin labeling. Proc Natl Acad Sci USA. 2011;108:1868–1873. doi: 10.1073/pnas.1018965108. [DOI] [PMC free article] [PubMed] [Google Scholar]
- 13.Janowiak BE, Jennings-Antipov LD, Collier RJ. Cys–Cys cross-linking shows contact between the N-terminus of lethal factor and Phe427 of the anthrax toxin pore. Biochemistry. 2011;50:3512–3516. doi: 10.1021/bi1017446. [DOI] [PMC free article] [PubMed] [Google Scholar]
- 14.Miller CJ, Elliott JL, Collier RJ. Anthrax protective antigen: prepore-to-pore conversion. Biochemistry. 1999;38:10432–10441. doi: 10.1021/bi990792d. [DOI] [PubMed] [Google Scholar]
- 15.Wigelsworth DJ, Krantz BA, Christensen KA, Lacy DB, Juris SJ, Collier RJ. Binding stoichiometry and kinetics of the interaction of a human anthrax toxin receptor, CMG2, with protective antigen. J Biol Chem. 2004;279:23349–23356. doi: 10.1074/jbc.M401292200. [DOI] [PubMed] [Google Scholar]
- 16.Suloway C, Pulokas J, Fellmann D, Cheng A, Guerra F, Quispe J, Stagg S, Potter CS, Carragher B. Automated molecular microscopy: the new Leginon system. J Struct Biol. 2005;151:41–60. doi: 10.1016/j.jsb.2005.03.010. [DOI] [PubMed] [Google Scholar]
- 17.Lander GC, Stagg SM, Voss NR, Cheng A, Fellmann D, Pulokas J, Yoshioka C, Irving C, Muldea A, Lau P-W, Lyumkis D, Potter CS, Carragher B. Appion: an integrated, database-driven pipeline to facilitate EM image processing. J Struct Biol. 2009;166:95–102. doi: 10.1016/j.jsb.2009.01.002. [DOI] [PMC free article] [PubMed] [Google Scholar]
- 18.Mallick SP, Carragher B, Potter CS, Kriegman DJ. ACE: automated CTF estimation. Ultramicroscopy. 2005;104:8–29. doi: 10.1016/j.ultramic.2005.02.004. [DOI] [PubMed] [Google Scholar]
- 19.Ludtke SJ. 3-D structures of macromolecules using single-particle analysis in EMAN. Methods Mol Biol. 2010;673:157–173. doi: 10.1007/978-1-60761-842-3_9. [DOI] [PubMed] [Google Scholar]
- 20.Frank J, Radermacher M, Penczek P, Zhu J, Li Y, Ladjadj M, Leith A. SPIDER and WEB: processing and visualization of images in 3D electron microscopy and other fields. J Struct Biol. 1996;116:190–199. doi: 10.1006/jsbi.1996.0030. [DOI] [PubMed] [Google Scholar]
- 21.Ludtke SJ, Jakana J, Song JL, Chuang DT, Chiu W. A 11.5 A single particle reconstruction of GroEL using EMAN. J Mol Biol. 2001;314:253–262. doi: 10.1006/jmbi.2001.5133. [DOI] [PubMed] [Google Scholar]
- 22.Pettersen EF, Goddard TD, Huang CC, Couch GS, Greenblatt DM, Meng EC, Ferrin TE. UCSF Chimera—a visualization system for exploratory research and analysis. J Comput Chem. 2004;25:1605–1612. doi: 10.1002/jcc.20084. [DOI] [PubMed] [Google Scholar]
- 23.Tama F, Miyashita O, Brooks CL., III Flexible multi-scale fitting of atomic structures into low-resolution electron density maps with elastic network normal mode analysis. J Mol Biol. 2004;337:985–999. doi: 10.1016/j.jmb.2004.01.048. [DOI] [PubMed] [Google Scholar]
- 24.Rotkiewicz P, Skolnick J. Fast procedure for reconstruction of full-atom protein models from reduced representations. J Comput Chem. 2008;29:1460–1465. doi: 10.1002/jcc.20906. [DOI] [PMC free article] [PubMed] [Google Scholar]
- 25.Canutescu AA, Shelenkov AA, Dunbrack RL., Jr A graph-theory algorithm for rapid protein side-chain prediction. Protein Sci. 2003;12:2001–2014. doi: 10.1110/ps.03154503. [DOI] [PMC free article] [PubMed] [Google Scholar]
- 26.Zhang J, Liang Y, Zhang Y. Atomic-level protein structure refinement using fragment-guided molecular dynamics conformation sampling. Structure. 2011;19:1784–1795. doi: 10.1016/j.str.2011.09.022. [DOI] [PMC free article] [PubMed] [Google Scholar]
Associated Data
This section collects any data citations, data availability statements, or supplementary materials included in this article.