

Abstract
A key goal in molecular evolution is to extract mechanistic insights from signatures of selection. A case study is codon usage, where despite many recent advances and hypotheses, two longstanding problems remain: the relative contribution of selection and mutation in determining codon frequencies and the relative contribution of translational speed and accuracy to selection. The relevant targets of selection—the rate of translation and of mistranslation of a codon per unit time in the cell—can only be related to mechanistic properties of the translational apparatus if the number of transcripts per cell is known, requiring use of gene expression measurements. Perhaps surprisingly, different gene-expression data sets yield markedly different estimates of selection. We show that this is largely due to measurement noise, notably due to differences between studies rather than instrument error or biological variability. We develop an analytical framework that explicitly models noise in expression in the context of the population-genetic model. Estimates of mutation and selection strength in budding yeast produced by this method are robust to the expression data set used and are substantially higher than estimates using a noise-blind approach. We introduce per-gene selection estimates that correlate well with previous scoring systems, such as the codon adaptation index, while now carrying an evolutionary interpretation. On average, selection for codon usage in budding yeast is weak, yet our estimates show that genes range from virtually unselected to average per-codon selection coefficients above the inverse population size. Our analytical framework may be generally useful for distinguishing biological signals from measurement noise in other applications that depend upon measurements of gene expression.
Keywords: selection, codon usage, gene expression, noise
Introduction
Codons encoding the same amino acid, although synonymous with respect to the protein sequence, appear in most genes at unequal frequencies. These frequencies differ markedly from those expected from genomic nucleotide composition alone, suggesting the action of selection in addition to mutational biases. The selective force at work has long been linked to protein synthesis—translation—by multiple convergent lines of evidence. Across taxa, genes with higher expression show stronger biases toward a subset of codons (Ikemura 1981, 1982). Further, the frequency of codons in a genome correlates with the abundance of their cognate transfer RNAs (tRNAs), and the correlation is higher in highly expressed genes (Ikemura 1981, 1982; Kanaya et al. 2001). Similar effects have been found in diverse organisms, from bacteria to mammals (Kanaya et al. 2001; Drummond and Wilke 2008; Plotkin and Kudla 2011), arise in all codon families, and span the full length of genes.
We aim to estimate the strength of translational selection on codon usage (SCU). Doing so in a meaningful way requires an understanding of the mechanistic basis of this selection. Recently, numerous observations and hypotheses about codon usage have emerged: Rare synonymous codons induce translational pausing to allow proteins to fold (Kimchi-Sarfaty et al. 2007); a stretch of codons ordered roughly by genomic frequency populate the 5′-end of coding sequences, putatively slowing ribosome transit early in the coding sequence (Tuller et al. 2010); in bacteria, codons which mimic the 16S ribosomal RNA-binding Shine–Dalgarno sequence are used at low frequency to avoid stalling ribosomes (Li et al. 2012); and codons at the 5′-end of mRNAs avoid forming stable RNA structures with their neighbors to facilitate ribosomal initiation (Kudla et al. 2009; Gu et al. 2010). Although these phenomena are of major interest, they address only a small subset of sites or codons, such that none of them can explain the core genome-wide signature of translational selection described earlier.
Although there is ongoing debate on the underlying causes of translational selection, the menu of viable mechanistic hypotheses remains short. Synonymous codons have been found to differ in the speed (Sørensen et al. 1989) and the accuracy with which they are translated (Dix and Thompson 1989; Kramer and Farabaugh 2007; Kramer et al. 2010). Both forms of selection play some role (Hershberg and Petrov 2008; Qian et al. 2012), though their relative contributions remain a matter of debate. Either of these causes is also compatible with the observed correlation between codon preference, gene expression, and cognate tRNA abundance. Because the first step of tRNA binding on the ribosome is thought to be proportional to the tRNA abundance (Zaher and Green 2009), increasing the level of a codon’s cognate tRNA will increase both the codon’s speed and accuracy of translation. We argue below that selection on either speed or accuracy leads to SCU that scales with gene expression.
The speed hypothesis attributes selection on synonymous codons to differences in the rate at which ribosomes make complete proteins (Andersson and Kurland 1990; Bulmer 1991) (fig. 1). The rate of ribosomal initiation on an mRNA, considered rate limiting for protein synthesis (Mathews et al. 2007), is proportional to both the number of transcripts and the number of free ribosomes. Coding an mRNA with codons that are translated more rapidly allows ribosomes to complete translation sooner, freeing them to initiate translation of a new message and leading to a global increase in the rate of initiation. The global protein synthesis rate increase resulting from use of a faster codon is roughly proportional to the rate of ribosomal reads at that codon, which is in turn proportional to the mRNA expression level of the gene containing that codon. For organisms whose evolutionary success depends on their growth rate, and thus on the rate of protein synthesis, use of a faster codon leads to a selective advantage proportional to the level of gene expression. The speed hypothesis explains a constellation of correlations between bacterial growth rate, ribosomal RNA copy number, codon usage, tRNA copy number, and gene expression level (Vieira-Silva and Rocha 2010).
Fig. 1.

Selection on speed and accuracy. (A) Free ribosomes initiate translation of an mRNA and begin elongation. Initiation is rate limiting for translation, and the availability of free ribosomes is affected by the rate of elongation, as the quicker a ribosome completes elongation and termination, the sooner it may initiate on another mRNA. Some proteins are produced with errors or mistranslation events. Though errors are rare, mistranslated proteins are more likely to misfold. (B) The number of ribosomes occupied, and the number of misfolded proteins produced, per gene, are each proportional to gene expression.
The accuracy hypothesis attributes selection on synonymous codons to differences in the accuracy with which they are translated (fig. 1). Tests specific for accuracy selection reveal its action in genomes from bacteria to mammals (Akashi 1994; Stoletzki and Eyre-Walker 2007; Drummond and Wilke 2008). Approximately one in every  ribosomal reads of a codon results in a mistranslation in vivo (Ogle and Ramakrishnan 2005), such that very roughly, one in five average-length proteins will be translated with at least one error, an unknown but presumably small fraction of which will disrupt folding and function. Misfolded proteins possess intrinsic cytotoxicity (Drummond and Wilke 2009; Geiler-Samerotte et al. 2011), which reduces fitness in proportion to the number of misfolded proteins produced (Geiler-Samerotte et al. 2011). Consequently, the per-generation fitness cost or benefit of changing accuracy at a particular codon is the accuracy change at one codon multiplied by the number of codon reads per generation, which is again proportional to the expression level of the gene in question.
The key question is, how to estimate the per-ribosomal-read fitness cost of substituting one codon with its synonym from observed codon usage patterns? A recent major advance in quantifying mutation bias and SCU was made by Shah and Gilchrist (2011), who introduced a model that exploits an exact analogy between the codon frequencies predicted from population genetics (Bulmer 1991; Sella and Hirsh 2005) and a standard method in statistics called multinomial logistic regression (Gelman and Hill 2007). The dependence of selection on gene expression allows this model to disentangle the effects of mutation and selection, based on the assumption that selective pressures scale with gene expression, while mutational biases do not. Although the original model attributes selection to speed through the free-ribosome mechanism described above, it is equally compatible with accuracy selection, because it requires only that the selection pressure scale with gene expression level.
Gene expression levels vary in vivo and, similar to all empirical quantities, are measured with error. Following Raser and O’Shea (2005), we use the term “noise” in gene expression to refer to “the measured level of variation in gene expression among cells, regardless of source, within a supposedly identical population.” Such noise in gene expression, if unaccounted for, distorts estimates of selection and mutation. The core problem can be understood by thinking about the inferences of selection and mutation expected if expression measurements were very noisy: Codon frequencies would necessarily correlate poorly with such measurements, leading to an apparently small effect of selection and inflating the effects of mutation. We show that selection and mutation coefficients predicted from different expression measurements differ systematically consistent with differing noise levels in these data. Moreover, we show that noise in gene expression leads to dramatic underestimation of selection and misestimation of mutational bias: If noise is substantial enough, selection is inferred to be absent.
We present an analytical framework that explicitly accounts for noise in measured gene expression, allowing unbiased estimation of the underlying selection and mutation coefficients in the presence of moderate-to-high amounts of noise. At the core of this method is a probabilistic model for observed gene expression that depends on the true but unobservable gene expression, which is encoded by a latent variable, as well as a model for the distribution of this latent gene expression. These models are combined with the population genetics model used in Shah and Gilchrist (2011) for codon usage conditional on latent gene expression. Using a combination of real and simulated data, we assess the extent of the bias expected from noise-blind methods, in a range of transcriptional noise settings. These confirm that noise-blind methods underestimate the strength of selection, whereas our framework gives unbiased estimates of selection and mutation, even with moderate to high noise in expression measurements.
Applying this framework to budding yeast, we infer selection coefficients which, although still compatible with weak selection on synonymous sites, are substantially higher than those inferred using noise-blind approaches. Estimates of selection coefficients derived from different data sets agree much more closely applying our framework than when noise is not modeled, confirming that our approach is more robust to measurement error. As an external check, the inferred mutation biases are highly correlated with direct experimental measurements. Because our model produces codon-specific estimates of translational selection, we then estimate the mean translational selection on a gene, which we term SCU. Our results confirm that genes in yeast range from apparently free of selection to strongly selected. This SCU correlates strongly with the codon adaptation index (CAI) (Sharp and Li 1987), the most common genewise measurement of synonymous codon usage, with the advantage that, unlike CAI, the numerical values of SCU have evolutionary meaning.
Results
Estimating Selection Coefficients and Mutation Bias from Genomic Data and Gene Expression Measurements
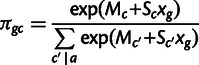
The frequency distribution of a codon in the genome results from mutation, selection, and genetic drift, which we model using population genetics theory (Bulmer 1991). We model selection on synonymous codons due to speed and accuracy as proportional to gene expression. Consider codon c, encoding amino acid a, in a gene g which has gene expression xg measured in mRNA transcripts per cell. The population genetic parameters are Sc, the selection coefficient of translational speed, and accuracy per mRNA per cell, scaled by effective population size, and Mc is a mutation bias coefficient: The quantity  is the ratio of mutation rates between codons c and
  . Then the probability that codon c is found at a site coding for amino acid a is as follows:
 |
(1) |
where the sum in the denominator is over all codons  , which code for amino acid a. This is the same model as in Shah and Gilchrist (2011); the derivation is summarized in supplementary text, Supplementary Material online. Given an organism with a sequenced genome, one may then use the codon counts across the genome, and measurements of gene expression, to estimate the mutation bias and selection coefficients.
Gene Expression Measurements Are Noisy
Once it is clear that gene expression must play a role in the inference of selection, the question becomes, which gene expression measurement should be used? Direct experimental measurements of gene expression by RNA sequencing in haploid budding yeast growing exponentially in rich medium have been made by multiple groups, but they vary widely. Figure 2B compares all replicate mRNA abundance measurements from three such published data sets (Ingolia et al. 2009; Lipson et al. 2009; Yassour et al. 2009) (cf. supplementary table S1, Supplementary Material online). Generally, two replicates from the same study have a correlation above 0.9, but using two different studies, the correlation varies between 0.6 and 0.9. The exception is that measurements from the same biological sample, measured with two different platforms, have a correlation below 0.9. It appears that the major source of variation is neither the much-studied phenomena of cell-to-cell variability nor technical variability in instrument runs. Rather, most variability occurs between platforms, and between laboratories, arising presumably from differences in the protocol used or in its implementation, sometimes termed “batch effects” (Leek et al. 2010).
Fig. 2.

Noise in gene expression in budding yeast. (A) Sources of variability in gene expression measurements. (B) Expression measurements compared from three recent studies of haploid budding yeast growing exponentially in rich medium (Ingolia et al. 2009; Lipson et al. 2009; Yassour et al. 2009). Main plot, pairwise correlation coefficients of log-transformed expression measurements from these studies. The gray label ma indicates the only replicate to use microarray rather than RNA-Seq measurements. Right, summary plot of all pairwise correlation coefficients, grouped according to whether the comparison is within or between laboratories; blue line represents median, and dots are dispersed horizontally for clarity. Replicates from the same study tend to agree more than replicates from two different studies. Below, selected pairs of expression measurements are compared on a log–log scale. In these expression plots, each point represents a single gene’s measured mRNA abundance per cell.
These observations suggest that quantifying noise by examining replicate measurements performed by a single group, while placing bounds on noise produced by a clonal culture, sharply underestimates the actual experimental noise. Moreover, the error arising from use of average gene expression under laboratory conditions as a proxy for the true amounts of translation assumed to actually shape codon usage during the evolution of budding yeast—which we term “proxy error”—remains unestimated and is surely nontrivial.
The magnitude of noise in measured expression of a particular gene scales with that gene’s expression (Bar-Even et al. 2006): This is confirmed in figure 2B where the plots of expression data sets on a log–log scale show that, equivalently, two measurements differ by a proportion that is roughly independent of expression level. Lognormally distributed noise, or equivalently normally distributed noise on a log-transformed scale, is the simplest way to model expression noise consistent with these observations.
Noise in Gene Expression Degrades the Inference of Selection and Mutation
Mutation and selection coefficients inferred from different measurements of gene expression differ systematically, by as much as 2-fold between data sets. As shown in figure 3A, selection coefficients inferred from one data set are roughly proportional to selection coefficients inferred from another, with a minimum R2 of 0.91 across all pairs of data sets from figure 2B but with a slope far from unity. To demonstrate that adding noise suffices to produce such slope differences, figure 3B shows the effect of artificially adding lognormal noise to a single gene expression data set from Yassour et al. (2009); estimating selection coefficients from these again produces values which are proportional, with reduced slope, to those estimated from the original data set. The close resemblance of figure 3A and B demonstrates that, with respect to this inference, the differences between data sets are well described by simple differences in noise level.
Fig. 3.
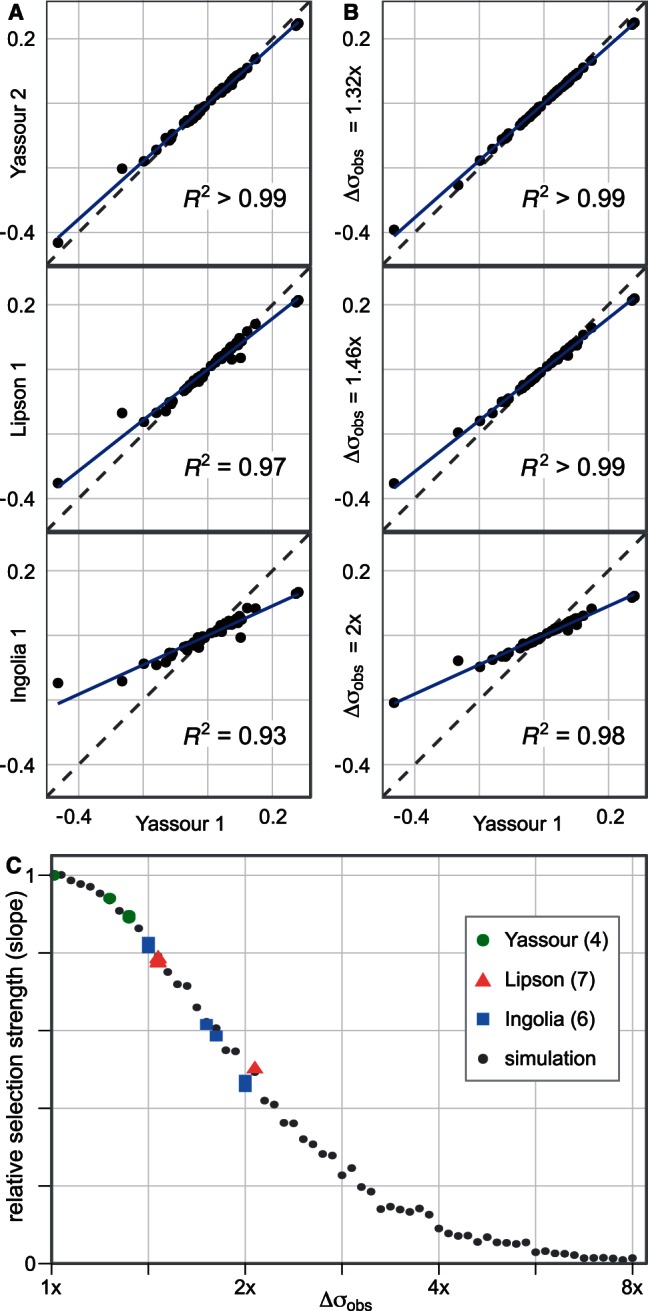
Noise in gene expression affects selection estimates in budding yeast. (A) Codon selection estimates compared from a subset of the yeast expression data sets used in figure 2. Each dot represents a codon, its x co-ordinate the selection coefficient estimated from expression data in Yassour 1, and its y co-ordinate the selection coefficient estimated from an alternative data set. The solid line (blue, online) is the least-squares fit of the alternative selection coefficients to those from Yassour 1, with the R2 values reported. The selection coefficients vary systematically between data sets, with those inferred from one data set resembling a scaled copy of those from another. (B) Codon selection estimates inferred from adding noise to a yeast expression data set. We artificially add lognormal noise to expression estimates from Yassour 1 and estimate the codon selection coefficients. The noise strength is given by its standard deviation on the log scale:  means that the root mean square difference between the logarithm of noise-free expression and the logarithm of noise-added expression is 1.32-fold. (C) Relative selection strength between data sets, summarized. Each small dot represents a simulated noisy expression data set, generated as in panel B, its x co-ordinate the noise strength, and its y co-ordinate the selection strength relative to Yassour 1, that is, the slope of the least squares fit (solid line in panel B). Estimated selection coefficients decline systematically as the noise strength increases. Each large shape represents a replicate published data set from one of Ingolia et al. (2009), Lipson et al. (2009), Yassour et al. (2009), its y co-ordinate the selection strength relative to Yassour 1 (slope of solid line in panel A), and its x co-ordinate the noise strength of the simulated data set with closest relative strength. There are four replicates from Yassour et al., seven replicates from Lipson et al., and six from Ingolia et al., although some of these are overplotted and visually indistinguishable.
As figure 3C shows, far from changing selection estimates randomly, noise pushes these selection estimates closer to zero. This is an example of attenuation error or regression dilution bias (Carroll et al. 2006). Intuitively, if the noise in measured expression were so large as to overwhelm the signal, then codon usage would have no dependence on measured expression, and the selection coefficient—the scaling of codon usage with expression—would be close to zero.
Our estimates of relative mutation rates will be biased (supplementary fig. S1, Supplementary Material online) to compensate for the misestimation of selection. The extent of bias in selection and mutation estimates depends on the expression noise, so it is necessary to estimate this noise to infer the parameters of biological interest.
Every data set has noise and suffers from proxy error. Moreover, expression measurements appear to be systematically noisier in some published studies than in others—figure 3A suggests that the Yassour et al. (2009) data sets produce the least-attenuated selection estimates. Least-noisy is not non–noisy, so fitting selection coefficients to any single expression data set in a noise-blind manner is certain to underestimate the magnitude of selection. Noise-induced attenuation of inferred selection is not uniform across codons, so that although it is easy to predict the approximate degree of underestimation of selection if its true value and the noise level are known, the inverse problem of interest—inferring the true selection coefficient from given unknown noise levels—is hard. These statements hold for any estimate of a biological quantity dependent on gene expression: Failing to account for expression noise leads to an estimate that is biased and biased by an unknown amount.
Modeling Expression Noise Gives More Accurate Inference of Selection and Mutation
We present a method for inferring selection coefficients and mutation bias more accurately by directly modeling noise in gene expression and treating the unobserved underlying gene expression as a latent variable. There are three ingredients: first, the codon distribution conditional on latent gene expression and mutation and selection parameters described above; second, the observed gene expression conditional on the latent gene expression; and third, the distribution of latent gene expression. We model the expression observation with lognormal error as discussed earlier, introducing a parameter for the magnitude of observation noise:  is the standard deviation of measurement noise on a log scale. We model the distribution of latent gene expression as log-asymmetric Laplace, a long-tailed distribution that describes gene expression measurements better than the more standard lognormal distribution (Purdom and Holmes [2005] and supplementary fig. S2, Supplementary Material online). This third ingredient is necessary to ensure that the distribution of latent expression is constrained to plausible values. The model is described in Materials and Methods and supplementary text, Supplementary Material online; statistical considerations involved will be addressed in more detail in a future publication (Wallace et al., in preparation).
Briefly, our modeling assumptions imply a likelihood function. We fit the model to the data using an iterative Markov chain Monte Carlo (MCMC) sampling strategy, which provides not only point estimates of selection coefficients and mutation bias but also the full (posterior) distribution of the parameters given the data (Gelman et al. 2003). Because we do not have external knowledge of the parameters controlling latent gene expression nor measurement noise, we infer these parameters simultaneously with the selection and mutation coefficients.
A concern arises as to how to normalize the estimates in terms of the absolute mRNA abundance per cell. Gene expression in RNA-Seq is estimated in reads per kilobase, and this may be converted to units of mRNA count per cell by fixing the sum at an estimate of total mRNA abundance per cell derived independently. However, for a right-skewed error model such as the lognormal, fixing the sum of observed gene expression alone produces biased estimates, because the latent expression estimates have on average a lower sum. Accordingly, following the completion of the MCMC sampler, we normalize the estimates of latent gene expression by their sum at each iteration (see Materials and Methods).
Results from fitting to codon counts and mRNA abundance measurements from budding yeast, shown in figure 4, are as anticipated: For every abundance data set, estimates of selection coefficients are larger when noise is modeled than when using the noise-blind approach (fig. 4A). Because abundance data from Yassour et al. (2009) were suggested to be the least noisy in figure 3, we used the geometric mean of Yassour replicates as our primary data set (see Materials and Methods) and for comparison took a single replicate from each of Ingolia et al. (2009) and Lipson et al. (2009). For the Yassour data set, estimates of selection coefficients range from 0.7-fold to 4.7-fold higher than in the noise-blind approach, typically 1.7-fold higher. The rank order of selection coefficients changes slightly once we model expression noise (Yassour, Spearman rank correlation = 0.98). Summary statistics comparing noise-modeled with noise-blind estimates for each data set is shown in supplementary table S2, Supplementary Material online.
Fig. 4.

Explicit modeling of noise reveals stronger synonymous-site selection in budding yeast. (A) Selection coefficients and (B) mutation coefficients: We compare estimates where we modeled noise in gene expression (black) or ignored noise in gene expression (grey; red, online), based on expression data taken from Yassour et al. (2009), Lipson et al. (2009), and Ingolia et al. (2009) (see Materials and Methods). These are displayed ranked in order of the noise-modeled selection coefficient in Yassour and labeled by codon and amino acid. The Yassour data, collected by amino acid, is shown in supplementary figure S3, Supplementary Material online. (C) Absolute difference in selection coefficient estimates for each data set with median values indicated. (D) R2 (squared correlation) of each pair of selection estimates. Selection estimates are more closely correlated between data sets when noise is modeled than when noise is ignored.
Similarly, for the Yassour data set, the rank order of mutation coefficients changes upon modeling noise (Spearman rank correlation = 0.82, see supplementary table S2, Supplementary Material online). Note that, when selection coefficients increase, mutation bias coefficients may increase or decrease, depending on whether the bias favors the selected codon.
Importantly, selection estimates from different abundance data sets agree more closely when noise is modeled (fig. 4C and supplementary fig. S4, Supplementary Material online). The results with noise modeled are very strongly correlated ( ) for each pair of data sets and are much closer in magnitude than when noise is not modeled; the difference in magnitude may be partially explained by each data set detecting different total numbers of genes. This demonstrates that modeling noise makes inferences of selection more robust, in that the results depend less on the particular gene expression data set used.
When noise is ignored, selection-driven codon usage, which scales strongly with true gene expression, will be observed to scale poorly with measured gene expression and thus will be interpreted as mutational in origin. Because of this noise-induced cross-contamination, we expect that noise-blind estimates of selection and mutation will correlate; accounting for noise should reduce this effect. Indeed, in the Yassour data set, noise-blind estimates of mutation and selection have  , whereas when noise is modeled, mutation and selection coefficients are uncorrelated
  .
.
For the Yassour data set, the estimated noise value is  , meaning that the average difference between the measured and true abundance value is 3.12-fold. Consistent with the observation that most variability occurs between platforms and between laboratories, the noise estimated between replicate measurements in the Yassour data set is considerably smaller,
  .
.
We have argued that fitness costs of speed or accuracy at a codon in a particular mRNA scale with its protein synthesis rate, that is, the total rate of ribosomal reads per codon across all transcripts. We used mRNA abundance as a proxy for this protein synthesis rate, building upon considerable evidence that mRNA abundance strongly correlates with protein synthesis rate despite the layers of post-transcriptional regulation (Arava et al. 2003; Mathews et al. 2007). Ribosome profiling, a recently developed technique that directly measures ribosome occupancy of messenger RNA, gives per-gene estimates of synthesis rate without employing any additional data, under the assumption that the average elongation rate does not vary systematically across codons or genes (Ingolia et al. 2009), a convenient notion which remains controversial.
We repeated the above analysis with the ribosome profiling data set of Ingolia et al. (2009) and find substantial agreement (supplementary fig. S6, Supplementary Material online). The selection coefficients inferred from the Yassour data set and the ribosome profiling data set, measured relative to transcripts per cell or estimated proteins produced per second per cell, respectively, are very strongly correlated ( ). For the ribosome profiling data set, selection coefficients were underestimated by only 1.3-fold (median) in the noise-blind fit compared with the full model, yet expression observations had an estimated noise value of
  , suggesting that the observation noise relative to underlying selective pressure was greater for this data set. We use estimates from the Yassour data set in subsequent analyses except where noted and provide the selection and mutation estimates from all data sets as a supplementary file, Supplementary Material online.
To test the model’s ability to infer true values in the presence of noise, we generated data using known selection/mutation coefficients, added noise, and attempted to infer the coefficients from the noisy data. We used amino acid counts from the yeast genome, and estimated coefficients from the Yassour data set, to simulate data according to the model. As figure 5 shows, the re-estimated coefficients remain close to the coefficients used to generate the data across a range of measurement noise which contains that inferred for the Yassour data set. The simulation results shown in figure 5 verify that this approach produces approximately unbiased estimates given the model assumptions. In contrast, the noise-blind model systematically underestimates the magnitude of selection parameters and misestimates mutation parameters in a compensatory manner. At the noise level inferred for the Yassour data set, the noise-blind approach underestimates selection strength by roughly a factor of four.
Fig. 5.

Modeling recovers true coefficients from simulated noisy data. Mutation and selection parameters inferred from simulated data using amino acid counts from 1,000 yeast genes, with parameters taken from model fit to the yeast genome; 12 data sets were simulated for each value of the noise parameter  . (A) Parameters inferred for codons GAT (Asp) and GAA (Glu). Black boxplots indicate estimates from full model, and gray boxplots (red, online), those that do not model noise in expression; the vertical dashed line is the parameter value used to generate the data. (B) Root mean-squared error of selection and mutation parameters across all degenerate amino acids. To provide a reference,
  indicates the inferred noise parameter fitted to the Yassour data set.
The counts of codons per gene provide one measure of model fit (Shah and Gilchrist 2011). To what extent does the noise-corrected model fit codon counts better? We estimated the Bayes factor (Gelman et al. 2003), the difference between the posterior mean likelihood of codon counts of the full model and the noise-blind model. For the Yassour data set, the log of the Bayes factor was  , which is statistically significant by any measure. The large size of the Bayes factor is due to the size of the data set and the improvement in fit: This means an average 0.8% increase in likelihood for each of the 2.7 million codon sites or an average a 61-fold increase in likelihood across the codon counts for each of the 5,709 genes.
In summary, the noise-blind approach substantially misestimates the selective and mutational forces acting on codon usage, and this misestimation is corrected, under some circumstances, by explicitly modeling noise.
Estimated Mutation Parameters Are Consistent with Experimental Measurements
The mutation bias coefficients in the model estimate the log difference in relative mutation rates between a codon and its synonym. These estimates represent strong predictions, because only steady-state sequence composition and mRNA levels are provided to the model. Moreover, they are testable predictions, as several groups have measured single-nucleotide mutation rates in budding yeast from which relative rates can be computed.
We used single-nucleotide mutation rates collated from Kunz et al. (1998), Lang and Murray (2008), and Ohnishi et al. (2004), as reported in Lynch et al. (2008), to estimate the relative difference in mutation rates between synonyms differing by a single nucleotide, generally at the third position. Experimentally measured rates are reported per base pair, and we do not distinguish lead and lagging strands, so for  the log ratio of counts
  , and similarly for
  . These mutation parameters in the model correlate with experimental measurements of mutation bias, as shown in figure 6A (
 ). However, the model estimates smaller ratios than experimental measurements, with the linear regression coefficient of 0.38. This could be due to other unmodeled factors affecting mutation rates, such as sequence context.
Fig. 6.

Mutation parameters are consistent with experimental measurements in budding yeast. (A) Inferred mutation bias coefficients plotted against experimental estimates derived from single-nucleotide mutation rates in yeast. For example, the difference in model parameters  is compared with the experimentally measured log ratio of counts
  collated in (Lynch et al. 2008) (see Materials and Methods). The experimentally measured rates are reported per base pair, and we do not distinguish lead and lagging strands, so for
  the value
  , and similarly for
  . Blue line, linear regression fit of model parameters to direct measurements, has slope of 0.38 and
  . (B) Selection estimates from model plotted against log ratio of directly measured single-nucleotide mutation rates. Linear regression fit has slope of 0.05 and
  .
.
In contrast, the inferred selection coefficients are poorly correlated with experimental measurements of mutation bias, with a regression coefficient of 0.05 ( ) (fig. 6B), suggesting that the inference of selection is independent of mutational forces acting on the genome.
The question arises, are the selection and mutation estimates obtained so far compatible with a classical model where mutation is driven only by single-nucleotide changes? We fitted an alternative model where selection coefficients are fitted as previously, but mutation bias depends only on the nucleotide substitution, and so mutation coefficients are pooled across amino acids. This is analogous to the model of Yang and Nielsen (2008) but with gene expression as a coefficient of selection. Selection estimates when mutation is pooled, again directly modeling noise in gene expression, are in substantial agreement with those where mutation is modeled separately ( , supplementary fig. S7B, Supplementary Material online). The spread of values in figure 6A previously suggested that different amino acids show different mutation bias. Likewise, codon mutation coefficients derived from pooled mutation estimates are in slightly weaker agreement with those from unpooled estimates (
 , supplementary fig. S7D, Supplementary Material online). Selection estimates necessarily change to compensate for these disagreements in mutation estimates. Interestingly, even when noise is ignored, selection estimates are larger when mutation is pooled than when mutation is fitted separately (supplementary fig. S7A, Supplementary Material online), especially for arginine codons containing a CpG dinucleotide. This additionally suggests that pooling mutation partially corrects for attenuation due to noise in gene expression.
Genewise Estimates of Translational Selection
We often wish to summarize selection at the gene level. To provide a measure of average codon selection for a polypeptide-encoding sequence, we introduce the measure SCU, the average per-codon selective advantage of a gene’s observed encoding over that of a random gene encoding the same polypeptide. Our model provides a precise and useful meaning of “random” as a gene whose codons are chosen according to the inferred mutational biases alone, which we refer to as an unselected sequence. The codon selection coefficients inferred above are selective differences relative to an arbitrary point and gain evolutionary meaning only in relation to each other:  is the population-scaled per-transcript fitness advantage of replacing codon
  with c. We first define
  as the mean per-transcript selective advantage of codon c over its unselected synonymous alternatives (see Materials and Methods). Then the mean
  for a gene, mSCU, is the average of
  over all codons in that gene, and SCU is mSCU multiplied by the gene’s transcript level. SCU is the mean fitness advantage, scaled by effective population size, that the organism gains from the gene’s codon composition, relative to an unselected synonymous alternative.
Figure 7A shows the distribution of SCU values for all yeast genes compared with values for unselected synonymous alternatives generated from model-estimated mutation biases alone. These distributions partially overlap, suggesting that codon usage in some genes is driven primarily by selection and in others primarily by mutation bias.
Fig. 7.

Genewise estimates of translational selection in budding yeast. SCU measures the per-codon average selective advantage of a gene relative to an unselected gene (see text), and mean selection per codon mSCU measures the per-codon per-transcript selective advantage. (A) Distribution of SCU values for all budding yeast genes compared with unselected genes, generated with identical amino acid counts and model-estimated mutation biases absent selection. These distributions partially overlap, suggesting that codon usage in some genes is driven primarily by selection and in others primarily by mutation bias. Because SCU varies over orders of magnitude, yet has negative values, we have plotted it on a scale transformed by  . (B) SCU values for all budding yeast genes compared with CAI, a popular metric of codon usage bias. Each point represents one gene. (C) Distribution of mSCU values across the yeast genome compared with those generated with identical amino acid counts and model-estimated mutation biases but without selection. (D) mSCU compared with CAI. The relationship between mSCU and
  is close to linear (
 ).
).
Evolution acts efficiently on selective differences above  and therefore efficiently selects an average codon in a gene if that gene’s
  . Efficient selection means that lower-fitness alternatives are purged by natural selection, and in this context, it means that the most advantageous synonym will be used almost exclusively in the set of genes for which
  ; this is true for 249 of 5,709 genes. Below SCU = 1, drift begins to dominate, allowing accumulation of lower-fitness codons.
The most popular of many codon usage metrics, the CAI (Sharp and Li 1987), provides a useful comparison for visualizing these effects. CAI assigns a score to each codon proportional to its frequency in a group of high-expression genes, with the highest score for each synonymous family equal to 1; the CAI for a gene is the geometric mean of these scores across its codons. Exclusive use of the highest scoring codons yields CAI = 1. Figure 7B compares SCU values to CAI scores for all genes in budding yeast, showing that they are strongly correlated. Genes with  have CAI values approaching 1.0.
The per-transcript average selective advantage mSCU (distributions in fig. 7C) provides a more direct comparison with CAI. Both log(CAI) and mSCU represent mean codon scores, and the relationship between mSCU and  is close to linear (
 ). Additionally, we compare CAI to latent gene expression in supplementary figure S8B, Supplementary Material online.
The key advantage of SCU and mSCU is their interpretability: We have estimated both mutation and selection across the genome in a manner that allows us to tease apart the influences of these forces. Our statistics directly estimate the strength of translational selection on the gene’s coding sequence: One might view mSCU as CAI calibrated to reflect the genomic signature of selection and SCU as the total selective strength accounting for transcript level. Because virtually all metrics of codon bias correlate well, it is sensible to prefer one for which the numerical values have biological meaning. We report SCU and mSCU values for all verified and uncharacterized open reading frames (ORFs) in budding yeast in a supplementary file, Supplementary Material online.
Discussion
We estimated the strength of translational SCU in budding yeast. Our per-codon selection coefficients, although still compatible with weak selection on synonymous sites, are substantially higher than those previously inferred, because previous estimates did not account for the effects of noise in measured gene expression. We confirm that a substantial portion of the yeast genome is under translational selection. Reliable estimation of such selection is essential to understanding how natural selection shapes genomes.
The key challenge in codon usage analyses has been to separate the effects of mutation, selection, and drift (Bulmer 1991). Following Shah and Gilchrist (2011), we directly model mutation and translational selection, separating their effects by exploiting the scaling of translational selection with gene expression. Going further, we account for noise in gene expression, which we show confounds the effects of mutation with selection otherwise.
Previous estimates of selection on synonymous codons include that of Yang and Nielsen (2008), which models the background codon frequencies in coding genes as given by the genome’s nucleotide composition. However, the nucleotide composition is itself affected by SCU: Simply counting nucleotide frequencies confounds the signatures of mutation and selection.
In contrast, Sharp et al. (2005) estimated SCU in bacteria by comparing a basket of highly expressed, highly biased genes, to others, using this internal control to limit the influence of mutation bias. They study a handful of amino acids, chosen for consistent mutation bias across bacteria. Our approach, although similar in spirit, applies to all codons, uses expression measurements for all genes, and takes a more rigorous position with respect to the kinds of selection which can be inferred, namely those which scale proportional to gene expression.
The explicit use of gene expression, we argue, is necessary to extract selective parameters with a mechanistic basis. The average speed of translation of a codon in a cell need not relate at all to the speed with which one ribosome translates one codon of that type: The average speed of translation is the number of translation events of that codon per unit time, and the number of translation events is primarily determined by the number of transcripts containing that codon. In contrast, the average codon translational speed per transcript has mechanistic meaning. By inferring the selection coefficient per transcript, our method converges on evolutionary parameters, which relate to the physical implementation of those parameters. This strategy is essential when evolutionary signals are used to learn about the operation of cells, one major goal of molecular evolutionary studies. In turn, this strategy’s dependence on measurements, such as gene expression, makes accounting for measurement noise an essential part of making accurate inferences.
Another side effect of depending on gene-expression measurements is that the inferred selection coefficients depend on knowing transcript levels per cell. For example, a 4-fold higher estimate of transcript levels would mean 4-fold lower selection estimates, while preserving mutation estimates; estimates of genewise selection via SCU, in which selection estimates are multiplied by transcript levels, also remain the same. In budding yeast, total transcript levels are not without controversy: Some studies report the total number as approximately 15,000 mRNAs per cell (Hereford and Rosbash 1977), a number validated by a recent meta-analysis (von der Haar 2008). Recent data, applying single-molecule fluorescent detection techniques to a handful of low-abundance yeast genes, each showing a 3- to 6-fold higher expression than determined previously (Zenklusen et al. 2008). Although these differences are argued to demonstrate a higher total of approximately 60,000 mRNAs per cell, in view of the small and biased sample, the higher number cannot be regarded as definitive. This number surely also depends on growth state and environmental factors, making point estimates of limited utility. Whatever the correct absolute numbers, the underestimation of selection coefficients due to measurement noise remains.
Experimental evidence is sorely needed to test the predictions of our and others’ models. High-quality studies are beginning to emerge. For example, CGA, the codon (encoding arginine) here found to be most strongly selected against in yeast, was recently found to have the strongest negative effect on gene expression in yeast (Letzring et al. 2010). Insertion of repeated CGA codons to a gene reduced that gene’s expression, whereas insertion of other repeated codons, or of a single CGA codon, had a smaller effect. Although this is suggestive of a difference in translational speed, we cannot conclude that selection against CGA codons acts exclusively on speed or accuracy, as these are mutually correlated with cognate tRNA abundance.
High-resolution ribosome profiling data (Ingolia et al. 2009) in principle measure codon-specific elongation speeds. One study combined ribosome profiling data with a host of additional data—tRNA copy numbers, tRNA to ribosome ratios, assumptions about cognate and near-cognate binding, and models of tRNA diffusion—to estimate per-codon elongation rates, which correlated with codon usage patterns (Siwiak and Zielenkiewicz 2010); many biophysical assumptions employed in this study await experimental verification. Other studies, in contrast, argue that ribosome profiling data show negligible speed variation between codons (Qian et al. 2012). Our selection estimates may be useful in providing a missing ingredient, namely, the minimum speed differences between codons that induce a selectable fitness difference.
There are many other causes of selection on coding sequences not modeled here. For example, translational pausing (Kimchi-Sarfaty et al. 2007), avoidance of particular motifs (Li et al. 2012), and mRNA secondary structure (Kudla et al. 2009; Gu et al. 2010). This is consistent with observed codon counts being more variable than is predicted here by mutation, translational selection, and drift alone. Despite this, averaging over the whole genome reveals the core signature of translational selection that codon usage varies with gene expression: The quantity reported here is the average selection coefficient on speed or accuracy per mRNA, across the genome. Future models might incorporate these other sources of selection either directly or indirectly via overdispersion (Gelman et al. 2003).
Although translational selection on synonymous codon usage due to either speed or accuracy is proportional to gene expression, substantial evidence demonstrates that codon location within genes affects selection. For example, codon usage is on average different in the 50 sites closest to the start codon (Tuller et al. 2010). Similarly, codon frequencies vary between sites within a gene according to protein structure (Zhou et al. 2009; Lee et al. 2010) and evolutionary conservation of amino acids (Akashi 1994; Stoletzki and Eyre-Walker 2007; Drummond and Wilke 2008), providing evidence for selection specifically on accuracy. Although our current model cannot distinguish between the effects of speed and accuracy, extending the model to include site-specific effects may allow such a distinction.
As in Shah and Gilchrist (2011), mutations here are modeled with individual rates per synonymous family, a choice which simplifies the model yet may complicate the apparent biology. If mutational changes depended only on the nucleotide being mutated, the underlying mutational model would be considerably simpler, a model adopted in other studies (Yang and Nielsen 2008), which we additionally implemented. Here, mutation estimates for the two models, although highly correlated, are statistically significantly different, suggesting that codon mutation rates are not determined by nucleotide alone. Similarly, substantial prior evidence exists that mutation biases operate on more than just single nucleotides (Karlin and Mrázek 1996), with CpG mutation rates providing a canonical example (Bulmer 1986). Further, mutation rates—and presumably mutation biases—vary within genomes (Baer et al. 2007), for example, varying along a chromosome in budding yeast (Lang and Murray 2011). Our model’s ability to reproduce experimentally measured mutational biases to a substantial extent, given only genome sequence and expression values as input, argues for its utility. Still, future work should address more mechanistically grounded mutational models.
The present work exemplifies a situation which is quite general. In standard regression models, unbiased estimates can be obtained given noise in the dependent variable but not the independent variable. Here, the independent variable, gene expression, is noisy; any regression-based estimates will be biased if noise is ignored. Indeed, we have shown that the bias in this particular case, measuring selection coefficients, is often several times the values of the parameters themselves. We expect that the strategies introduced here will be useful in contending with the unavoidable uncertainty that accompanies experimental measurements.
Materials and Methods
Data
We downloaded sequence information for verified and uncharacterized ORFs in Saccharomyces cerevisiae from the Saccharomyces Genome Database (http://www.yeastgenome.org/, last accessed April 2, 2013) (file: orf_coding.-fasta) in February 2011. We downloaded expression data from Yassour et al. (2009), measured using RNA sequencing from S. cerevisiae strain BY4141, a derivative of strain S288C, grown to exponential phase in YPD medium. We restricted our analysis to ORFs whose expression was measured under these conditions in their study, a total of 5,709 genes. There were four replicate measurements (YPD0.1, YPD0.2, YPD15.1, and YPD15.2). Because errors were approximately lognormally distributed, we took as an expression summary the geometric mean of the reads per kilobase per million mapped reads (rpkm) from these measurements, equivalent to taking the log-scale mean, adding 1 to avoid taking log of zero. As in Yassour et al., we normalized this summary figure to a conservative total of 15,000 mRNAs per cell (Hereford and Rosbash 1977; von der Haar 2008), as addressed in the Discussion.
For comparison, we also downloaded mRNA abundance measurements from Lipson et al. (2009) and Ingolia et al. (2009); see supplementary table S1, Supplementary Material online, for details of labeling. We also normalized these read counts to a total of 15,000 mRNAs per cell. We downloaded ribosomal occupancy estimates from Ingolia et al. (2009), normalizing to a total of 13,000 translation events per second per cell (von der Haar 2008).
Model
The model has three components: a component relating codon counts to “latent” (i.e., true but unobserved) gene expression, an error component relating observed gene expression to latent gene expression, and a distribution of latent gene expression (fig. 8). The multinomial distribution of codon counts  for amino acid a in gene g is specified by a vector of probabilities
  (whose elements
  specify the probability that codon c is used conditional on amino acid a in gene g), and the size parameter nga is given by the number of times amino acid a is observed in gene g. The vector of probabilities
  is then specified by a population-genetic/multivariate logistic regression model with two coefficients:
  , which captures the effect of mutation, and
  , which captures the effect of selection. The latter is modulated by the amount of “observed” gene expression xg. The formula for the multinomial probability of a specific codon
  is as given in equation (1), which drops the amino acid subscript for clarity. The vectors
  , and
, and  have one component for each codon coding for amino acid a. The error model for the observed gene expression
  is lognormal with variance
  . The distribution of latent gene expression is log-asymmetric Laplace (ASL) with parameters
  (Kotz et al. [2001] and supplementary text, Supplementary Material online, for details on the parametrization).
Fig. 8.

Graphical representation of model. The representation as a probabilistic graphical model (Airoldi 2007) uses shaded circles to indicate observed quantities, and plain circles to indicate unobserved quantities; plates (gray rectangles) indicate that the likelihood factors both by gene and by amino acid. The three black squares represent the three components of the model discussed in the text and Materials and Methods.
In equations, this is as follows:
| (2a) |
| (2b) |
| (2c) |
| (2d) |
where mlogit denotes the multinomial logistic function. Further details, including a discussion of the choices of distributions used, are in the supplementary text, Supplementary Material online.
We used (improper) uniform priors on the hyperparameters  . We fit this using a Metropolis–Hastings within Gibbs sampler for MCMC inference, running four parallel chains for 10,000 iterations each following a burn-in of 2,000 iterations, thinning the results by keeping only every tenth iteration. The Gelman–Brooks–Rubin convergence diagnostic suggested that the chains had converged to a single distribution (Brooks and Gelman 1998), giving potential scale reduction values below 1.05 for all parameters. Further details are in the supplementary text, Supplementary Material online.
For the validation runs in figure 5, we ran each sample for 6,000 iterations following a burn-in of 2,000 iterations.
To calculate the Bayes factor, we drew 1,000 sets of parameter values uniformly at random from the post burn-in posterior draws from our MCMC sampler and took the mean of the likelihood for the codon portion of each of these; similarly for the noise-blind model, we drew 1,000 sets of parameter values at random from the normal approximation about its maximum likelihood and took the mean of these, the difference in log of these means is the log Bayes factor (Gelman et al. 2003).
All calculations were done in R (Ihaka and Gentleman 1996), using the VGAM package (Yee 2010) to fit the multinomial logistic regression model and the ggplot2 package (Wickham 2010) to produce the plots. An R package implementing the fits is included in supplementary text, Supplementary Material online.
Reporting Coefficients
For a right-skewed error model such as the lognormal, fixing the sum of observed gene expression alone produces biased estimates, because the (latent) true expression has on average a lower sum than noisy observed expression. Accordingly, following the completion of the MCMC sampler, we normalize the estimates of latent gene expression by their sum at each iteration. In other words, in iteration k, we have posterior draws  for the latent gene expression, and we report
 |
(3) |
where X is the total gene expression. Similarly, we multiply the parameter estimates for S at iteration k by  . This strategy is permissible because estimates of absolute total gene expression are derived from experiments independent of the inference being performed; its success in producing unbiased estimates of the parameters is shown in figure 5.
We reported the median of the normalized MCMC draws as the inferred parameter. Confidence intervals given in supplementary files, Supplementary Material online, are the 95% intervals of the normalized MCMC draws, that is, the 2.5th and 97.5th percentiles.
Multinomial logistic regression predicts probabilities that do not change if a constant is added to all predictors: We chose the constant so that the sum of reported selection (mutation) coefficients across synonyms was zero, so that the reported coefficient represents the difference from the mean across synonyms. This differs from the reporting method in Shah and Gilchrist (2011), who chose a constant, so that, for each amino acid, the coefficients for a reference codon are zero, thus reporting the difference in selection (mutation) coefficients between a codon and the reference codon. In calculating SCU below, we report an alternative measure, where the expected selection if codon composition is given by mutation bias is zero. In all cases, if there were no selection (mutation bias) between synonyms, then all selection (mutation) coefficients for that amino acid would be zero.
To validate the fit of the model to simulated data, we used amino acid counts for 1,000 yeast genes and drew mutation and selection coefficients, as well as expression parameters, from the reported fit to the yeast genome. For each of a range of observation noise parameters, we generated 12 simulated data sets according to the model, normalizing the observed gene expression to the original total, and then estimated the coefficients from each of these, including the sum normalization described here. The results are reported in figure 5.
Estimating Mutation Bias Directly
Direct measurements of single-nucleotide mutation rates in yeast were taken from Kunz et al. (1998), Lang and Murray (2008), and Ohnishi et al. (2004), reported in Lynch et al. (2008), as counts for every possible nucleotide substitution. The experimentally measured counts are reported per base pair and we do not distinguish lead and lagging strands, so for  the value
  , and similarly for
  . These were compared with the difference in mutation coefficients in our model between synonyms differing by the same nucleotide substitution.
Precisely, in the derivation of the model, we assume detailed balance, that is, that the mutation rate between synonymous codons c and d is given by
| (4) |
where  has units of mutations per unit time, and M’s are the mutation constants fit by the model (see supplementary material, Supplementary Material online, and Sella and Hirsh [2005]). Thus
 |
(5) |
For example, the difference in model parameters for two glycine codons is compared with experimentally measured mutation counts as follows:
 |
(6) |
 |
(7) |
 |
(8) |
Similarly, in fitting the mutation-pooled model in supplementary figure S7, Supplementary Material online, nucleotide-specific mutation rates were assigned to codons by the same equations. However, the mutation rate  was treated as independent of
  , allowing for mutation biases to differ in the transcribed and untranscribed strand.
Calculating Genewise Selection
To provide a measure of average codon selection for a sequence encoding a polypeptide, we estimate the average per-codon selective advantage conferred between the observed encoding compared with the selective advantage of a randomly encoded version of the same polypeptide. In the absence of selection, the frequency of codon c among synonymous sites would be given by
 |
(9) |
Recall that the Sc selection coefficients represent selective differences relative to an arbitrary point chosen so that the mean Sc in a synonymous family is zero and are only evolutionarily meaningful as differences from each other. The average selective advantage of a codon over its synonyms, if those synonyms occur according to mutational biases alone, is
| (10) |
If a gene’s codon composition is produced by mutation bias alone, the expected fitness advantage conferred by its encoding relative to an unselected sequence is zero, and accordingly, the expected value of  is zero.
A genewise statistic is obtained by taking the average across the codons in a gene and multiplying by gene expression in transcripts per cell
 |
(11) |
where i indexes all sites in the gene coding for degenerate amino acids (equivalently, one can set  for all Met and Trp codons), and Lg is the length of gene g counting only the degenerate amino acids. Because Sc is the selection coefficient per transcript per cell scaled by effective population size, so SCU has units of selection coefficient per site, scaled by effective population size. Note that SCU is independent of the figure used to normalize total gene expression, because it is a product of selection coefficients and estimated expression.
For direct comparison with CAI, we define mSCU as the average translational selection per transcript across all degenerate codons in a gene,
 |
(12) |
This is an arithmetic mean, whose calculation is directly analogous to that of log(CAI), because CAI is a geometric mean across codons in a gene (Sharp and Li 1987).
Supplementary Material
Supplementary text, file, figures S1–S8, and tables S1 and S2 are available at Molecular Biology and Evolution online (http://www.mbe.oxfordjournals.org/).
Acknowledgments
The authors thank Alexander Blocker and Eric Solís in the Airoldi group, and members of the Harvard FAS center for Systems Biology, for many helpful discussions. They thank Sergey Kryazhimskiy, Arvind Subramaniam, and Claus Wilke for comments on the manuscript and Nicholas Ingolia and Jonathan Weissman for allowing them to use some of their unpublished data. The computations in this article were run on the Odyssey cluster supported by the FAS Science Division Research Computing Group at Harvard University. This work was supported by the Pew Foundation, by NIH NIGMS grants R01 GM088344 and P50 GM068763, by a Bauer Fellowship to D.A.D., and by NIH NIGMS grant R01 GM096193 and NSF grant IIS-1017967 to E.M.A. E.M.A. and D.A.D. are Alfred P. Sloan Research Fellows. D.A.D. is a Pew Scholar in the Biomedical Sciences.
References
- Airoldi EM. Getting started in probabilistic graphical models. PLoS Comput Biol. 2007;3:e252. doi: 10.1371/journal.pcbi.0030252. [DOI] [PMC free article] [PubMed] [Google Scholar]
- Akashi H. Synonymous codon usage in Drosophila melanogaster: natural selection and translational accuracy. Genetics. 1994;136:927–935. doi: 10.1093/genetics/136.3.927. [DOI] [PMC free article] [PubMed] [Google Scholar]
- Andersson SG, Kurland CG. Codon preferences in free-living microorganisms. Microbiol Rev. 1990;54:198–210. doi: 10.1128/mr.54.2.198-210.1990. [DOI] [PMC free article] [PubMed] [Google Scholar]
- Arava Y, Wang Y, Storey JD, Liu CL, Brown PO, Herschlag D. Genome-wide analysis of mRNA translation profiles in Saccharomyces cerevisiae. Proc Natl Acad Sci U S A. 2003;100:3889–3894. doi: 10.1073/pnas.0635171100. [DOI] [PMC free article] [PubMed] [Google Scholar]
- Baer CF, Miyamoto MM, Denver DR. Mutation rate variation in multicellular eukaryotes: causes and consequences. Nat Rev Genet. 2007;8:619–631. doi: 10.1038/nrg2158. [DOI] [PubMed] [Google Scholar]
- Bar-Even A, Paulsson J, Maheshri N, Carmi M, O’Shea E, Pilpel Y, Barkai N. Noise in protein expression scales with natural protein abundance. Nat Genet. 2006;38:636–643. doi: 10.1038/ng1807. [DOI] [PubMed] [Google Scholar]
- Brooks SP, Gelman A. General methods for monitoring convergence of iterative simulations. J Comput Graph Stat. 1998;7:434–455. [Google Scholar]
- Bulmer M. Neighboring base effects on substitution rates in pseudogenes. Mol Biol Evol. 1986;3:322–329. doi: 10.1093/oxfordjournals.molbev.a040401. [DOI] [PubMed] [Google Scholar]
- Bulmer M. The selection-mutation-drift theory of synonymous codon usage. Genetics. 1991;129:897–907. doi: 10.1093/genetics/129.3.897. [DOI] [PMC free article] [PubMed] [Google Scholar]
- Carroll R, Ruppert D, Stefanski LA, Crianiceanu CM. Measurement error in nonlinear models: a modern perspective. Boca Raton Fla: Chapman & Hall/CRC; 2006. [Google Scholar]
- Dix DB, Thompson RC. Codon choice and gene expression: synonymous codons differ in translational accuracy. Proc Natl Acad Sci U S A. 1989;86:6888–6892. doi: 10.1073/pnas.86.18.6888. [DOI] [PMC free article] [PubMed] [Google Scholar]
- Drummond DA, Wilke CO. Mistranslation-induced protein misfolding as a dominant constraint on coding-sequence evolution. Cell. 2008;134:341–352. doi: 10.1016/j.cell.2008.05.042. [DOI] [PMC free article] [PubMed] [Google Scholar]
- Drummond DA, Wilke CO. The evolutionary consequences of erroneous protein synthesis. Nat Rev Genet. 2009;10:715–724. doi: 10.1038/nrg2662. [DOI] [PMC free article] [PubMed] [Google Scholar]
- Geiler-Samerotte KA, Dion MF, Budnik BA, Wang SM, Hartl DL, Drummond DA. Misfolded proteins impose a dosage-dependent fitness cost and trigger a cytosolic unfolded protein response in yeast. Proc Natl Acad Sci U S A. 2011;108:680–685. doi: 10.1073/pnas.1017570108. [DOI] [PMC free article] [PubMed] [Google Scholar]
- Gelman A, Carlin J, Stern H, Rubin D. Bayesian data analysis. Boca Raton Fla: Chapman & Hall/CRC; 2003. [Google Scholar]
- Gelman A, Hill J. Data analysis using regression and multilevel/hierarchical models. Cambridge (UK): Cambridge University Press; 2007. [Google Scholar]
- Gu W, Zhou T, Wilke CO. A universal trend of reduced mRNA stability near the translation-initiation site in prokaryotes and eukaryotes. PLoS Comput Biol. 2010;6:e1000664. doi: 10.1371/journal.pcbi.1000664. [DOI] [PMC free article] [PubMed] [Google Scholar]
- Hereford LM, Rosbash M. Number and distribution of polyadenylated RNA sequences in yeast. Cell. 1977;10:453–462. doi: 10.1016/0092-8674(77)90032-0. [DOI] [PubMed] [Google Scholar]
- Hershberg R, Petrov D. Selection on codon bias. Annu Rev Genet. 2008;42:287–299. doi: 10.1146/annurev.genet.42.110807.091442. [DOI] [PubMed] [Google Scholar]
- Ihaka R, Gentleman R. R: a language for data analysis and graphics. J Comput Graph Stat. 1996;5:299–314. [Google Scholar]
- Ikemura T. Correlation between the abundance of Escherichia coli transfer RNAs and the occurrence of the respective codons in its protein genes: a proposal for a synonymous codon choice that is optimal for the E. coli translational system. J Mol Biol. 1981;151:389–409. doi: 10.1016/0022-2836(81)90003-6. [DOI] [PubMed] [Google Scholar]
- Ikemura T. Correlation between the abundance of yeast transfer RNAs and the occurrence of the respective codons in protein genes. Differences in synonymous codon choice patterns of yeast and Escherichia coli with reference to the abundance of isoaccepting transfer RNAs. J Mol Biol. 1982;158:573–597. doi: 10.1016/0022-2836(82)90250-9. [DOI] [PubMed] [Google Scholar]
- Ingolia NT, Ghaemmaghami S, Newman JRS, Weissman JS. Genome-wide analysis in vivo of translation with nucleotide resolution using ribosome profiling. Science. 2009;324:218–223. doi: 10.1126/science.1168978. [DOI] [PMC free article] [PubMed] [Google Scholar]
- Kanaya S, Yamada Y, Kinouchi M, Kudo Y, Ikemura T. Codon usage and tRNA genes in eukaryotes: correlation of codon usage diversity with translation efficiency and with cg-dinucleotide usage as assessed by multivariate analysis. J Mol Evol. 2001;53:290–298. doi: 10.1007/s002390010219. [DOI] [PubMed] [Google Scholar]
- Karlin S, Mrázek J. What drives codon choices in human genes? J Mol Biol. 1996;262:459–472. doi: 10.1006/jmbi.1996.0528. [DOI] [PubMed] [Google Scholar]
- Kimchi-Sarfaty C, Oh JM, Kim IW, Sauna ZE, Calcagno AM, Ambudkar SV, Gottesman MM. A “silent” polymorphism in the MDR1 gene changes substrate specificity. Science. 2007;315:525–528. doi: 10.1126/science.1135308. [DOI] [PubMed] [Google Scholar]
- Kotz S, Kozubowski TJ, Podgórski K. The Laplace distribution and generalizations: a revisit with applications to communications, economics, engineering, and finance. Boston: Birkhäuser; 2001. [Google Scholar]
- Kramer EB, Farabaugh PJ. The frequency of translational misreading errors in E. coli is largely determined by tRNA competition. RNA. 2007;13:87–96. doi: 10.1261/rna.294907. [DOI] [PMC free article] [PubMed] [Google Scholar]
- Kramer EB, Vallabhaneni H, Mayer LM, Farabaugh PJ. A comprehensive analysis of translational missense errors in the yeast Saccharomyces cerevisiae. RNA. 2010;16:1797–1808. doi: 10.1261/rna.2201210. [DOI] [PMC free article] [PubMed] [Google Scholar]
- Kudla G, Murray AW, Tollervey D, Plotkin JB. Coding-sequence determinants of gene expression in Escherichia coli. Science. 2009;324:255–258. doi: 10.1126/science.1170160. [DOI] [PMC free article] [PubMed] [Google Scholar]
- Kunz BA, Ramachandran K, Vonarx EJ. DNA sequence analysis of spontaneous mutagenesis in Saccharomyces cerevisiae. Genetics. 1998;148:1491–1505. doi: 10.1093/genetics/148.4.1491. [DOI] [PMC free article] [PubMed] [Google Scholar]
- Lang GI, Murray AW. Estimating the per-base-pair mutation rate in the yeast Saccharomyces cerevisiae. Genetics. 2008;178:67–82. doi: 10.1534/genetics.107.071506. [DOI] [PMC free article] [PubMed] [Google Scholar]
- Lang GI, Murray AW. Mutation rates across budding yeast chromosome vi are correlated with replication timing. Genome Biol Evol. 2011;3:799–811. doi: 10.1093/gbe/evr054. [DOI] [PMC free article] [PubMed] [Google Scholar]
- Lee Y, Zhou T, Tartaglia GG, Vendruscolo M, Wilke CO. Translationally optimal codons associate with aggregation-prone sites in proteins. Proteomics. 2010;10:4163–4171. doi: 10.1002/pmic.201000229. [DOI] [PMC free article] [PubMed] [Google Scholar]
- Leek JT, Scharpf RB, Bravo HC, Simcha D, Langmead B, Johnson WE, Geman D, Baggerly K, Irizarry RA. Tackling the widespread and critical impact of batch effects in high-throughput data. Nat Rev Genet. 2010;11:733–739. doi: 10.1038/nrg2825. [DOI] [PMC free article] [PubMed] [Google Scholar]
- Letzring DP, Dean KM, Grayhack EJ. Control of translation efficiency in yeast by codon-anticodon interactions. RNA. 2010;16:2516–2528. doi: 10.1261/rna.2411710. [DOI] [PMC free article] [PubMed] [Google Scholar]
- Li GW, Oh E, Weissman JS. The anti-Shine-Dalgarno sequence drives translational pausing and codon choice in bacteria. Nature. 2012;484:538–541. doi: 10.1038/nature10965. [DOI] [PMC free article] [PubMed] [Google Scholar]
- Lipson D, Raz T, Kieu A, Jones DR, Giladi E, Thayer E, Thompson JF, Letovsky S, Milos P, Causey M. Quantification of the yeast transcriptome by single-molecule sequencing. Nat Biotechnol. 2009;27:652–658. doi: 10.1038/nbt.1551. [DOI] [PubMed] [Google Scholar]
- Lynch M, Sung W, Morris K, et al. (11 co-authors) A genome-wide view of the spectrum of spontaneous mutations in yeast. Proc Natl Acad Sci U S A. 2008;105:9272–9277. doi: 10.1073/pnas.0803466105. [DOI] [PMC free article] [PubMed] [Google Scholar]
- Mathews M, Sonenberg N, Hershey JWB. Cold Spring Harbor: Cold Spring Harbor Laboratory press; 2007. Translational control in biology and medicine. [DOI] [PMC free article] [PubMed] [Google Scholar]
- Ogle JM, Ramakrishnan V. Structural insights into translational fidelity. Annu Rev Biochem. 2005;74:129–177. doi: 10.1146/annurev.biochem.74.061903.155440. [DOI] [PubMed] [Google Scholar]
- Ohnishi G, Endo K, Doi A, Fujita A, Daigaku Y, Nunoshiba T, Yamamoto K. Spontaneous mutagenesis in haploid and diploid Saccharomyces cerevisiae. Biochem Biophys Res Commun. 2004;325:928–933. doi: 10.1016/j.bbrc.2004.10.120. [DOI] [PubMed] [Google Scholar]
- Plotkin JB, Kudla G. Synonymous but not the same: the causes and consequences of codon bias. Nat Rev Genet. 2011;12:32–42. doi: 10.1038/nrg2899. [DOI] [PMC free article] [PubMed] [Google Scholar]
- Purdom E, Holmes SP. Error distribution for gene expression data. Stat Appl Genet Mol Biol. 2005;4:Article 16. doi: 10.2202/1544-6115.1070. [DOI] [PubMed] [Google Scholar]
- Qian W, Yang JR, Pearson NM, Maclean C, Zhang J. Balanced codon usage optimizes eukaryotic translational efficiency. PLoS Genet. 2012;8:e1002603. doi: 10.1371/journal.pgen.1002603. [DOI] [PMC free article] [PubMed] [Google Scholar]
- Raser JM, O’Shea EK. Noise in gene expression: origins, consequences, and control. Science. 2005;309:2010–2013. doi: 10.1126/science.1105891. [DOI] [PMC free article] [PubMed] [Google Scholar]
- Sella G, Hirsh AE. The application of statistical physics to evolutionary biology. Proc Natl Acad Sci U S A. 2005;102:9541–9546. doi: 10.1073/pnas.0501865102. [DOI] [PMC free article] [PubMed] [Google Scholar]
- Shah P, Gilchrist MA. Explaining complex codon usage patterns with selection for translational efficiency, mutation bias, and genetic drift. Proc Natl Acad Sci U S A. 2011;108:10231–10236. doi: 10.1073/pnas.1016719108. [DOI] [PMC free article] [PubMed] [Google Scholar]
- Sharp PM, Bailes E, Grocock RJ, Peden JF, Sockett RE. Variation in the strength of selected codon usage bias among bacteria. Nucleic Acids Res. 2005;33:1141–1153. doi: 10.1093/nar/gki242. [DOI] [PMC free article] [PubMed] [Google Scholar]
- Sharp PM, Li WH. The codon adaptation index—a measure of directional synonymous codon usage bias, and its potential applications. Nucleic Acids Res. 1987;15:1281–1295. doi: 10.1093/nar/15.3.1281. [DOI] [PMC free article] [PubMed] [Google Scholar]
- Siwiak M, Zielenkiewicz P. A comprehensive, quantitative, and genome-wide model of translation. PLoS Comput Biol. 2010;6:e1000865. doi: 10.1371/journal.pcbi.1000865. [DOI] [PMC free article] [PubMed] [Google Scholar]
- Sørensen MA, Kurland CG, Pedersen S. Codon usage determines translation rate in Escherichia coli. J Mol Biol. 1989;207:365–377. doi: 10.1016/0022-2836(89)90260-x. [DOI] [PubMed] [Google Scholar]
- Stoletzki N, Eyre-Walker A. Synonymous codon usage in Escherichia coli: selection for translational accuracy. Mol Biol Evol. 2007;24:374–381. doi: 10.1093/molbev/msl166. [DOI] [PubMed] [Google Scholar]
- Tuller T, Carmi A, Vetsigian K, Navon S, Dorfan Y, Zaborske J, Pan T, Dahan O, Furman I, Pilpel Y. An evolutionarily conserved mechanism for controlling the efficiency of protein translation. Cell. 2010;141:344–354. doi: 10.1016/j.cell.2010.03.031. [DOI] [PubMed] [Google Scholar]
- Vieira-Silva S, Rocha EPC. The systemic imprint of growth and its uses in ecological (meta)genomics. PLoS Genet. 2010;6:e1000808. doi: 10.1371/journal.pgen.1000808. [DOI] [PMC free article] [PubMed] [Google Scholar]
- von der Haar T. A quantitative estimation of the global translational activity in logarithmically growing yeast cells. BMC Syst Biol. 2008;2:87. doi: 10.1186/1752-0509-2-87. [DOI] [PMC free article] [PubMed] [Google Scholar]
- Wickham H. A layered grammar of graphics. J Comput Graph Stat. 2010;19:3–28. [Google Scholar]
- Yang Z, Nielsen R. Mutation-selection models of codon substitution and their use to estimate selective strengths on codon usage. Mol Biol Evol. 2008;25:568–579. doi: 10.1093/molbev/msm284. [DOI] [PubMed] [Google Scholar]
- Yassour M, Kaplan T, Fraser HB, et al. (14 co-authors) Ab initio construction of a eukaryotic transcriptome by massively parallel mRNA sequencing. Proc Natl Acad Sci U S A. 2009;106:3264–3269. doi: 10.1073/pnas.0812841106. [DOI] [PMC free article] [PubMed] [Google Scholar]
- Yee T. The VGAM package for categorical data analysis. J Stat Software. 2010;32:1–34. [Google Scholar]
- Zaher HS, Green R. Fidelity at the molecular level: lessons from protein synthesis. Cell. 2009;136:746–762. doi: 10.1016/j.cell.2009.01.036. [DOI] [PMC free article] [PubMed] [Google Scholar]
- Zenklusen D, Larson DR, Singer RH. Single-RNA counting reveals alternative modes of gene expression in yeast. Nat Struct Mol Biol. 2008;15:1263–1271. doi: 10.1038/nsmb.1514. [DOI] [PMC free article] [PubMed] [Google Scholar]
- Zhou T, Weems M, Wilke CO. Translationally optimal codons associate with structurally sensitive sites in proteins. Mol Biol Evol. 2009;26:1571–1580. doi: 10.1093/molbev/msp070. [DOI] [PMC free article] [PubMed] [Google Scholar]
Associated Data
This section collects any data citations, data availability statements, or supplementary materials included in this article.