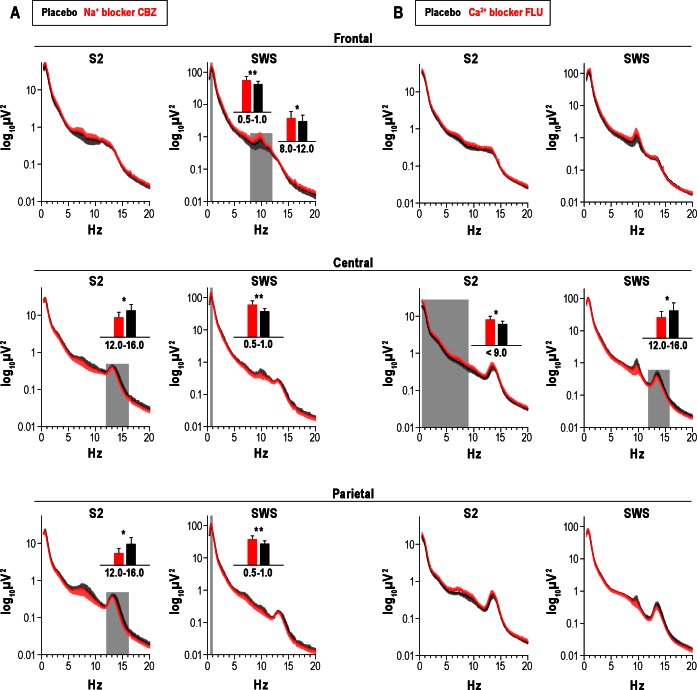
Figure 1.
Mean (± standard error of the mean) power spectra for Stage 2 sleep (S2) and slow wave sleep (SWS) after the Na+ channel blocker carbamazepine, Na+ blocker CBZ (A) and the Ca2+ channel blocker flunarizine, Ca2+ blocker FLU (B). Frontal, central, and parietal correspond to the midline electroencephalographic recording sites Fz, Cz, and Pz. Gray areas indicate frequency bands revealing differences between verum and placebo in paired t-tests. Inserted bar charts give power on linear scale for significantly different frequency bands (*P < 0.05, **P < 0.01).

