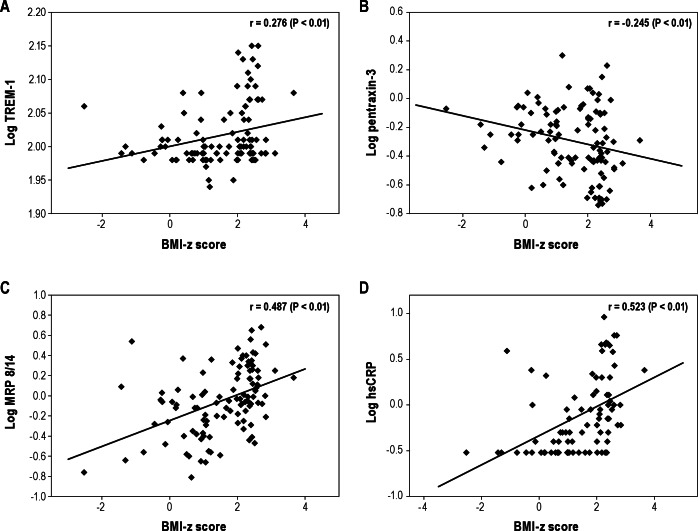
Figure 4.
Scatterplots of individual log triggering receptor expressed on myeloid cells-1 (TREM-1) (A), pentraxin-3 (B), myeloid-related protein (MRP) 8/14 (C), and high-sensitivity C-reactive protein (hsCRP) (D) levels plotted against corresponding body mass index (BMI)-z scores. A significant positive linear correlation between BMI-z score and log TREM-1 (r = 0.276, P < 0.01), log MRP 8/14 (r = 0.487, P < 0.01), and log hsCRP (r = 0.523, P < 0.01) emerged and a significant negative linear correlation between BMI-z score and log pentraxin-3 (r = -0.245, P < 0.01) was apparent.

