

Abstract
A growing literature suggests that stressful events in pregnancy can have negative effects on birth outcomes. Some of the estimates in this literature may be affected by small samples, omitted variables, endogenous mobility in response to disasters, and errors in the measurement of gestation, as well as by a mechanical correlation between longer gestation and the probability of having been exposed. We use millions of individual birth records to examine the effects of exposure to hurricanes during pregnancy, and the sensitivity of the estimates to these econometric problems. We find that exposure to a hurricane during pregnancy increases the probability of abnormal conditions of the newborn such as being on a ventilator more than 30 minutes and meconium aspiration syndrome (MAS). Although we are able to reproduce previous estimates of effects on birth weight and gestation, our results suggest that measured effects of stressful events on these outcomes are sensitive to specification and it is preferable to use more sensitive indicators of newborn health.
Health at birth is predictive of important child outcomes including educational attainment and adult earnings. Hence, economists are increasingly concerned with understanding the impacts of conditions during pregnancy on birth outcomes.1 One intriguing hypothesis is that stress during pregnancy could have negative effects on the fetus through neuroendocrine changes, changes in immune function, and/or through behavioral channels (Denckel-Schetter, 2011). Extreme weather events represent an unpredictable and unusual source of stress during pregnancy.
This paper analyzes the effects of severe storms and hurricanes on birth outcomes in Texas over the period 1996 to 2008. In principle, hurricanes could also subject pregnant women to other negative conditions including injury, disruptions in the supply of clean water, inadequate access to safe food, exposure to environmental toxins, interruption of healthcare, or crowded conditions in shelters (Callaghan et al. (2007)). However, in the U.S., with the notable exception of hurricane Katrina, such direct threats to health from hurricanes affect only very small numbers of people. The primary threat to pregnant women in the path of a hurricane is the stress that is generated by the fear of the hurricane, as well as by the property damage and disruption that follows it.
The existing empirical literature on disasters and infant health is generally limited to studies comparing birth outcomes before and after a disaster in the area of occurrence (Glynn et al. (2001); Lauderdale (2006); Eskenazi et al. (2007); Simeonova (2009); Tan et al. (2009), Eccleston (2011)). Such comparisons can be problematic if people respond to disasters by moving. Additionally, many previous studies are based on small samples and use self-reported measures of stress exposure, which could exacerbate measurement error bias. A third issue is that many previous studies count exposure backwards from the date of birth rather than forwards from the date of conception. Such a procedure could bias the estimated relationship between exposure to the stressful event, gestation, and other outcomes that depend on gestation length. A related issue is that there is a mechanical correlation between length of gestation and the probability of having been exposed to a disaster in the third trimester of pregnancy. Although these measurement issues sound arcane, we show below that they have a significant impact on the estimated effects of disaster exposure.
We use a confidential version of all Texas birth records from 1996 to 2008 with information on mothers’ names, dates of birth, and residential addresses. This information allows us to link siblings born to the same mother and to identify mothers who were in the path of major tropical storms and hurricanes using data from the Weather Underground Hurricane Archive. We compare mothers who lived in the path of the hurricane to those who lived further away, and use mother fixed effects and an instrumental variables strategy to control for time-invariant maternal characteristics that might be correlated both with residential location and birth outcomes. We also explore issues related to measurement of gestation, and the mechanical correlation of gestation length with probability of exposure.
We show that estimated effects on birth weight and gestation are sensitive to econometric specification, and especially to measurement issues. This is not simply a matter of power since we see precisely estimated and extremely robust effects of disaster exposure on more subtle measures of infant health: mothers living within 30 kilometers of the hurricane path during their third trimester are 60% more likely to have a newborn with abnormal conditions (including meconium aspiration syndrome, and being on a ventilator more than 30 minutes), and 30% more likely to have any complications during labor and/or delivery. The medical literature suggests that infants with these conditions are significantly more likely to experience adverse long term consequences, including developmental delays, compared to other infants.
We find no placebo effects of exposure to hurricanes six months after birth, which provides support for the validity of our identification strategy. We also find little consistent evidence of effects on maternal behaviors including smoking, weight gain, and use of prenatal care that could explain our findings. Further, our results suggest that the effects on abnormal conditions of the newborn are not due to changes in medical care which might be associated with the hurricane.
There are many possible ways for hurricane exposure to affect pregnancy outcomes. In this paper, we believe we have ruled out some important potential pathways including changes to migration, medical care, and maternal behavior. Therefore, while stress is a “residual explanation” in our context, we believe that our results may reflect the effects of stress itself during pregnancy. Our results suggest that the effects of stress on fetal health, while important, may be more subtle than previous research has suggested.
The rest of the paper proceeds as follows. Section I presents a review of the existing literature, while Section II discusses the data, sample, and presents summary statistics. The empirical methods are discussed in detail in Section III, while Section IV presents the main results. Several robustness checks are presented in Section V, and Section VI concludes.
Background
A growing literature in public health (such as Glynn et al. 2001, Xiong et al. 2008, and Tan et al. 2009) studies the effects of disasters on birth outcomes. These studies typically involve small samples, and few if any control variables making it difficult to assess their causal claims. In a large-scale study, Simeonova (2009) uses county-level data on all births in the United States over 1968–1988 and a range of natural disasters and finds that exposure to a disaster during pregnancy increases the likelihood of a preterm birth by about 1.3%. She finds little effect on birth weight. One difficulty with using county-level data is that one must defacto assume that babies born in month t were conceived at month t-9. As we show below, correcting this simple measurement issue can have a large effect on the estimates. Torche (forthcoming) uses individual level data with correctly measured exposure to study the effects of the 2005 earthquake in Chile and finds that exposure to the worst shaking during the first trimester of pregnancy increased the risk of low birth weight and short gestation (though more moderate shaking had no significant effect). Our study improves on hers by including maternal fixed effects and accounting for the possibility of maternal mobility.2
Another strand of literature has studied the impacts of the September 11 terrorist attacks. These studies typically compare women living or working in the area around the World Trade Center to women in another area, under the maintained assumption that women further away experienced less stress (Berkowitz et al. (2003); Lipkind et al. (2010)). Other studies conduct an analysis comparing birth outcomes of New York City women pregnant before and after 9/11 (Lederman et al. (2004); Eskenazi et al. (2007), Eccleston (2011)). The results from this literature are mixed.3
As discussed above, one possible problem with these studies is that the population of women may change in an affected area following disasters. Changes in composition may decrease birth weight if those left behind are more disadvantaged, but the effect could also work the other way. For instance, after Hurricane Katrina, New Orleans lost a large part of its black population and gained Hispanics and Asians, trends that are likely to increase mean birth weight (Plyer, 2011). Deschênes and Moretti (2009) document the fact that migration is an important determinant of a population’s exposure to extreme weather events over time. Data like ours that follows individual mothers over time can be used to control for such changes in the composition of mothers.
Camacho (2008) uses an identification strategy close to ours, and exploits the variation in the number of landmine explosions in Colombia by municipality and quarter over 1998–2003 on births using a design with mother fixed effects. She finds that living near a landmine explosion during pregnancy reduces birth weight by approximately 9 grams (on a mean of 3153 grams) but finds no significant effect on the incidence of low birth weight and a very small impact on prematurity.
Mansour and Rees (2011) examine the effect of the intensity of the Intifada-related conflict in the West Bank and Gaza to gauge the effect of stress during pregnancy on birth outcomes. They find that increases in the number of conflict-related deaths are associated with small increases in the incidence of low birth weight, though they are not entirely able to rule out other channels, such as nutritional deprivation or maternal mobility.
Aside from these studies of exposure to disaster, there is a vast medical literature on the effects of maternal stress during pregnancy. In a literature review of major studies published between 1966 and 2001, Mulder et al. (2002) report that pregnant women with high (generally self-reported) stress and anxiety levels are at an increased risk for spontaneous abortion, preterm labor, low birth weight, and for having a malformed or growth-restricted baby. However, these findings cannot be interpreted as causal as they likely suffer from omitted variables bias due to other factors that are correlated both with stress and birth outcomes (for example, poverty or poor health).
Aizer, Stroud, and Buka (2009) improve on this literature by examining data from a longitudinal study that took measures of the stress hormone cortisol during pregnancy. In maternal fixed effects models, they find that in-utero exposure to cortisol has little effect on birth weight or on the probability of low birth weight, which is similar to what we find below using the much larger sample of Texas mothers. Nevertheless, they find that infants exposed to high levels of cortisol during pregnancy have significantly lower schooling attainment and verbal IQ scores and are more likely to have a chronic health condition at age 7. Our results are broadly consistent with this pattern: the increase in abnormal conditions of the newborn that we find may in turn be linked to poorer outcomes in later life.
Overall, the existing literature suggests that despite the many previous studies and strong causal claims, the effects of exposure to disaster on birth weight and gestation remain unclear. However, birth weight and gestation are crude measures of health at birth (Almond, Chay and Lee, 2005). The main reason they are examined is because they are available, and have been linked to long-term outcomes. The results of Aizer, Stroud, and Buka (2009) suggest that it might be possible to see evidence of maternal stress on more sensitive indicators of health at birth, a possibility we explore for the first time below. The literature also provides a motivation for finding empirical methods that can address the selection, endogeneity, and exposure timing issues that have plagued previous studies in order to gauge the effects of stressful events during pregnancy on health at birth. We attempt to fill this gap in the literature by analyzing the effects of storms and hurricanes using data from the universe of Texas birth records.
Data and Summary Statistics
Data on Storms and Hurricanes
Our data on hurricanes and severe storms comes from The Weather Underground Hurricane Archive, a publicly available database of information on all North Atlantic, East Pacific, Western Pacific, and Indian Ocean storms since 1851.4 These data include the storm or hurricane name, the total damages caused in millions of dollars, the total number of deaths, and detailed tracking information on the latitude and longitude coordinates of the storm path, the wind speed, and the storm type for each day of the storm.5 We extracted data on the eight hurricanes and tropical storms that hit any part of Texas over 1996–2008 and caused more than $10 million in damages.
Figure 1 shows a map of the eight storm paths that hit Texas over 1996–2008. All major storms occur in the eastern and southern parts of Texas. The striped, dotted, and yellow shaded areas represent all points within 100, 60, and 30 kilometers, respectively, of the storm paths. The eye of a major storm is typically 30 to 60 kilometers across, and the eye is surrounded by the strongest winds (Weatherford and Gray, 1988). Thus, the 30 kilometer bands around the storm track represent the area the eye passed over, where there was likely to have been the most severe damage. Below we discuss results using alternative bands, and also incorporating the fact that different hurricanes had different maximum wind speeds. The costliest storms in our data are tropical storm Allison in 2001 which caused more than $50 billion in damages and cost 40 lives, and Hurricane Ike in 2008 which caused $19.3 billion in damages but cost 103 lives. The only other storm in our data to cause much loss of life was tropical storm Charley in 1998, which cost 20 lives but caused a comparatively minor $50 million in damages.
Figure 1.
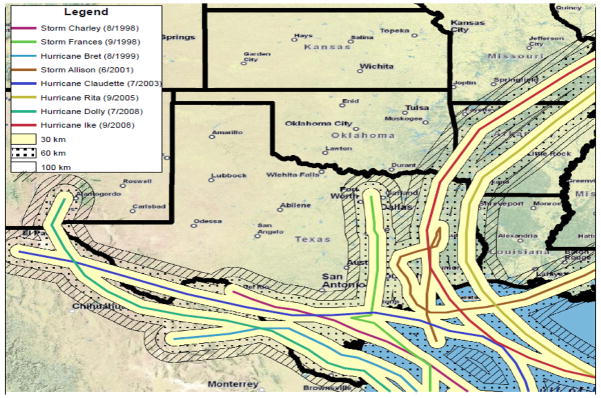
Hurricane and Storm Tracks, 1996–2008
Data on Births
We use from the universe of Texas birth records over 1996–2008 which is available from the Texas Department of State Health Services. In addition to birth weight and gestational age (which, along with the date of birth can be used to compute the date of conception), birth records include information about the mother’s demographics (age, race, education, marital status), the child (sex, birth order), method of delivery, complications of labor and delivery, risk factors for the pregnancy (such as diabetes and high blood pressure), and maternal behaviors such as prenatal care, and smoking. We use a restricted version of the data which also has the latitude and longitude of the mother’s residential address, and the mother’s name and date of birth.
The analysis sample is limited to single births with non-missing information on the child’s date of birth and the mother’s full maiden name, date of birth, birth place, race/ethnicity, and the longitude and latitude coordinates of her residence address (N=4,237,494). We also dropped the 61,420 births with either less than 26 weeks gestation or missing gestation information. This restriction results in dropping about 1 percent of the sample and these births have much worse outcomes than other infants. This restriction had no impact on our findings but facilitated the estimation of the “hazard” models below.
Siblings are identified using all of the available time-invariant maternal characteristics –full maiden name, date of birth, birth place, and race/ethnicity. The data also have information on each child’s exact birth date and the date of the last live birth for each second or higher birth, which we use to check the sibling matches. We drop any birth records that cannot be linked to a sibling using these methods (2,905,633 births). The resulting sibling sample consists of 1,270,441 births.
We calculate the distance to the closest point on the storm path using the longitude and latitude coordinates of the mothers’ residential addresses. In order to focus on people who lived in areas at risk of hurricanes, we keep only sibling births to mothers who ever lived within 100 kilometers of any point along a storm path (regardless of whether or not they were pregnant during the actual storm occurrence). This means that we omit mothers who only lived in areas never hit by storms, such as Abilene or Lubbock. We omit mothers who live in Austin and San Antonio, as both cities are on the 100 kilometer boundary (the results are not sensitive to this exclusion). These selections leave us with a main analysis sample of 485,111 sibling births. We use information on the children’s dates of birth, gestation, and the dates of storm occurrences to calculate whether a child was exposed to a hurricane during the 1st, 2nd, or 3rd trimester of the mother’s pregnancy in two different ways: either counting backwards from the time of the birth as many previous studies have done, or counting forwards from the date of conception.
Table 1 presents summary statistics for the Texas births data. The first column shows the means for all births over 1996–2008 (i.e., not just siblings) with non-missing birth weight and gestation information. The other columns are limited to our main analysis sample of sibling births whose mothers ever lived within 100 kilometers of a hurricane or storm path.6 Comparing columns 1 and 2 shows that mothers in the sibling sample are more likely to be between 20 and 34, less likely to be high school drop-outs, more likely to be married, and less likely to be Hispanic than the full sample of mothers.
Table 1.
Variable Means
| All Texas Births (N=4,193,778) | Sibling Analysis Sample (N=485,048) | Mothers w No Hurricane < 30km During Any Pregnancy (N=477,080) | Mother Ever had a Hurricane < 30km During Pregnancy (N=7,968) | Hurricane < 30km During Pregnancy (N=3,430) | |
|---|---|---|---|---|---|
| Mother’s age <20 | 0.145 | 0.132 | 0.132 | 0.154 | 0.149 |
| Mother’s age 20–24 | 0.280 | 0.297 | 0.297 | 0.324 | 0.311 |
| Mother’s age 25–34 | 0.468 | 0.486 | 0.487 | 0.448 | 0.457 |
| Mother’s age 35–44 | 0.107 | 0.085 | 0.085 | 0.074 | 0.083 |
| Mother’s age 45+ | 0.0007 | 0.0003 | 0.0003 | 0.0003 | 0.0003 |
| Mother’s ed: <HS | 0.311 | 0.281 | 0.282 | 0.264 | 0.247 |
| Mother’s ed: HS degree | 0.329 | 0.341 | 0.341 | 0.374 | 0.386 |
| Mother’s ed: some college | 0.159 | 0.157 | 0.157 | 0.160 | 0.161 |
| Mother’s ed: college+ | 0.191 | 0.211 | 0.212 | 0.199 | 0.202 |
| Mother is married | 0.648 | 0.679 | 0.679 | 0.654 | 0.668 |
| Mother is non-Hispanic white | 0.368 | 0.425 | 0.423 | 0.524 | 0.531 |
| Mother is black | 0.118 | 0.168 | 0.170 | 0.067 | 0.066 |
| Mother is Hispanic | 0.475 | 0.376 | 0.375 | 0.395 | 0.389 |
| Child is male | 0.511 | 0.511 | 0.511 | 0.518 | 0.520 |
| Birth weight (g) | 3298 (SD=557) | 3329 (SD=523) | 3329 (SD=523) | 3325 (SD=520) | 3333 (SD=525) |
| Low birth weight (<2500g) | 0.063 | 0.053 | 0.053 | 0.053 | 0.054 |
| Gestation (weeks) | 38.600388 (SD=2.039) | 38.672 (SD=1.721) | 38.673 (SD=1.722) | 38.581 (SD=1.692) | 38.571 (SD=1.715) |
| C-Section Delivery | 0.276 | 0.282 | 0.282 | 0.283 | 0.294 |
| Induced Labor | 0.216 | 0.200 | 0.198 | 0.273 | 0.271 |
| Mother smoked during pregnancy | 0.059 | 0.066 | 0.065 | 0.093 | 0.097 |
| Average #cigarettes per day | 0.506 (SD=2.612) | 0.585 (SD=2.832) | 0.582 (SD=2.826) | 0.779 (SD=3.203) | 0.786 (SD=3.221) |
| Mother gained <16 lbs | 0.120 | 0.121 | 0.121 | 0.121 | 0.120 |
| Mother gained >60 lbs | 0.032 | 0.031 | 0.031 | 0.031 | 0.027 |
| Number prenatal visits | 10.799 (SD=4.254) | 11.350 (SD=4.179) | 11.345 (SD=4.184) | 11.598 (SD=3.869) | 11.675 (SD=3.785) |
| Adequate prenatal care | 0.744 | 0.784 | 0.783 | 0.818 | 0.827 |
|
| |||||
| Variables Available 1996–2004 Only | N=2,741,605 | N=301,683 | N=296,130 | N=5,553 | N=2,418 |
|
| |||||
| Any Abnormal Conditions of Newborn | 0.056 | 0.051 | 0.051 | 0.082 | 0.096 |
| Any Assisted Ventilation | 0.040 | 0.038 | 0.038 | 0.045 | 0.040 |
| Assisted Ventilation 30+ Minutes | 0.008 | 0.007 | 0.007 | 0.012 | 0.019 |
| Meconium Aspiration Syndrome | 0.002 | 0.003 | 0.003 | 0.021 | 0.035 |
| Hyaline Membrane Disease | 0.005 | 0.005 | 0.005 | 0.004 | 0.003 |
| Arterial Blood Gas pH <7.2 | 0.009 | 0.004 | 0.004 | 0.017 | 0.022 |
| Any Complications Labor/Delivery | 0.156 | 0.133 | 0.133 | 0.164 | 0.177 |
| Moderate/Heavy Meconium | 0.047 | 0.043 | 0.043 | 0.064 | 0.073 |
| Premature Rupture of Membranes | 0.013 | 0.010 | 0.010 | 0.010 | 0.010 |
| Dysfunctional Labor | 0.027 | 0.014 | 0.015 | 0.012 | 0.015 |
| Breech/Malpresentation | 0.027 | 0.026 | 0.026 | 0.028 | 0.031 |
Notes: The “All Texas Births” sample omits births with missing gestation or birth weight. The analysis sample is the universe of singleton sibling births with gestation >26 weeks in Texas between 1996–2008 whose mothers lived within 100km of areas that were ever struck by a storm or hurricane over this period. Mothers who live in Austin and San Antonio (both at the 100km boundary) are omitted. There were 8 hurricanes or storms (>40mph windspeed and >$10 million in property damages) over 1996–2008. Births to mothers who have at most one child with non-missing gestation or birth weight data are omitted from the sample. For 1996–2004 variables, births to mothers who have at most one child with non-missing data for any abnormal condition or complications from labor/delivery are also omitted (183,428 births).
The total analysis sample sizes for variables about maternal pregnancy behavior (smoking, number cigarettes, weight gain, and prenatal care) and characteristics of delivery (c-section, induced labor) range from 439,837 to 483,354.
Timing of exposure is calculated using information on the child’s birth date and child’s gestation length (in weeks) to calculate approximate date of conception. Texas changed the abnormal conditions of the newborn and the complications of labor/delivery that are reported on the birth certificate in 2005.
In our sibling sample, the modal mother is aged 25–34 years at the time of childbirth and has a high school degree. About 68 percent of mothers are married at the time of childbirth. Forty-three percent of mothers are non-Hispanic white, 17 percent are black, and 38 percent are Hispanic. The mean birth weight is around 3,330 grams, and about 5% of these babies are born low-birth-weight (defined as birth weight less than 2,500 grams), and 8% are born premature (defined as gestation less than 37 weeks).
Most previous analyses of the effects of stressful events during pregnancy on infant health at birth have focused on effects on birth weight and gestation. This study breaks new ground by also looking at abnormal conditions of the newborn and complications of labor and/or delivery. Five percent of newborns have abnormal conditions, and 13 percent of births have complications.
The most common abnormal condition is any assisted ventilation. More serious conditions include meconium aspiration syndrome (MAS), arterial blood gas with low pH, and being on a ventilator more than 30 minutes. All of these conditions reflect difficulty breathing. The most common complications of labor and delivery are meconium staining of the amniotic fluid, dysfunctional labor, and breech presentation. Texas changed the reporting of abnormal conditions of the newborn and the complications of labor/delivery in 2005 and the data is not consistently reported before and after 2005. Hence, our analysis of these conditions is based on the data for 1996–2004 only.7
An important question is whether these abnormal conditions measure something distinct from low birth weight. Low birth weight infants are much more likely to have these conditions: 16% of low birth weight infants have an abnormal condition compared to 4% of infants with higher birth weight. However, because low birth weight infants represent only 6.3% of sample births, only 21% of infants with abnormal conditions are also low birth weight. Moreover, the incidence of low birth weight in children without abnormal conditions is 6%. Thus, it appears that a diagnosis of an abnormal condition conveys important additional information about the child’s health at birth.
A second issue is how confident we are that the abnormal conditions of the newborn that we observe are predictive of future outcomes. There are few studies tracking long-term outcomes of children with these conditions. Beligere and Rao (2008) followed a small number of infants with MAS for three years and found that 21% had cerebral palsy and/or severe developmental delays. Forty percent had mild speech delays. These are very high rates of impairment relative to what would be expected in a sample of low birth weight children who did not have additional complications. McFarlane and Heaf (1988) reported that MAS was linked to a higher prevalence of childhood asthma. Hamutcu et al. (2004) suggest that the treatment of lung problems with mechanical ventilation can itself cause future lung injury. Hence, there is some evidence that these conditions are sensitive predictors of future disability though finding better measures of health at birth is an active area of research.
In columns 3, 4, and 5 of Table 1, we split the sample by whether or not the mother ever experienced a hurricane or storm within 30 kilometers of her home during any pregnancy, or by whether she experienced one during the current pregnancy. The most striking difference between mothers near storm paths during pregnancy and other mothers is that they are less likely to be black and more likely to be non-Hispanic white. They are also more likely to be less than 20, less likely to be high school dropouts, and less likely to be married than other mothers. These results suggest that women near storm paths are not systematically more or less advantaged than other mothers – but then there is no reason to expect women in a city like Galveston that suffers hurricanes to be systematically more or less advantaged than those in a city like Abilene, which does not.
Empirical Methods
Table 1 shows that there are differences between women who live within 30 km of a hurricane path while pregnant and other pregnant women. A common way to control for selection into areas that are prone to disasters is to include area (such as county or municipality), birth year, and birth month fixed effects. However, while such a method controls for time-invariant area-specific factors (for example, if areas that are more likely to be hit by a disasters tend to be more disadvantaged), and for overall seasonal effects, there may still be selection within areas in who is affected by disaster. And there may still be geographical sorting in response to a disaster. Since disasters often lead to dislocation and migration, this issue is potentially important.
To assess the importance of selection on observables in our data, we first examined the relationship between living within 30 kilometers of a storm during pregnancy and maternal characteristics. Specifically, we estimated the following equation using Ordinary Least Squares (OLS):
| (1) |
for each child i, born in year y, month m, with mother in county of residence c. Xiymc is a maternal characteristic, such as an indicator for the mother being less than 20 years old, or an indicator for the mother having less than a high school education. HUR_1triiymc is an indicator equal to 1 if a hurricane or storm occurred within 30 kilometers of i’s mother’s home during her 1st trimester of pregnancy, and 0 otherwise. HUR_2triiymc and HUR_3triiymc are similar indicators for the 2nd and 3rd trimesters, respectively. County fixed effects are indicated by αc. The vector γy are birth year fixed effects, while δm are birth month fixed effects, and εiymc is a child-specific error term. We estimate this model with and without county fixed effects. Standard errors are clustered at the county level.
If the county, birth month, and birth year fixed effects included in this model control for selection, then we should not expect to see any statistically significant β coefficients. A statistically significant relationship between exposure to a hurricane or a storm and maternal characteristics in this model would suggest that county-level controls are not sufficient to account for selection into storm exposure. The first panel of Table 2 shows that there are some observable differences between mothers who are exposed to hurricanes, especially in the third trimester, and others. However, the second panel of Table 2 shows that including county fixed effects actually does a good job of controlling for these differences, though a few differences remain. For example, column 2 suggests that there was an increase in the number of women in the third trimester of pregnancy in a county following hurricane exposure, suggesting in-migration (though we only see this using log births and not the number of births). It is important to highlight that while county fixed effects may control for the limited observable differences between mothers exposed to hurricanes and other mothers such as age, race, and educational attainment, a concern about differences in unobservable characteristics remains. For instance, women who remain in an area following a storm or a hurricane may be different in their wealth levels, owning versus renting a home, or presence of social and family ties to the area than other women. We do not observe such information.
Table 2.
Maternal Characteristics and Exposure to Hurricanes in Texas
| Total Births | Log Births | Mother’s Age <20 |
Mother’s Age 45+ |
Mother’s Ed: <HS |
Mother’s Ed: HS degree |
Mother’s Ed: Some College |
Mother’s Ed: College+ |
Mother’s Ed: Missing |
Mother is Married |
Marital Status Missing |
Mother is Black |
Mother is Hispanic |
|
|---|---|---|---|---|---|---|---|---|---|---|---|---|---|
| A. No County FE | |||||||||||||
|
| |||||||||||||
| Hurricane 1st Trimester | −38.6334 (38.3424) |
0.2191 (0.4008) |
0.0212+
(0.0117) |
−0.0003+
(0.0001) |
−0.0399 (0.0321) |
0.0479 (0.0290) |
0.0154 (0.0151) |
−0.0182 (0.0368) |
−0.0052 (0.0037) |
−0.0312 (0.0451) |
−0.0006***
(0.0001) |
−0.1004***
(0.0293) |
0.0191 (0.1212) |
| Hurricane 2nd Trimester | −43.1076 (37.7178) |
0.2193 (0.3751) |
0.0171 (0.0297) |
0.0006 (0.0009) |
−0.0494 (0.0378) |
0.0157 (0.0239) |
0.0183**
(0.0085) |
0.0238 (0.0511) |
−0.0085**
(0.0036) |
0.0056 (0.0527) | −0.0005***
(0.0001) |
−0.1010***
(0.0282) |
0.0036 (0.1176) |
| Hurricane 3rd Trimester | −34.8283 (41.0219) |
0.3424 (0.3143) |
0.0144 (0.0100) |
−0.0002**
(0.0001) |
−0.0326 (0.0246) |
0.0402**
(0.0131) |
0.0159 ( 0.0131) |
−0.0153 (0.0297) | −0.0082**
(0.0032) |
−0.0263 (0.0505) |
0.0003 (0.0006) | −0.0930**
(0.0331) |
−0.0330 ( 0.0984) |
|
| |||||||||||||
| B. County FE | |||||||||||||
|
| |||||||||||||
| Hurricane 1st Trimester | 0.5707 (3.4714) |
0.0119 (0.0463) |
0.0006 (0.0057) |
−0.0001 (0.0001) |
−0.0250 (0.0214) |
0.0190 ( 0.0173) |
0.0024 (0.0151) |
0.0041 (0.0158) |
−0.0004 (0.0029) |
0.0123 (0.0236) |
−0.0006***
(0.0001) |
−0.0142 (0.0108) |
−0.0118 (0.0355) |
| Hurricane 2nd Trimester | 0.8649 (2.3668) |
0.0232 (0.0657) |
0.0016 (0.0238) |
0.0007 (0.0009) |
−0.0285 (0.0240) |
−0.0089 (0.0143) |
0.0050 (0.0071) |
0.0362 (0.0320) |
−0.0039 (0.0028) |
0.0364 (0.0303) |
−0.0005***
(0.0001) |
−0.0191 (0.0143) |
0.0056 (0.0341) |
| Hurricane 3rd Trimester | 2.4215 (6.1164) |
0.0949**
(0.0330) |
0.0025 (0.0079) |
−0.0001 (0.0001) |
−0.0083 (0.0165) |
0.0158 (0.0114) |
0.0037 (0.0127) |
−0.0068 (0.0184) |
−0.0043+
(0.0024) |
−0.0098 (0.0290) |
0.0004 (0.0006) |
−0.0092 (0.0153) |
−0.0063 (0.0248) |
|
| |||||||||||||
| N | 37,044 | 34,027 | 485,111 | 485,111 | 485,111 | 485,111 | 485,111 | 485,111 | 485,111 | 485,111 | 485,111 | 485,111 | 485,111 |
Notes: Each column in each panel is a separate regression. The first two columns are estimated on the universe of Texas births data collapsed to the conception-year/conception-month/county-of-residence level (not restricted to siblings). These data are limited to conceptions in January 1996–March 2008. All other columns use individual-level data. See notes under Table 1 for information on the sample of analysis and the storms and hurricanes. All regressions include conception year and conception month fixed effects. The regressions in Panel B also include county fixed effects. Robust standard errors are clustered on the county level.
Significance levels:
p<0.10
p<0.05
p<0.001
In order to assess whether some people are more likely to move in response to a hurricane than others, we estimated models of the following form:
| (2) |
where Mikym is the probability that a woman moved more than 5 kilometers between births and HUMikym is an indicator for whether she was exposed to a hurricane during her first pregnancy. We used a 5 km cutoff because geocoding is not entirely accurate, and it is possible that some women who stay in the same location will be recorded at slightly different coordinates at different pregnancies. We estimated this model with and without county fixed effects, αc. The coefficients on the interaction terms, β2, allow us to assess the importance of differential responses by observable characteristics. Table 3 suggests that there is some evidence of endogenous mobility: in particular, black mothers, mothers with more children, and older mothers (especially those over 45) are less likely to move following a hurricane than others.
Table 3.
Linear Probability Models of the Effect of Hurricane During First Pregnancy on Probability of Moving >5km Before Next Pregnancy
| Outcome: Mother Moved 5+ km Between Pregnancies | ||||
|---|---|---|---|---|
|
| ||||
| (1) | (2) | (3) | (4) | |
| Hurricane in 30km Radius During 1st Pregnancy | −0.0187 (0.0262) | 0.0083 (0.0111) | 0.0787 (0.0902) | 0.1499+ (0.0833) |
| Hurricane * Number Children | −0.0408** (0.0152) | −0.0492** (0.0173) | ||
| Hurricane * Mother is Non-Hispanic White | −0.0085 (0.0724) | −0.0323 (0.0725) | ||
| Hurricane * Mother is Black | −0.0917+ (0.0501) | −0.0946+ (0.0510) | ||
| Hurricane * Mother is Hispanic | −0.0415 (0.0490) | −0.0812 (0.0543) | ||
| Hurricane * Hispanic Missing | 0.2054 (0.2065) | 0.1141 (0.2323) | ||
| Hurricane * Mother’s Age 20–24 | −0.0165 (0.0206) | −0.0073 (0.0211) | ||
| Hurricane * Mother’s Age 25–34 | −0.0526** (0.0237) | −0.0444+ (0.0232) | ||
| Hurricane * Mother’s Age 35–44 | −0.0498 (0.0366) | −0.0378 (0.0346) | ||
| Hurricane * Mother’s Age 45+ | −0.1869*** (0.0487) | −0.1714*** (0.0482) | ||
| Hurricane * Mother’s Education <HS | 0.0487 (0.0953) | 0.0521 (0.0965) | ||
| Hurricane * Mother’s Education HS+ | 0.0858 (0.0726) | 0.0767 (0.0728) | ||
| Hurricane * Mother’s Education Some College | 0.0729 (0.0455) | 0.0682 (0.0452) | ||
| Hurricane * Mother’s Education Missing | 0.1224 (0.1322) | 0.1664 (0.1177) | ||
| Hurricane * Mother is Married | 0.0002 (0.0240) | −0.0012 (0.0231) | ||
| Constant | 0.0775** (0.0292) (0.0290) | 0.0626*** (0.0125) (0.0121) | 0.0770** (0.0294) (0.0291) | 0.0620*** (0.0125) (0.0121) |
|
| ||||
| First County of Residence FE | No | Yes | No | Yes |
| N | 485,111 | 485,111 | 485,111 | 485,111 |
Notes: Each column is a separate regression. See notes under Table 1 for information on the sample of analysis and the storms and hurricanes.
In addition to the listed covariates, all regressions include main effects for mother’s race, age, education, marital status, and number of children as well as conception year and conception month fixed effects. The regressions in the 2nd and 4th columns also include fixed effects for the mother’s first county of residence. All robust standard errors are clustered on the mother’s first county of residence
Omitted categories: mother’s race - other; mother’s age <20; mother’s education college+; mother is unmarried.
Significance levels:
p<0.10
p<0.05
p<0.001
It is not entirely clear how these differences may play out in terms of predicted infant health outcomes. Hence, we also do an event study of predictors of low birth weight in the areas within 30 km of a storm, before and after the storm. In order to construct the figure, we first estimated a regression of birth weight on maternal characteristics using the sample of Texas children born within 100 km of a storm track in periods without a major storm.8 We then use the estimated beta coefficients to predict birth weight in the actual populations of women in the affected areas (within 30 km of a storm track) before and after the storms. Because we use fixed betas, the predicted values summarize changes in the characteristics of women in the affected areas. Figure 2 shows that mean predicted birth weight was declining prior to the storms in areas within 30 km of a hurricane path. This mirrors the general trend in birth weight in areas outside hurricane paths.9 However, after the storms (all normalized to time zero in the graph), the predicted birth weight actually increases, suggesting an improvement in maternal characteristics in these areas.
Figure 2. Predicted Birth Weight by Quarters from Hurricane Occurrence.

Notes: See notes under Table 1 for more information on the main sample of analysis. The sample is limited to births within a 30km radius of any hurricane path. This figure plots average predicted birth weight by number of quarters between the birth and storm/hurricane occurrence. Birth weight is predicted using an OLS model on a base sample that excludes hurricane time periods (only the following time periods are included in the base sample: 1/1996–7/1998, 9/2000–5/2001, 7/2002–6/2003, 8/2004–8/2005, 10/2005–6/2008). The following covariates are included in the prediction model: mother’s race, mother’s age, mother’s education, mother’s marital status, birth parity, and conception month indicators.
This result suggests that changes in the composition of mothers in affected counties could cause us to underestimate the negative effects of a storm on infant health outcomes, and provides an important reason to control for maternal fixed effects. Still, mother fixed effects are not a panacea since maternal location determines hurricane exposure, and can change over time: the decision of whether to move (or not) between pregnancies could itself be a response to hurricane exposure and could influence birth outcomes.
In order to deal with the endogeneity of maternal location, we adopt a mother fixed effects-instrumental variables model. Specifically, we consider the residential location during each mother’s first pregnancy that we observe. Then, for each subsequent pregnancy, we create a variable that measures the child’s prenatal exposure to the hurricane as though the mother had remained in her first reported pregnancy residence. That is, we measure the hypothetical exposure the mother would have experienced during each trimester of pregnancy as if she had never moved. We use these hypothetical variables to instrument for the actual HUR_1triikym, HUR_2triikym, and HUR_3triikym variables constructed using information on the mother’s actual place of residence during each of her pregnancies. We then estimate a second-stage equation of the form:
| (3) |
with corresponding first stage equations:
| (4) |
| (5) |
| (6) |
for each child i, borne by mother k, in year y, and month m. FST_HUR_1triikym is an indicator equal to 1 if a hurricane or storm occurred within 30 kilometers of i’s mother’s first-pregnancy home during her 1st trimester of pregnancy with child i, and 0 otherwise. FST_HUR_2triikym and FST_HUR_3triikym are similar indicators for 2nd and 3rd trimesters. Yikym is an outcome of interest such as birth weight or an indicator for any complications during labor/delivery. Here, Xikym would include indicators for mother’s age groups (<20, 20–24, 25–34, 35–44, 45+), mother’s education groups (<HS, HS, some college, college+, missing), mother’s marital status, birth order (first, second, third, fourth or higher), and an indicator for living within 30km of an area that was ever affected by a storm or a hurricane over the time period of analysis, and the mother fixed effect would be indicated by αk. Standard errors are clustered at the mother level. We have also estimated all of our models clustering at the county level, and found that this produces estimates with somewhat smaller standard errors. Although it did not change inference in any case, we elected to report the more conservative standard errors below.
The idea underlying our estimator is that while the mother’s current pregnancy residence is potentially endogenous, her residence during her first pregnancy is controlled for by the inclusion of mother fixed effects. Exposure to the hurricane is then identified only by the timing of natural disaster occurrences, which should be exogenous to any particular mother. Thus, the instruments FST_HUR_1triikym, FST_HUR_2triikym, and FST_HUR_3triikym should satisfy the requirements for being valid instruments. They are highly predictive of HUR_1triikym, HUR_2triikym, and HUR_3triikym (since most mothers do not move between pregnancies) and they should not have any direct effect on birth outcomes other than through their effects on the likelihood of each child’s prenatal exposure to a hurricane.
A second problem we address has to do with whether one should measure exposure backwards from the date of birth, or forwards from the date of conception. If all children had nine months of gestation, then this distinction would not matter. However, as discussed above, 8% of sample children are born prematurely. For premature infants, counting backwards nine months will increase the probability that they are measured as being exposed during the third trimester, and will induce measurement error into the assignment of exposure in the second trimester.10
Counting forwards from conception does not completely overcome another problem, which is that children who have longer gestations are mechanically more likely to be exposed to a hurricane at some point during the pregnancy. In turn, children with longer gestations are likely to have higher birth weight and better outcomes.
To address this mechanical correlation, we modify our procedure for constructing the instrumental variables slightly, and calculate measures of the exposure that would have occurred during each pregnancy if the woman had stayed in the same place as we first observe her and each pregnancy had lasted exactly 39 weeks. These instruments are not affected either by endogenous mobility or by gestation length and can be used to correct for both problems.11
Results
Table 4 presents various estimates of the effects of hurricane exposure on birth outcomes. Following much of the literature, the first panel shows OLS models in which exposure is calculated by counting backwards from the date of the birth. Consistent with the literature, these models suggest that exposure in the third trimester significantly increases the risk of low birth weight. For example, the estimate in the first column suggests that exposure in the third trimester results in a 1.5 percentage point increase in the probability of low birth weight on a baseline of 5.3%. This is a large effect, but one that is in line with previous studies that used similar methods. Exposure in the third trimester is also estimated to increase the probability that there are complications of labor and delivery, and of abnormal conditions in the newborn. There seems to be little estimated effect of earlier exposure.
Table 4.
Effects of Hurricane Within 30km on Birth Outcomes - Different Estimators
| Low Birth Weight (<2500g) | Gestation (weeks) | Any Abnormal Conditions (1996–2004) | Any Complications of Labor/Delivery (1996–2004) | |
|---|---|---|---|---|
| A. OLS with County Fixed Effects - Counting Backward from the Birth Date to Estimate Exposure | ||||
|
| ||||
| Hurricane 1st Trimester | −0.0020 (0.0045) | −0.0225 (0.0484) | 0.0175 (0.0185) | −0.0019 (0.0102) |
| Hurricane 2nd Trimester | −0.0038 (0.0069) | −0.0102 (0.0578) | 0.0152 (0.0167) | 0.0128 (0.0175) |
| Hurricane 3rd Trimester | 0.0155** (0.0060) | −0.1047 (0.0821) | 0.0400** (0.0121) | 0.0266*** (0.0064) |
|
| ||||
| B. OLS with County Fixed Effects - Counting Forward from Conception to Estimate Exposure | ||||
|
| ||||
| Hurricane 1st Trimester | −0.0076 (0.0050) | 0.0108 (0.0635) | 0.0115 (0.0219) | −0.0003 (0.0075) |
| Hurricane 2nd Trimester | 0.0031 (0.0081) | −0.1142** (0.0496) | 0.0228 (0.0148) | 0.0141 (0.0159) |
| Hurricane 3rd Trimester | −0.0004 (0.0057) | 0.1613** (0.0516) | 0.0346*** (0.0093) | 0.0183** (0.0090) |
|
| ||||
| C. IV with Mother Fixed Effects - Counting Forward from Conception to Estimate Exposure | ||||
|
| ||||
| Hurricane 1st Trimester | −0.0021 (0.0100) | −0.0378 (0.0703) | 0.0363** (0.0137) | 0.0213 (0.0195) |
| Hurricane 2nd Trimester | −0.0022 (0.0093) | −0.0424 (0.0687) | 0.0136 (0.0142) | 0.0237 (0.0193) |
| Hurricane 3rd Trimester | 0.0005 (0.0089) | 0.1210** (0.0578) | 0.0341** (0.0136) | 0.0448** (0.0184) |
|
| ||||
| D. IV with Mother Fixed Effects - Full Term Gestation Exposure Instrument | ||||
|
| ||||
| Hurricane 1st Trimester | −0.0021 (0.0100) | −0.0378 (0.0703) | 0.0363** (0.0137) | 0.0213 (0.0195) |
| Hurricane 2nd Trimester | −0.0021 (0.0093) | −0.0433 (0.0687) | 0.0136 (0.0142) | 0.0237 (0.0193) |
| Hurricane 3rd Trimester | 0.0089 (0.0100) | −0.0431 (0.0649) | 0.0389** (0.0147) | 0.0409** (0.0196) |
|
| ||||
| E. IV with Mother Fixed Effects - Full Term Gestation Exposure Instrument | ||||
|
| ||||
| Hurricane Any Time During Pregnancy | 0.0020 (0.0057) | −0.0416 (0.0392) | 0.0291*** (0.0083) | 0.0287** (0.0113) |
|
| ||||
| F. IV with Mother Fixed Effects - Placebo Models | ||||
|
| ||||
| Hurricane 6 mo. After Birth | −0.0114 (0.0080) | 0.0748 (0.0554) | 0.0107 (0.0124) | −0.0099 (0.0177) |
|
| ||||
| N | 485,048 | 485,111 | 301,683 | 301,683 |
Notes: Each column in each panel is a separate regression. See notes under Table 1 for information on the sample. For each outcome, births by mothers who have at most one child with non-missing data for that outcome are omitted. In Panels A and B, exposure to the storm or hurricane is calculated by counting trimesters backward from the child’s date of birth. In all the other panels, exposure to the storm or hurricane is calculated by counting trimesters forward from the date of conception.
Panels A and C present results from OLS regressions that include controls for mother’s race (non-Hispanic white, black, Hispanic, Hispanic missing), mother’s age (<20, 20–24, 25–34, 35–44, 45+), mother’s education (<HS, HS, some college, college+, missing), mother’s marital status (married, not married, marital status missing), birth order, as well as conception year, conception month, and county fixed effects, and an indicator for living within 30km of an area that was ever affected by a storm or hurricane over the time period of analysis. Robust standard errors in Panels A and C are clustered on the county level. Panels B, D, E, F, and G present results from regressions with mother fixed effects where the key coefficients of interest are instrumented by indicators for a storm/hurricane at the time of the current pregnancy within a 30km radius of the mother’s first pregnancy residence. Additionally, the instrument in Panels E and F (“Full term Gestation Exposure Instrument”) assumes that the pregnancy lasts 39 weeks. These regressions include time-varying controls for mother’s age, mother’s education, mother’s marital status, birth order, as well as conception year and conception month fixed effects, and an indicator for living within 30km of an area that was ever affected by a storm or hurricane over the time period of analysis. Robust standard errors in Panels B, D, E, F, and G are clustered on the mother.
Significance levels:
p<0.10
p<0.05
p<0.001
The second panel of Table 4 shows OLS estimates in which exposure is assessed on the basis of counting forward from the date of conception. The effect of making this seemingly small improvement in measurement is startling. There is no longer any estimated effect of exposure on low birth weight. The effects on gestation are negative for the second trimester, but positive for the third trimester, implying that the mechanical correlation between gestation and hurricane exposure is an issue. The estimated effects of exposure on abnormal conditions and complications of labor and delivery are similar to Panel A.
Panel C of Table 4 shows models estimated using mother fixed effects and the instrumental variable defined using the exposure the woman would have experienced had she stayed in her first location. The first stage regressions are shown in Appendix Table 1.12 Clearly the instruments are quite predictive.
Appendix Table 1.
First Stage, Mother Fixed Effects - Calculating from Conception Date to Estimate Exposure; Full-Term Gestation Instrument
| Hurricane During Pregnancy | Hurricane During 1st Trimester | Hurricane During 2nd Trimester | Hurricane During 3rd Trimester | |
|---|---|---|---|---|
| Hurricane within 30km of FIRST Birth Residence During CURRENT Pregnancy Assuming Full-Term Gestation
|
0.8740*** (0.0076) | |||
| Hurricane within 30km of FIRST Birth Residence During 1st Trimester CURRENT Pregnancy Assuming Full-Term Gestation
|
0.8978*** (0.0136) | |||
| Hurricane within 30km of FIRST Birth Residence During 2nd Trimester CURRENT Pregnancy Assuming Full-Term Gestation
|
0.9015*** (0.0123) | |||
| Hurricane within 30km of FIRST Birth Residence During 3rd Trimester CURRENT Pregnancy Assuming Full-Term Gestation | 0.8334*** (0.0140) | |||
|
| ||||
| N | 485,111 | 485,111 | 485,111 | 485,111 |
| R-Squared | 0.8653 | 0.8828 | 0.8829 | 0.8310 |
Notes: Each coefficient is from a separate regression. See notes under Tables 1 for information on the sample. All regressions include include time-varying controls for mother’s age, education, marital status, and child’s birth order, conception year and conception month, and an indicator for living within 30km of an area that was ever affected by a storm or hurricane over the time period. Robust standard errors are clustered on the mother.
Significance levels:
p<0.10
p<0.05
p<0.001
The results in Panel C are similar to Panel B except that now first trimester exposure is also estimated to increase abnormal conditions, and the negative effect of second trimester exposure on gestation is no longer statistically significant. The positive effect of third trimester exposure on gestation remains – as we show in the next panel, this counterintuitive finding is an artifact of the mechanical correlation between gestation and the probability of being exposed.
Our preferred estimates are shown in Panel D of Table 4. In addition to properly measuring exposure, dealing with omitted maternal characteristics, and dealing with maternal mobility, these estimates address the mechanical correlation problem by modifying our instrument as described above. There is no longer any statistically significant effect, positive or negative, of exposure on low birth weight or gestation. However, exposure in the first and third trimester is associated with increases in abnormal conditions, and exposure in the third trimester increases complications of labor and delivery.
In summary, the estimated effects of exposure on abnormal conditions and complications of labor and delivery are extremely robust to estimation method. In contrast, the effects on birthweight and gestation are sensitive to estimation method, and are not present when our preferred estimation method is used.
Placebo Test
The last panel of Table 4 presents a “placebo test” in which we examine the “effect” of hurricanes that occurred after the birth on outcomes. Events after the birth can have no causal effect on birth outcomes, but if the estimated effects of hurricanes during pregnancy reflected an omitted variable or a trend in outcomes, then we might well find significant estimates in these placebo regressions. The placebo test confirms that we find no effects of hurricanes after the birth on any of our outcomes.
Effects on Delivery of Medical Services
The estimates so far suggest that hurricanes during pregnancy have significant effects on abnormal conditions of the newborn and on complications of labor and delivery. In contrast, the estimated effects on low birth weight are sensitive to controlling for unobserved characteristics and maternal mobility, and effects on gestation are generated by a mechanical correlation between the length of the pregnancy and the probability of exposure.
One question that arises is whether the effects that we find on complications and abnormal conditions are driven by events that took place right around the time of the birth. For example, if a hurricane disrupted medical services, then it is possible that this might have an adverse effect on the delivery and on the condition of the newborn.
This possibility is investigated in Table 5. In the first 2 columns of Table 5, we focus on whether a hurricane took place in the last month of the pregnancy. These results are inconclusive as we find do not find any significant effect of a hurricane in the last month on either abnormal conditions of the newborn or complications of labor and delivery, but the coefficient estimates are similar in magnitude to those in Table 4..
Table 5.
Effects of Hurricanes in Last Month of Delivery And Controlling for Method of Delivery
| Any Abnormal Conditions of Newborn (1996–2004) | Any Complications of Labor/Delivery (1996–2004) | Any Abnormal Conditions of Newborn (1996–2004) | Any Complications of Labor/Delivery (1996–2004) | |
|---|---|---|---|---|
| A. IV with Mother Fixed Effects, Full Term Gestation Exposure Instrument | ||||
|
| ||||
| Hurricane within 30km, Last Month of Pregnancy | 0.0379 (0.0316) | 0.0304 (0.0447) | ||
| Hurricane 1st Trimester | 0.0364** (0.0137) | 0.0231 (0.0191) | ||
| Hurricane 2nd Trimester | 0.0134 (0.0142) | 0.0212 (0.0192) | ||
| Hurricane 3rd Trimester | 0.0390** (0.0147) | 0.0415** (0.0191) | ||
| Labor was Induced | 0.0001 (0.0015) | 0.0251*** (0.0023) | ||
| C-Section Delivery | 0.0263*** (0.0026) | 0.2829*** (0.0043) | ||
|
| ||||
| N | 301,683 | 301,683 | 301,683 | 301,683 |
Notes: Each column is a separate regression. See notes under Tables 1 and 4 for information about the sample, the storms and hurricanes, and the estimation methods and controls. For each outcome, births by mothers who have at most one child with non-missing data for that outcome are omitted. All regressions include controls for mother’s age, education, marital status, and child’s birth order, and conception year and conception month fixed effects, and an indicator for living within 30km of an area that was ever affected by a storm or hurricane over the time period of analysis. Robust standard errors are clustered on the mother.
Significance levels:
p<0.10
p<0.05
p<0.001
Hence, we look more directly at whether delivery care accounts for the effects on abnormal conditions and complications. The last two columns of Table 5 show estimates of models similar to those in Table 4 for abnormal conditions and complications of labor and delivery except that we also control for whether labor was induced and for whether there was a C-section. If for example, women were more likely to be induced or to have a C-section prior to a storm, this might explain some of the negative effect on infant health. Alternatively, if women who needed C-sections were less likely to get them, this could also have a deleterious effect on infant health outcomes. However, the estimated effects of exposure are remarkably similar to those shown in Table 4. These results suggest that the estimated effects of hurricanes on abnormal conditions of the newborn do not appear to be driven by disruptions or changes in the medical care obtained during labor and delivery.
Further Analysis of Abnormal Conditions
Given that we find a very robust effect of hurricane exposure on complications of labor and delivery and abnormal conditions of the newborn, it is worth looking further and examining the specific types of conditions that are affected. This exercise is especially interesting given the great need for sensitive indicators of infant health at birth. Table 6 investigates the effects of a hurricane during pregnancy on specific abnormal conditions and on complications. The estimates suggest that hurricane exposure has a significant effect on meconium staining of amniotic fluid during delivery, which in turn leads to a higher probability that the baby will breathe in meconium and suffer from meconium aspiration syndrome. Meconium release is related to fetal distress and specifically to MAS, as described above.
Table 6.
Effects of Hurricanes on the Most Common Abnormal Conditions and Complications of Labor/Delivery
| Abnormal Conditions of Newborn | Complications of Labor/Delivery | ||||||
|---|---|---|---|---|---|---|---|
|
| |||||||
| Any Assisted Ventilation | Meconium Aspiration Syndrome | Assisted Ventilation: 30+ min | Arterial Blood Gas pH<7.2 | Moderate/Heavy Meconium Staining of Amniotic Fluid | Dysfunctional Labor | Breech/Malpresentation | |
| A. IV with Mother Fixed Effects, Full -Term Gestation Exposure Instrument | |||||||
|
| |||||||
| Hurricane 1st Trimester | 0.0073 (0.0101) | 0.0136** (0.0064) | 0.0150** (0.0064) | 0.0165** (0.0072) | 0.0137 (0.0116) | 0.0144** (0.0069) | 0.0080 (0.0088) |
| Hurricane 2nd Trimester | −0.0249** (0.0108) | 0.0326*** (0.0078) | 0.0098 (0.0061) | 0.0061 (0.0064) | 0.0239** (0.0119) | 0.0053 (0.0059) | −0.0076 (0.0084) |
| Hurricane 3rd Trimester | −0.0111 (0.0106) | 0.0369*** (0.0091) | 0.0133** (0.0053) | 0.0102 (0.0069) | 0.0299** (0.0132) | −0.0022 (0.0056) | 0.0161** (0.0081) |
|
| |||||||
| N | 301,683 | 301,683 | 301,683 | 301,683 | 301,683 | 301,683 | 301,683 |
Notes: Each column is from a separate regression. These regressions are estimated using data through 2004 only. See notes under Tables 1 and 4 for information about the sample, the storms and hurricanes, and the estimation methods and controls. For each outcome, births by mothers who have at most one child with non-missing data for that outcome are omitted.
Significance levels:
p<0.10
p<0.05
p<0.001
We also find that newborns exposed in either the first or the second trimester are more likely to be on assisted ventilation for longer than 30 minutes. Babies exposed during the first trimester are also more likely to suffer from dysfunctional labor, and arterial blood gas pH less than 7.2. This latter condition is an indicator of inadequate respiratory function. Babies exposed during the third trimester have a higher probability of breech presentation, which is sometimes caused by inadequate or excessive levels of amniotic fluid. Finally, we find a negative effect of exposure in the second trimester on the probability of receiving any assisted ventilation although exposure in the second trimester has no effect on the probability of receiving ventilation more than 30 minutes. This result might reflect some rationing of ventilation to infants with less severe respiratory problems in the wake of a hurricane.13
Effects on Maternal Behavior
Table 7 turns to an investigation of behavioral mechanisms that might underlie our results. It is possible that exposure to hurricanes affects birth outcomes not by inducing stress per se, but by altering maternal behavior. For example, mothers experiencing the stress of hurricane may smoke more or have negative changes in their diets. Their receipt of prenatal care may also be disrupted. Table 7 suggests that women exposed in the first trimester are actually less likely to gain an excessive amount of weight or to have inadequate prenatal care. Women exposed in the second trimester are more likely to smoke, and exposure in the second trimester is associated with a higher probability of MAS, but exposure in the first and third trimesters are also associated with MAS and we do not see that exposure in those trimesters increases smoking. Overall then, we see little effect of exposures on behaviors, and those effects we do find do not match well with the patterns of health effects. These findings support the idea that the effects we find are actually due to stress.
Table 7.
Possible Mechanisms for the Effects of Hurricanes
| Mother Smoked During Pregnancy | Number Cigarettes Smoked | Weight Gain <16 lbs | Weight Gain > 60 lbs | Mother is Married | Number Prenatal Visits | Number Prenatal Visits >7 | Adequate Prenatal Care (Kessner Index) | |
|---|---|---|---|---|---|---|---|---|
| A. IV with Mother Fixed Effects, Full -Term Gestation Exposure Instrument | ||||||||
|
| ||||||||
| Hurricane 1st Trimester | 0.0100 (0.0102) | −0.0937 (0.1186) | −0.0071 (0.0156) | −0.0161** (0.0080) | −0.0000 (0.0000) | 0.1415 (0.1780) | 0.0364** (0.0152) | 0.0372** (0.0172) |
| Hurricane 2nd Trimester | 0.0202** (0.0091) | 0.1073 (0.0823) | 0.0083 (0.0141) | 0.0008 (0.0065) | −0.0000 (0.0000) | 0.1162 (0.1474) | 0.0203 (0.0133) | 0.0224 (0.0155) |
| Hurricane 3rd Trimester | −0.0041 (0.0089) | 0.0061 (0.1069) | −0.0252+ (0.0131) | −0.0141+ (0.0076) | −0.0000 (0.0000) | 0.0038 (0.1557) | −0.0122 (0.0143) | −0.0025 (0.0164) |
|
| ||||||||
| N | 482,248 | 476,743 | 412,705 | 412,705 | 485,111 | 457,999 | 457,999 | 485,111 |
Notes: Each column is from a separate regression. See notes under Tables 1 and 4 for information about the sample, the storms and hurricanes, and the estimation methods and controls. For each outcome, births by mothers who have at most one child with non-missing data for that outcome are omitted.
Significance levels:
p<0.10
p<0.05
p<0.001
Robustness
One potential concern with this analysis is that there are many possible measures of infant and maternal health available in the natality data. This issue is explored in Appendix Table 2, in which we report estimates for summary indices constructed following Kling, Liebman, and Katz (2007). The aggregation improves statistical power to detect treatment effects that go in the same direction. We constructed three different indices: 1) the birth weight/gestation index which includes continuous birth weight, indicator for low birth weight, continuous gestation, indicator for premature birth, and an indicator for Small-for-Gestational-Age (<25th percentile); 2) the abnormal conditions index consisting of indicators for any assisted ventilation, assisted ventilation for 30+ minutes, seizures, anemia, fetal alcohol syndrome, meconium aspiration syndrome, hyaline membrane disease, arterial blood gas pH<7.2, and sepsis; And 3) the maternal complications index consisting of indicators for c-section, induced labor, moderate/heavy meconium staining of amniotic fluid, premature rupture of membranes, precipitous labor (<3hrs), prolonged labor (>20hrs), breech/malpresentation, labor febrile, abruptio placenta, placenta previa, excessive bleeding, seizures, dysfunctional labor, cord prolapse, cephalopelvic disproportion. To construct each index, we first standardize every component variable by subtracting the mean and dividing by the standard deviation (which are calculated on the sample of births whose mothers did not experience a hurricane during pregnancy), and then taking a non-weighted average of the normalized components. For ease of comparison, the table shows estimates obtained using these indices together with estimates from our “any abnormal conditions” and “any complications” measures. The table shows that the results are quite similar when we use the Kling, Liebman, and Katz (2007) indices. We still see no effect for the birth weight/gestation index, whereas we do see effects of hurricane exposure on the abnormal conditions and complications indices.
Appendix Table 2.
Mother and Child Health Indices - IV-Mother Fixed Effects, Full-term Gestation Instrument
| Birth Weight/Gestation Index | Abnormal Conditions Index | Indicator for Any Abnormal Conditions | Maternal Complications Index | Indicator for Any C-section, Induced Labor, or Complications of Labor/Delivery | |
|---|---|---|---|---|---|
| Hurricane within 30km During 1st Trimester
|
0.0056 (0.0298) | 0.0693** (0.0230) | 0.0363** (0.0137) | 0.0034 (0.0151) | −0.0144 (0.0221) |
| Hurricane within 30km During 2nd Trimester
|
−0.0050 (0.0291) | 0.0699** (0.0246) | 0.0136 (0.0142) | 0.0096 (0.0141) | 0.0041 (0.0206) |
| Hurricane within 30km During 3rd Trimester | 0.0214 (0.0292) | 0.1212*** (0.0313) | 0.0389** (0.0147) | 0.0037 (0.0135) | 0.0141 (0.0216) |
|
| |||||
| N | 485,048 | 301,683 | 301,683 | 301,683 | 301,683 |
Notes: Each column is from a separate regression. The indices are constructed following Kling, Liebman, and Katz (2007). The birth weight/gestation index includes continuous birth weight, indicator for low birth weight, continuous gestation, indicator for premature birth, and an indicator for SGA (<25th percentile). The abnormal conditions index consists of indicators for any assisted ventilation, assisted ventilation for 30+ min, seizures, anemia, fetal alcohol syndrome, meconium aspiration syndrome, hyaline membrane disease, arterial blood gas pH<7.2, and sepsis. The maternal complications index consists of indicators for c-section, induced labor, moderate/heavy meconium staining of amniotic fluid, premature rupture of membranes, precipitous labor (<3hrs), prolonged labor (>20hrs), breech/malpresentation, labor febrile, abruptio placenta, placenta previa, excessive bleeding, seizures, dysfunctional labor, cord prolapse, cephalopelvic disproportion. To construct the index, each variable is standardized by subtracting the mean and dividing by the standard deviation (which are calculated on the sample of births whose mothers did not experience a hurricane during pregnancy). Indices are calculated as the non-weighted average of the normalized components.
See notes under Tables 1 and 4 for information about the sample, the storms and hurricanes, and the estimation methods and controls. For each outcome, births by mothers who have at most one child with non-missing data for that outcome are omitted.
Significance levels:
p<0.10
p<0.05
p<0.001
A second issue has to do with the 30 km radius we have chosen for measuring exposure, and with whether we can incorporate wind speed into our analysis. Appendix Table 3 shows, in Panels A and C, the effects of estimating our models with different radii. Panel A shows that the estimated effects on abnormal conditions are slightly larger at 25km, but have become statistically insignificant by 60km. The effects of exposure on complications of labor and delivery die out more slowly and are still present (though much reduced) at 75km. We conclude that while the 30km radius is somewhat arbitrary, varying the cutoff somewhat around 30km would have little effect on our qualitative results.
Appendix Table 3.
Different Distance Cutoffs and Interactions with Wind Speed
| Low Birth Weight (<2500g) | Gestation (weeks) | Any Abnormal Conditions (1996–2004) | Any Complications of Labor (1996–2004) | Low Birth Weight (<2500g) | Gestation (weeks) | Any Abnormal Conditions (1996–2004) | Any Complications of Labor (1996–2004) | |
|---|---|---|---|---|---|---|---|---|
| A. Different Distance Cutoffs | X = 25 KM | X = 30 KM | ||||||
|
| ||||||||
| Hurricane within X km During 1st Trimester | −0.0047 (0.0131) | 0.0281 (0.0882) | 0.0414** (0.0165) | 0.0201 (0.0240) | −0.0021 (0.0100) | −0.0378 (0.0703) | 0.0363** (0.0137) | 0.0213 (0.0195) |
| Hurricane within X km During 2nd Trimester | −0.0049 (0.0125) | −0.0153 (0.0917) | 0.0003 (0.0178) | 0.0142 (0.0231) | −0.0021 (0.0093) | −0.0433 (0.0687) | 0.0136 (0.0142) | 0.0237 (0.0193) |
| Hurricane within X km During 3rd Trimester | 0.0054 (0.0125) | −0.1201 (0.0808) | 0.0363+ (0.0187) | 0.0485+ (0.0248) | 0.0089 (0.0100) | −0.0431 (0.0649) | 0.0389** (0.0147) | 0.0409** (0.0196) |
|
| ||||||||
| B. Interactions with Maximum Wind Speed | ||||||||
| Max Wind Speed * Hurricane within X km, 1st Trimester
|
−0.0007 (0.0017) | 0.0067 (0.0109) | 0.0059** (0.0024) | 0.0027 (0.0035) | −0.0006 (0.0013) | −0.0013 (0.0087) | 0.0054** (0.0020) | 0.0030 (0.0028) |
| Max Wind Speed * Hurricane within X km, 2nd Trimester
|
−0.0002 (0.0015) | −0.0077 (0.0126) | 0.0003 (0.0027) | 0.0015 (0.0035) | 0.0002 (0.0012) | −0.0105 (0.0094) | 0.0022 (0.0021) | 0.0032 (0.0029) |
| Max Wind Speed * Hurricane within X km, 3rd Trimester | −0.0001 (0.0014) | −0.0148 (0.0098) | 0.0052+ (0.0027) | 0.0076** (0.0037) | 0.0008 (0.0012) | −0.0027 (0.0076) | 0.0056** (0.0022) | 0.0065** (0.0029) |
|
| ||||||||
| C. Different Distance Cutoffs | X = 60 KM | X = 75 KM | ||||||
|
| ||||||||
| Hurricane within X km During 1st Trimester
|
−0.0037 (0.0041) | −0.0497+ (0.0298) | 0.0050 (0.0051) | 0.0195** (0.0080) | −0.0035 (0.0034) | −0.0327 (0.0252) | 0.0035 (0.0041) | 0.0115+ (0.0067) |
| Hurricane within X km During 2nd Trimester
|
−0.0004 (0.0039) | −0.0173 (0.0276) | 0.0090+ (0.0053) | 0.0112 (0.0078) | 0.0004 (0.0032) | −0.0264 (0.0224) | 0.0066 (0.0041) | 0.0088 (0.0063) |
| Hurricane within X km During 3rd Trimester | 0.0006 (0.0039) | 0.0063 (0.0270) | 0.0041 (0.0054) | 0.0264** (0.0083) | −0.0023 (0.0032) | 0.0191 (0.0228) | −0.0016 (0.0042) | 0.0154** (0.0068) |
|
| ||||||||
| D. Interactions with Maximum Wind Speed | ||||||||
|
| ||||||||
| Max Wind Speed * Hurricane within X km, 1st Trimester
|
−0.0002 (0.0005) | −0.0055 (0.0036) | 0.0008 (0.0008) | 0.0024** (0.0012) | −0.0001 (0.0004) | −0.0032 (0.0029) | 0.0004 (0.0005) | 0.0009 (0.0009) |
| Max Wind Speed * Hurricane within X km, 2nd Trimester
|
0.0003 (0.0005) | −0.0053+ (0.0032) | 0.0014+ (0.0008) | 0.0012 (0.0012) | 0.0003 (0.0004) | −0.0058** (0.0024) | 0.0006 (0.0005) | 0.0005 (0.0008) |
| Max Wind Speed * Hurricane within X km, 3rd Trimester | −0.0001 (0.0004) | 0.0026 (0.0027) | 0.0006 (0.0008) | 0.0038** (0.0013) | −0.0003 (0.0003) | 0.0023 (0.0022) | −0.0004 (0.0005) | 0.0011 (0.0008) |
|
| ||||||||
| N | 485,048 | 485,111 | 301,683 | 301,683 | 485,048 | 485,111 | 301,683 | 301,683 |
Notes: Each column in each panel is a separate regression. See notes under Tables 1 and 4 for information about the sample, the storms and hurricanes, and the estimation methods and controls. Maximum wind speed is in tens of miles per hour. The maximum wind speeds are: 60 mph for Allison, 145 mph for Bret, 70 mph for Charley, 85 mph for Claudette, 100 mph for Dolly, 65 mph for Frances, 145 mph for Ike, and 180 mph for Rita. For each outcome, births by mothers who have at most one child with non-missing data for that outcome are omitted.
Significance levels:
p<0.10
p<0.05
p<0.001
In principle, we could sidestep the question about the optimal “bandwidth” by using actual data on the wind speeds people in different locations were exposed to for each storm, as in Yang (2008), Hsiang (2010), and Strobl (2012). The problem with the measures used by Yang and Strobl for our purposes is that they are not based on measures of wind speed at a fine level of geography. Instead, they are the product of models intended to interpolate and smooth out wind speed measures from widely dispersed monitoring stations. This approach is fine for the purposes of Yang, Hsiang, and Strobl who intend to compare the impact of storms that hit different countries, but it is not very useful for comparing affected and unaffected mothers who might live in the same county. For example, we find that about half of the mothers directly in the path of the hurricane have a zero wind speed index using the Yang index, which does not seem credible. Moreover, because the measures are so smoothed, they cannot be used to determine the actual width of the storm.
Since the Weather Underground archive includes information about maximum wind speed for each storm we have used this information to estimate alternative models that interact maximum wind speed with indicators for being within different distance radii (25, 30, 60, and 75 km). These estimates are shown in Panels B and D of Appendix Table 3. The estimated effects again suggest that 30km is a reasonable “bandwidth” for the storms. The estimated effects are consistent with those of previous models. For example, they suggest that exposure to a wind speed of 70 miles per hour within 30km of the storm path in the first trimester would increase the probability of abnormal conditions by .038 percentage points.
The estimated effects of hurricane exposure on abnormal conditions are robust to several other changes in specification. In the first panel of Appendix Table 4, we show estimates from models using our “full-term gestation” instrument, and exclude mothers living in the large cities of Houston and Dallas. These estimates can be compared to those in Panel D of Table 4. While this exclusion cuts the sample size somewhat, the estimates are very similar to those in the main specifications. Since one might expect urban and rural mothers to be differentially affected by disruptions to medical care in the wake of a storm, this result further supports our hypothesis that the effects we see are due to stress itself rather than other effects of the storm.
Appendix Table 4.
Robustness - IV-Mother Fixed Effects, Full-term Gestation Instrument
| Low Birth Weight (<2500g) | Gestation (weeks) | Any Abnormal Conditions of Newborn (1996–2004) | Any Complications of Labor or Delivery (1996–2004) | |
|---|---|---|---|---|
| A. Excluding Large Cities (Houston and Dallas) | ||||
|
| ||||
| Hurricane within 30km During 1st Trimester
|
−0.0003 (0.0100) | −0.0427 (0.0692) | 0.0360** (0.0136) | 0.0200 (0.0193) |
| Hurricane within 30km During 2nd Trimester
|
−0.0008 (0.0092) | −0.0355 (0.0685) | 0.0180 (0.0143) | 0.0250 (0.0194) |
| Hurricane within 30km During 3rd Trimester | 0.0089 (0.0100) | −0.0335 (0.0645) | 0.0416** (0.0147) | 0.0391** (0.0197) |
|
| ||||
| N | 303,896 | 303,946 | 187,319 | 187,319 |
|
| ||||
| B. Mothers with No Risk Factors During Any Pregnancy | ||||
|
| ||||
| Hurricane within 30km During 1st Trimester
|
−0.0087 (0.0100) | −0.0378 (0.0723) | 0.0392** (0.0147) | 0.0113 (0.0213) |
| Hurricane within 30km During 2nd Trimester
|
0.0061 (0.0098) | −0.0863 (0.0721) | 0.0104 (0.0157) | 0.0205 (0.0207) |
| Hurricane within 30km During 3rd Trimester | 0.0190+ (0.0106) | −0.0432 (0.0680) | 0.0377** (0.0155) | 0.0411+ (0.0210) |
|
| ||||
| C. Models Interacting Exposure with Presence of a WIC Clinic | ||||
|
| ||||
| Hurricane within 30km During Pregnancy | 0.0010 (0.0079) | −0.0572 (0.0555) | 0.0252** (0.0117) | 0.0310** (0.0154) |
| WIC Clinic in Zip Code * Hurricane within 30km During Pregnancy | 0.0020 (0.0113) | 0.0310 (0.0779) | 0.0078 (0.0164) | −0.0044 (0.0224) |
|
| ||||
| N | 485,048 | 485,111 | 301,683 | 301,683 |
Notes: Each column is from a separate regression. In panel A, mothers residing in Austin, Dallas, Houston, and San Antonio are omitted. In panel B, mothers with risk factors are omitted. In Panel C the WIC interaction indicates that there was a clinic operating in the zip code at some point during the mother’s pregnancy. See notes under Tables 1 and 4 for information about the sample, the storms and hurricanes, and the estimation methods and controls. For each outcome, births by mothers who have at most one child with non-missing data for that outcome are omitted.
Significance levels:
p<0.10
p<0.05
p<0.001
In the second panel of Appendix Table 4, we ask whether the estimates we have presented are driven by mothers with pregnancy risk factors such as high blood pressure, diabetes, or previous pre-term deliveries. It is possible that stress added to high risk has greater effects than stress alone. We dropped mothers with a risk factor for any pregnancy, past or current. We find similar estimates to those reported in the Panel D of Table 4, suggesting that hurricanes have harmful effects whether or not the mother has known risk factors. In fact, we also find a marginally significant positive effect of exposure in the third trimester on the probability of low birth weight in the population of women without risk factors.
The third panel of Appendix Table 4 shows models that interact hurricane exposure with whether a WIC (Special Supplemental Nutrition Program for Women, Infants, and Children) clinic was operating in the woman’s zip code during the pregnancy.14 The table offers a crude way to see whether supportive programs for pregnant women mitigate the effects of hurricane exposure. We do not find that this makes much of a difference in terms of abnormal conditions of the newborn or complications of labor and delivery.
In models that are not shown, we also asked whether the effects of hurricanes were larger for disadvantaged mothers. We split the sample and considered mothers who were unmarried, less than 20 years old, or without a high school education during any of their pregnancies as “disadvantaged”. These estimates were not generally significantly different than those presented in the main results. We also investigated interactions between hurricane exposure and race, gender, and birth order. We found no conclusive evidence that the effects differed with these characteristics. While these results may seem surprising, a possible interpretation is that they support the hypothesis that the effects we find are due to stress. We expect more disadvantaged mothers to have different responses to storms in terms of migration behavior, access to medical care, and perhaps maternal behaviors, but they may not necessarily find the storm or its aftermath more stressful.15
Conclusions
There is a growing literature suggesting that stressful events in pregnancy can have negative effects on birth outcomes. Some of the estimates in this literature may be affected by small samples, omitted variables, endogenous mobility in response to disasters, and errors in the measurement of gestation, as well as by a mechanical correlation between longer gestations and the probability of having been exposed. We use a large-scale individual-level data set from Texas in which we can measure gestation and outcomes reasonably precisely and follow the same mother over time; we examine some new and more sensitive indicators of infant health for the first time, and we suggest estimation methods that correct for omitted unobserved fixed characteristics of the mother, endogenous moving in response to storms, and the above mentioned correlation between gestation length and exposure.
We show that if we followed techniques commonly used in the literature, we would conclude that exposure to hurricanes in the third trimester has a significant negative effect on birth weight and gestation. In contrast, our methods suggest that exposure has no significant effect on these outcomes.
This finding is not simply a matter of low power since we do find that exposure to a hurricane during pregnancy increases the probability of complications of labor and delivery, and of abnormal conditions of the newborn. In particular, exposure in the first and third trimesters is associated with a higher probability of abnormal conditions of the newborn. Looking deeper, we find that exposure in the first and third trimesters increases the probability that the child requires assisted ventilation for over 30 minutes, and that exposure in all three trimesters is associated with an increased probability of MAS, a syndrome that can often has serious long term consequences for the newborn.
Although we find some evidence that maternity care is disrupted by hurricanes, the increase in abnormal conditions of the newborn is not explained either by the increased probability of being induced or having a C-section, or by events in the last month of the pregnancy. Similarly, we find little evidence that the increases in abnormal conditions are caused by changes in maternal behavior. Our strategy in this paper is to measure the overall effect of hurricanes, and to carefully consider some of the mechanisms that might account for these effects, such as maternal migration, changes in medical care, and changes in maternal behavior. Stress is a “residual explanation” that remains when we have ruled out other possibilities. We view our results as supportive of the idea that stressful events in pregnancy can damage the health of the fetus as Aizer et al. (2009) suggest. However, the effects may be subtle and not readily apparent in terms of widely-used metrics such as birth weight and gestation.
Appendix Table 5.
Effects of Hurricane Within 30km on Birth Outcomes - Hazard Models
| Low Birth Weight (<2500g) | Gestation (weeks) | Any Abnormal Conditions of Newborn (1996–2004) | Any Complications of Labor/Delivery (1996–2004) | |
|---|---|---|---|---|
| A. IV with Mother Fixed Effects | ||||
|
| ||||
| Hurricane 1st Trimester | −0.0029 (0.0091) | −0.0360 (0.0629) | 0.0348** (0.0136) | 0.0194 (0.0194) |
| Hurricane 2nd Trimester | −0.0042 (0.0085) | −0.0188 (0.0602) | 0.0113 (0.0141) | 0.0205 (0.0192) |
| Hurricane 3rd Trimester | 0.0050 (0.0056) | 0.0400 (0.0361) | 0.0227** (0.0087) | 0.0294** (0.0118) |
|
| ||||
| B. IV with Mother Fixed Effects | ||||
|
| ||||
| Hurricane Any Time During Pregnancy | −0.0011 (0.0050) | 0.0229 (0.0338) | 0.0266*** (0.0080) | 0.0288** (0.0110) |
|
| ||||
| C. IV with Mother Fixed Effects - Placebo Models | ||||
|
| ||||
| Hurricane 6 mo. After Birth | −0.0076 (0.0082) | 0.0181 (0.0543) | −0.0240 (0.0131) | 0.0045 (0.0195) |
|
| ||||
| N | 1,440,809 | 1,440,996 | 896,390 | 896,390 |
Notes: Each column in each panel is a separate regression. See notes under Table 1 for information on the sample. For each outcome, births by mothers who have at most one child with non-missing data for that outcome are omitted.
In these models, each child has a unique observation for each month of the 3rd trimester until the time of birth (i.e., children born in the 7th month of pregnancy have one observation, children born in the 8th month of pregnancy have 2 observations, and children born in the 9th month of pregnancy have 3 observations). Exposure to the hurricane is calculated by considering trimesters from the time of conception (estimated using the child’s birth date and gestation length). Exposure in the 3rd trimester is measured on a monthly level. The regressions include mother fixed effects and the key coefficients of interest are instrumented by indicators for a storm/hurricane at the time of the current pregnancy within a 30km radius of the mother’s first pregnancy residence.
All regressions include time-varying controls for mother’s age, education, and marital status, as well as child’s birth order, conception year and conception month, and an indicator for living within 30km of an area that was ever affected by a storm or hurricane over the time period. Robust standard errors are clustered on the mother.
Significance levels:
p<0.10
p<0.05
p<0.001
Acknowledgments
We are grateful for financial support from the John D. and Catherine T. MacArthur Foundation. We thank seminar participants at Princeton University, UCLA, and Duke for helpful comments. We also thank Janice Jackson, Steven Lowenstein, Gene Willard, and the Committee on Requests for Personal Data (CORPD) at the Texas Department of State Health Services for access to the data, and Solomon Hsiang for sharing data on hurricane wind speeds. The project described was supported by Award Number R24HD058486 from the Eunice Kennedy Shriver National Institute of Child Health & Human Development. The content is solely the responsibility of the authors and does not necessarily represent the official views of the Eunice Kennedy Shriver National Institute of Child Health & Human Development or the National Institutes of Health. We are solely responsible for all views expressed.
Footnotes
Black, Devereux, and Salvanes (2007) offer some of the most convincing evidence in this regard. See Currie (2011) and Almond and Currie (2010, 2011) for surveys of this literature.
Another potential issue with Torche (forthcoming) is that she does not cluster the standard errors in her analysis, but it is unclear how much this would change her qualitative findings.
Another problem with some of the 9/11 studies is that maternal characteristics and birth outcomes may differ significantly by month of birth (Buckles and Hungerman, 2008). In one of the more compelling 9/11 studies, Lauderdale (2006) uses California birth records for 2000–2002 and finds that women with Arab names were 34% more likely to have a low-birth-weight baby and 1.5 times more likely to have a preterm birth in the six months after 9/11 relative to women who gave birth between October 2000 and March 2001. She found no such effects for other ethnic groups. She attributes the effects to stress due to discrimination against individuals of Arabic origin post-9/11.
See www.wunderground.com/hurricane/hurrarchive.asp for more information.
Storms are classified into different categories based on the maximum sustained wind speed. Tropical depressions have a wind speed of up to 39 miles per hour, tropical storms have a wind speed of 40–74 miles per hour, while hurricanes have a wind speed of 75 miles per hour or more. Hurricanes are further classified into categories based on the wind speed.
The sample sizes differ slightly because for all variables, in addition to excluding births by mothers who have at most one child with non-missing gestation or gestation of 26 weeks or greater, we also omit mothers who have at most one child with non-missing information on birth weight (63 additional births).
Over 1996–2004, the following abnormal conditions were recorded: assisted ventilation (<30 min, 30+ min), seizures, anemia, fetal alcohol syndrome, meconium aspiration syndrome, hyaline membrane disease, arterial blood gas pH<7.2, and sepsis. Over 1996–2004, the following complications were recorded: moderate/heavy meconium staining of amniotic fluid, premature rupture of membranes, precipitous labor (<3hrs), prolonged labor (>20hrs), breech/malpresentation, labor febrile, abruptio placenta, placenta previa, excessive bleeding, seizures, dysfunctional labor, cord prolapse, cephalopelvic disproportion.
We use children born in the following intervals: 1/1996–7/1998, 9/2000–5/2001, 7/2002–6/2003, 8/2004–8/2005, 10/2006–6/2008.
Mean birth weight in areas 30km away from a hurricane path fell from 3345 to 3295 grams over our sample period. Possible reasons include increased probability of live birth among low birth weight infants and use of in-vitro fertilization.
For example, suppose a hurricane occurred in August. An infant conceived in March, who was born in September after 7 months gestation would be classified as being exposed in the third trimester if we counted backwards, whereas the child was actually exposed in the 6th month of gestation.
For the sake of comparison, we have also estimated all our models using a discrete time hazard model similar to that employed in Currie and Neidell (2005). We treat each infant as though he or she contributed one observation to the sample for each month of the last trimester of pregnancy (recall that we are including only pregnancies that last at least 26 weeks, which is the vast majority of pregnancies). For example, an infant born in the 7th month has one observation, an infant born in the 8th month gets two observations, and an infant born in the 9th month gets three. An outcome such as premature birth is coded as a 1 if it happened in that month and a zero otherwise. The non-time-varying characteristics are the same for each observation, while indicator variables for whether mothers were exposed to a hurricane vary over time. We also include a dummy variable for each month of the last trimester. This procedure is simple to implement in our fixed effects-IV framework and is asymptotically equivalent to estimating a continuous time hazard model. Following the discussion above, the instruments are defined with reference to whether there was a hurricane in the relevant time period within 30km of the place that we first observe the mother. The standard errors are clustered at the mother level. Results corresponding to Table 4, Panels E, F, and G are shown in Appendix Table 5. They are virtually identical.
These are actually the first stages corresponding to Panel D, with the “full gestation” instrument. All of the first stages are quite similar.
We also estimated models for the other, rarer, abnormal conditions listed on the birth certificate as well as hyaline membrane disease, but did not find any statistically significant effects.
The data on WIC clinics comes from a public records request from the Texas Department of State Health Services and are described further in Rossin-Slater (2012).
A recent report from the aftermath of Hurricane Sandy contrasts the experience of homeowners in gated communities that were wiped out by the storm to the experience of nearby residents of rental public housing units. The former are uncertain about whether and when their community will be rebuilt, whereas the later have been taken care of by the public housing authority (Berger, 2012). In the event of disaster, more advantaged residences have greater resources to weather the storm, but also have more to lose.
Publisher's Disclaimer: This is a PDF file of an unedited manuscript that has been accepted for publication. As a service to our customers we are providing this early version of the manuscript. The manuscript will undergo copyediting, typesetting, and review of the resulting proof before it is published in its final citable form. Please note that during the production process errors may be discovered which could affect the content, and all legal disclaimers that apply to the journal pertain.
References
- Aizer Anna, Stroud Laura, Buka Stephen. Brown University Department of Economics Working Paper. Mar, 2009. Maternal Stress and Child Well-Being: Evidence from Siblings. [Google Scholar]
- Almond Douglas, Chay Kenneth, Lee David. The Cost of Low Birthweight. The Quarterly Journal of Economics. 2005;120(3):1031–1083. [Google Scholar]
- Almond Douglas, Currie Janet. Killing Me Softly: The Fetal Origins Hypothesis. The Journal of Economics Perspectives. 2011 doi: 10.1257/jep.25.3.153. [DOI] [PMC free article] [PubMed] [Google Scholar]
- Almond Douglas, Currie Janet. Human Capital Development Before Age Five. In: Ashenfleter Orley, Card David., editors. The Handbook of Labor Economics, 4b. Amsterdam: Elsevier Science B.V; 2010. [Google Scholar]
- Berger Joseph. Enclaves, Long Gate, Seek to Let in Storm Aid. The New York Times. 2012 Nov 26; http://www.nytimes.com/2012/11/27/nyregion/new-york-city-enclaves-long-gated-want-to-let-in-storm-aid.html?pagewanted=all.
- Berkowitz GS, Wolff MS, Janevic TM, Holzman IR, Yehuda P, Landrigan PJ. The World Trade Center Disaster and Intrauterine Growth Restriction. Journal of the American Medical Association. 2003;290:595–6. doi: 10.1001/jama.290.5.595-b. [DOI] [PubMed] [Google Scholar]
- Beligere N, Rao R. Neurodevelopmental Outcome of Infants with Meconium Aspiration Syndrome: Report of a Study and Literature Review. Journal of Perinatology. 2008;28:S93–101. doi: 10.1038/jp.2008.154. #3. [DOI] [PubMed] [Google Scholar]
- Black Sandra, Devereux Paul, Salvanes Kjell. From the Cradle to the Labor Market? The Effect of Birth Weight on Adult Outcomes. Quarterly Journal of Economics. 2007 Mar; [Google Scholar]
- Buckles Kasey, Hungerman Daniel. National Bureau of Economic Research Working Paper No. 14573. 2008. Season of Birth and Later Outcomes: Old Questions, New Answers. [DOI] [PMC free article] [PubMed] [Google Scholar]
- Callaghan William M, Rasmussen Sonja A, Jamieson Denise J, Ventura Stephanie J, Farr Sherry L, Sutton Paul D, Matthews Thomas J, Hamilton Brady E, Shealy Katherine R, Brantley Dabo, Posner Sam F. Health Concerns of Women and Infants in Times of Natural Disasters: Lessons Learned from Hurricane Katrina. Maternal and Child Health Journal. 2007;11:307–311. doi: 10.1007/s10995-007-0177-4. [DOI] [PubMed] [Google Scholar]
- Camacho Adriana. Stress and Birth Weight: Evidence from Terrorist Attacks. American Economic Review: Papers & Proceedings. 2008;98(2):511–515. [PubMed] [Google Scholar]
- Currie Janet. Inequality at Birth: Some Causes and Consequences. American Economic Review. 2011 May [Google Scholar]
- Currie Janet, Neidell Matthew. Air Pollution and Infant Health: What Can We Learn From California’s Recent Experience? Quarterly Journal of Economics. 2005 Aug;vCXX:1003–1030. #3. [Google Scholar]
- Deschênes Olivier, Moretti Enrico. Extreme Weather Events, Mortality, and Migration. The Review of Economics and Statistics, MIT Press. 2009;91(4):659–681, 02. [Google Scholar]
- Dunkel-Schetter Christine. Psychological Science on Pregnancy: Stress Processes, Biopsychosocial Models, and Emerging Research Issues. Annual Review of Psychology. 2011;62:531–558. doi: 10.1146/annurev.psych.031809.130727. [DOI] [PubMed] [Google Scholar]
- Eccleston Melissa. In Utero Exposure to Maternal Stress: Effects of 9/11 on Birth and Early Schooling Outcomes in New York City. Harvard University; Nov, 2011. working paper. [Google Scholar]
- Eskenazi Brenda, Marks Amy R, Catalano Ralph, Bruckner Time, Toniolo Paolo G. Low birth weight in New York City and upstate New York following the events of September 11th. Human Reproduction. 2007;22(11):3013–3020. doi: 10.1093/humrep/dem301. [DOI] [PubMed] [Google Scholar]
- Glynn Laura M, Wadhwa Pathik D, Dunkel-Schetter Christine, Chicz-DeMet Aleksandra, Sandman Curt A. When Stress Happens Matters: Effects of Earthquake Timing on Stress Responsivity in Pregnancy. American Journal of Obstetrics and Gynecology. 2001;184(4):637–642. doi: 10.1067/mob.2001.111066. [DOI] [PubMed] [Google Scholar]
- Hamutcu Refika, Nield Toni, Garg Meena, Keens Thomas, Platzker Arnold. Long-Term Pulmonary Sequelae in Children Who Were Treated with Extracorporeal membrane Oxygenation for Neonatal Respiratory Failure. Pediatrics. 2004 Nov;114(5):1292. doi: 10.1542/peds.2003-1080-L. [DOI] [PubMed] [Google Scholar]
- Hsiang Solomon. Temperatures and cyclones strongly associated with economic production in the Caribbean and Central America. Proceedings of the National Academy of Sciences. 2010;107:15367–15372. doi: 10.1073/pnas.1009510107. [DOI] [PMC free article] [PubMed] [Google Scholar]
- Lauderdale Diane. Outcomes for Arabic-Named Women in California Before and After September 11. Demography. 2006;43(1):185–201. doi: 10.1353/dem.2006.0008. [DOI] [PubMed] [Google Scholar]
- Lederman Sally Ann, Rauh Virginia, Weiss Lisa, Stein Janet L, Hoepner Lori A, Becker Mark, Perera Frederica P. The Effects of the World Trade Center Event on Birth Outcomes among Term Deliveries at Three Lower Manhattan Hospitals. Environmental Health Perspectives. 2004;112(17):1772–1778. doi: 10.1289/ehp.7348. [DOI] [PMC free article] [PubMed] [Google Scholar]
- Lipkind Heather S, Curry Allison, Huynh Mary, Thorpe Lorna, Matte Thomas. Birth Outcomes Among Offspring of Women Exposed to the Sept. 11, 2001, Terrorist Attacks. Obstetrics and Gynecology. 2010;116:917–925. doi: 10.1097/AOG.0b013e3181f2f6a2. #4. [DOI] [PubMed] [Google Scholar]
- Mansour Hani, Rees Daniel. Discussion Paper Series, IZA DP No 5535. 2011. Prenatal Stress on Birth Weight: Evidence from the al-Aqsa Intifada. [Google Scholar]
- MacFarlane PI, Heaf DP. Pulmonary Function in Children after Neonatal meconium Aspiration Syndrome. Archives of Disease in Childhood. 1988;63:368–372. doi: 10.1136/adc.63.4.368. [DOI] [PMC free article] [PubMed] [Google Scholar]
- Mulder EJH, Robles de Medina PG, Huizink AC, Van den Bergh BRH, Buitelaar JK, Visser GHA. Prenatal Maternal Stress: Effects on Pregnancy and the (Unborn) Child. Early Human Development. 2002;70:3–14. doi: 10.1016/s0378-3782(02)00075-0. [DOI] [PubMed] [Google Scholar]
- Plyer Allison. What Census 2010 Reveals About Population and Housing in New Orleans and the Metro Area. Greater New Orleans Community Data Center; Mar 17, 2011. [Google Scholar]
- Rossin-Slater Maya. Columbia University Department of Economics Working Paper. Mar, 2012. WIC in Your Neighborhood: New Evidence on the Impacts of Geographic Access to Clinics. [DOI] [PMC free article] [PubMed] [Google Scholar]
- Simeonova Emilia. CESInfo Working Paper No 2814. 2009. Out of Sight, Out of Mind? The Impact of Natural Disasters on Pregnancy Outcomes. [Google Scholar]
- Tan Cong E, Li Hong Jun, Zhang Xian Geng, Zhang Hui, Han Pei Yu, An Qu, Ding Wei Jun, Wang Mi Qu. The Impact of the Wenchuan Earthquake on Birth Outcomes. PLoS ONE. 2009;4(12):e8200. doi: 10.1371/journal.pone.0008200. [DOI] [PMC free article] [PubMed] [Google Scholar]
- Torche Florencia. The Effect of Maternal Stress on Birth Outcomes: Exploiting a Natural Experiment. forthcoming in Demography. [DOI] [PubMed] [Google Scholar]
- Weatherford C, Gray WM. Typhoon structure as revealed by aircraft reconnaissance. Part II: Structural variability. Mon Wea Rev. 1988;116:1044–1056. [Google Scholar]
- Xiong Xu, Harville Emily W, Mattison Donald R, Elkind-Hirsch Karen, Pridjian Gabriella, Buekens Pierre. Exposure to Hurricane Katrina, Post-Traumatic Stress Disorder, and Birth Outcomes. The American Journal of the Medical Sciences. 2008;336(2):111–115. doi: 10.1097/MAJ.0b013e318180f21c. [DOI] [PMC free article] [PubMed] [Google Scholar]