

Abstract
♦ Objective: Conventional hemodialysis (HD) predominates over peritoneal dialysis (PD) around the world. Prospective and comparative studies comparing the costs of these modalities are scarce. In the present prospective assessment, we describe the resources used and total patient costs for both HD and PD.
♦ Methodology: We assessed 249 patients on HD and 228 on PD. All patients were 18 years of age or older and on stable dialysis. The information was collected at three points over 1 year, using standard questionnaires. The sources for costs were the Brazilian public and private health care systems. Societal perspective was considered.
♦ Statistical Analysis: Core trends and dispersions were measured. Regression models assessed the impact of modality on the average total cost per patient per year.
♦ Results: Of the 249 HD patients and 228 PD dialysis patients, 189 (74%) and 160 (70%) respectively completed follow-up. The mean age for women was 55.8 years; for men, it was 59.8 years (p = 0.001). The average total cost per patient-year was US$28 570 for HD and US$27 158 for PD. By category, the costs consisted of direct medical-hospital costs (82.3% for HD, 86.5% for PD), direct nonmedical costs (5.3% for HD, 3.7% for PD), and indirect costs (12.4% for HD, 9.8% for PD). Overall costs were less for PD patients than for their HD counterparts (p = 0.025).
♦ Conclusions: Maintenance dialysis represented the most important source of costs for both modalities; loss of productivity incurred significant costs. Future studies should contemplate the social consequences arising from each modality.
Key words: Dialysis modality, hemodialysis, modality distribution, costs, developing countries, health assessment technology, health decision-making
Despite a global lack of uniform data, the numbers of patients requiring renal replacement therapy (RRT) are known to be increasing in most countries (1). Worldwide, the annual growth rate in the dialyzed population is 8.0%, which exceeds the population growth of 1.3% (2-5).
In Brazil, dialysis treatment has seen remarkable expansion since the 1950s, reaching 91 091 prevalent patients in July 2010. Those patients were being managed in 638 dialysis units, of which 53% were concentrated in the southeast region of the country (5,6).
The cost of renal replacement therapy in Brazil is a very important issue. It has been continuously debated in medical society and the government, which funds more than 85% of maintenance dialysis treatment. The discussion of PD and HD costs has been a permanent feature since the initiation of chronic dialysis treatment in the country in 1975. The literature reports of the costs of chronic dialysis, alone or compared by modality, most often contrast in-center hemodialysis (HD) and ambulatory peritoneal dialysis (PD) (7-9). In Latin America (specifically in Chile and Colombia), retrospective cost studies have been conducted (10,11). However, the findings have shortcomings that are inherent to the retrospective methodology.
In Brazil, prospective studies comparing the two main dialysis modalities still need to be conducted. Given the large portion of financial resources in the public insurance budget that are allocated to renal replacement therapy procedures, such comparisons are highly relevant with respect to dialysis funding decisions (12-15). Our study aimed to prospectively compare the direct and indirect costs of HD and PD in greater São Paulo City, Brazil.
METHODS
STUDY POPULATION
Our study recruited PD and HD patients 18 years of age or older who had been on the same dialysis modality for at least 1 month and who had been receiving treatment at 1 of 6 selected dialysis centers in São Paulo, Brazil. Patients were excluded if they had serious comorbidities whose clinical management could predominate or compete in terms of resource use, if they were hospitalized at the beginning of the study, and if they were scheduled for a change of treatment modality or for renal transplantation within the first 6 months of their inclusion in the study.
To achieve a more accurate comparison, the patient cohorts were matched for age group and sex. No matching for comorbidity was done because our general purpose was to have groups that preserved the main characteristics of the same groups in the overall patient population. Given that the study was observational, we therefore preserved the difference in comorbidities. Comorbidity was taken into consideration in the analysis as an adjustment. At the beginning of the enrollment period, we assessed all patients on dialysis and selected new patients who had started dialysis during the 9-month enrollment period, according to the inclusion criteria.
The centers were selected according to the volume of PD patients in the center, because volume was the main limitation to including patients in the study. We therefore chose a convenience sample of centers in which a greater number of PD patients could be found. Using that strategy, the selected dialysis centers included 1 tertiary university center and 5 additional ambulatory dialysis centers in greater São Paulo (16-20). Initially, all patients undergoing PD at each unit were selected to participate. Thereafter, HD patients were randomly selected and matched with their PD counterparts by sex, age group (<45 years, 45 - 60 years, >60 years), and dialysis center. In that way, the desired sample size of at least 200 patients per group was obtained (6,21).
THE ALTERNATIVES: HD AND PD
The main types of PD in Brazil are continuous ambulatory PD and automated PD. The routine continuous ambulatory PD regimen consisted of 4 daily exchanges with 2 L of dialysis solution per exchange. Automated PD is generally performed during the night, with 6 - 7 exchanges that use a total of about 12 L of dialysis solution. An additional exchange (long dwell) takes place during the day (22) in approximately 30% of patients on automated PD.
In Brazil, HD is not performed at home (22). Conventional HD is routinely performed 3 times per week and, in general, for 4 hours per session for most patients, in a hospital or an ambulatory satellite center. Daily in-center HD is performed in 0.9% of all patients (not included in the present study).
DATA COLLECTION
A standardized questionnaire was administered at 3 points during the study: recruitment and 6 and 12 months later. One-on-one interviews were conducted by 3 nurses who specialize in dialysis care. The nurses were also responsible for gathering data from medical records and collecting other patient data using surveys. Data on demographics, clinical variables, and resources used by each patient during follow-up were also collected (16-20).
DESIGN
This prospective multicenter study followed patients for 1 year, with censoring in the event of death, change in dialysis treatment or dialysis center, renal transplantation, or loss to follow-up (16-20).
COST ASSESSMENT
Identification, Measurement, and Resource Costing: This study took a societal perspective. In economic evaluation studies, the choice of perspective has an important effect on the cost-benefit components assessed and used in the evaluation. From a societal point of view, all costs and benefits of a health care service or illness are taken into account whenever possible; narrower perspectives (for example, the perspective of the health insurance fund or hospital) include only specific components. Direct and indirect costs are both included in the societal form of cost analysis (16-18).
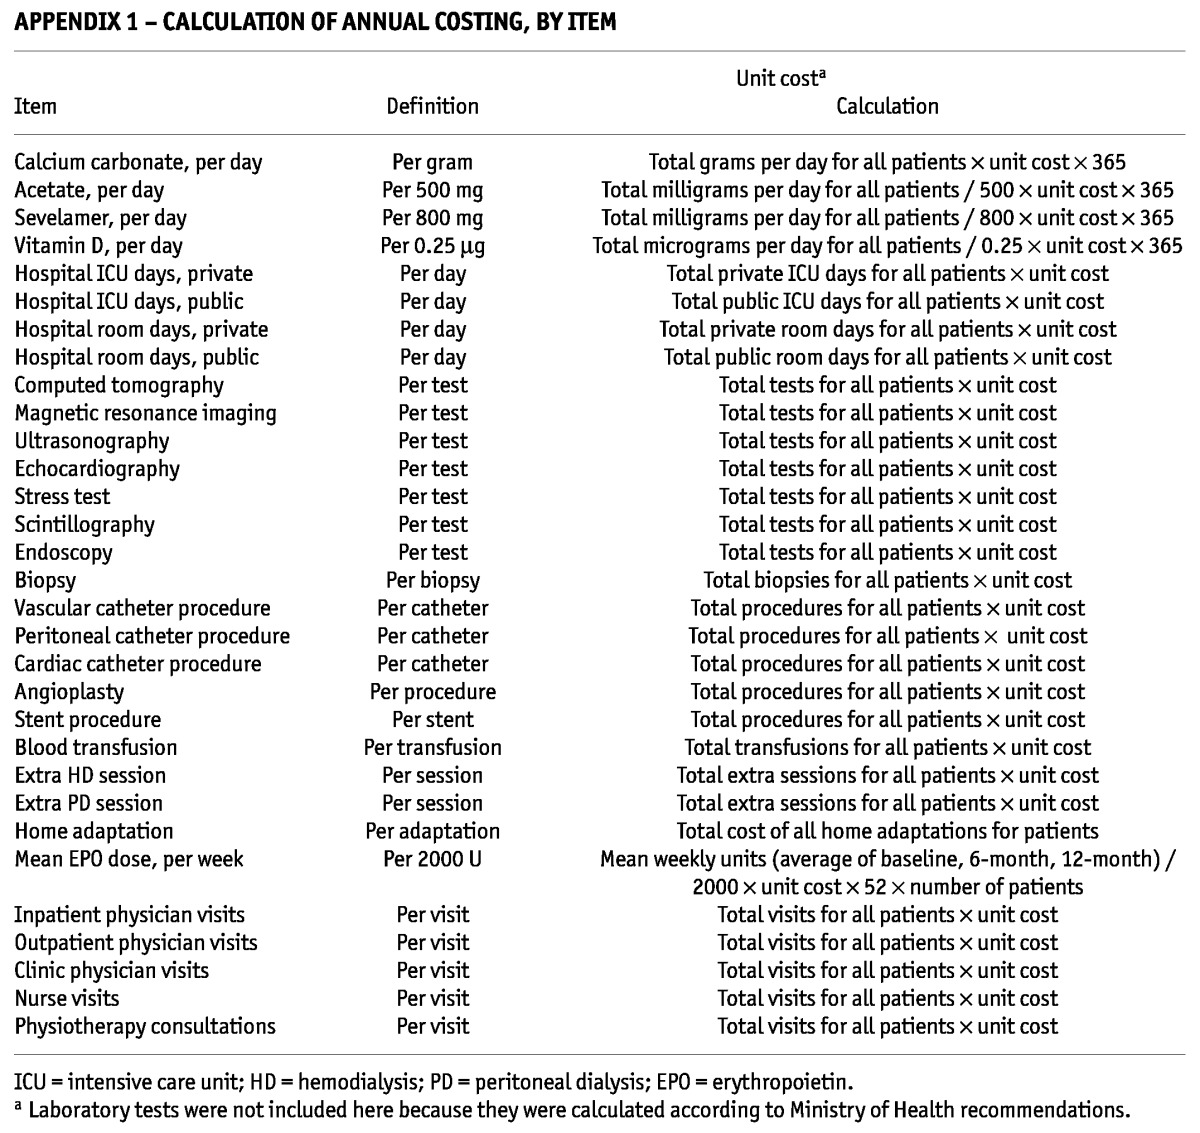
The resources were categorized as direct medical (physician visits; other health professional visits; hospitalization, diagnostic imaging, and laboratory procedures; medications; maintenance dialysis; clinical complications related to dialysis; and medical complications related to dialysis access); direct nonmedical (travel cost, home adaptation, government aid because of disease, and caregiver cost), and indirect (productivity loss). For the direct costs, the costing process was characterized by an analysis of the frequency of use for each resource, multiplied by the respective unit cost (19,20). Appendixes 1 and 2 detail how the various cost items were calculated.
APPENDIX 1—
CALCULATION OF ANNUAL COSTING, BY ITEM
APPENDIX 2—
METHOD FOR CALCULATING LABORATORY ITEM COSTSA
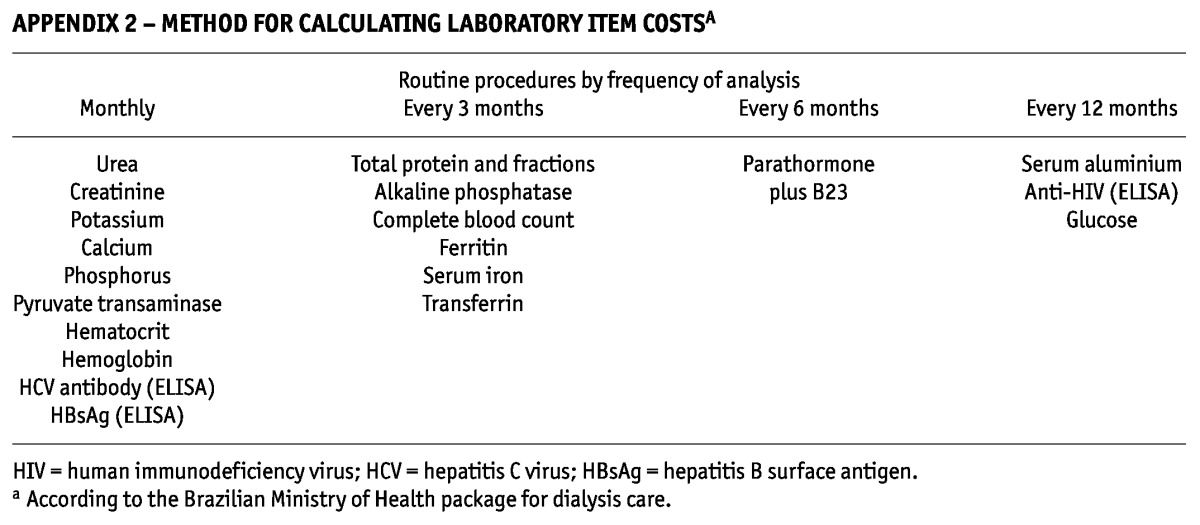
Routine Laboratory Tests: Testing followed Ministry of Health guidelines. Some tests were therefore carried out monthly; others, quarterly or yearly. Appendix 2 describes each test and the cost process. No costs were duplicated. The costs of tests were computed for each patient according to that patient’s follow-up period (21,22).
Standard Medications: The costs of selected drugs were calculated based on the average dose used by the patients in the study, multiplied by the number of months in the study and the respective unit cost for each drug. In this group, the costs of calcium carbonate, vitamin D, sevelamer, and erythropoietin were analyzed (21,22,23).
Maintenance Dialysis: For HD, the value of a session was analyzed by multiplying the unit value of its reimbursement by 13 (number of sessions per month). The reimbursable package created by the Brazilian government consists of 13 regular sessions of HD and 4 additional emergency HD sessions, or 30 regular PD sessions and 4 additional emergency PD sessions. The period of time (months) that the patient spent in follow-up was multiplied by 13. The two modalities were assessed according to public and private reimbursement. Peritoneal dialysis was analyzed according to follow-up time in the study and the value of the monthly reimbursement package. The characteristics of the packages were determined by the Ministry of Health (22,23).
Transportation Cost: Transportation costs were included in the analysis based on the reports provided by patients. The principal means of transportation considered were train, bus, taxi, ambulance, and personal automobile. All values considered here relate to the specific follow-up period (2008 - 2009) (16).
The costs related to ambulance and personal automobile were estimated considering the distance between each dialysis center and the city center. A mean was calculated and used in the study. The reason for this approach is that the actual cost for each means of transport was not available for the public eye—especially in the case of ambulances. Ambulance transportation is provided by the government. Surprisingly, none of the sources provided information about ambulance costs.
With respect to trains and buses, the trips per month were multiplied by the cost of the tickets. Although some patients were granted a ticket by the government, we decided to calculate all the costs involved because of the study’s societal perspective.
Some patients reported they used other means of transportation—for example, they took a ride with a neighbor or a friend. In those cases, we calculated the costs considering the number of trips per month, the distance between the clinic and the patient’s residence, and the cost per kilometer.
The fares for public and private transport were related to the average costs for such transportation during the study period.
Home Adaptation: Patients who made adjustments at home provided the expenditures associated with home adaptations. The adjustments usually consisted of enlarging doors, making plumbing and water-filtering system changes, adapting a room to accommodate the system, and the like (16,17).
Caregiver Cost: Costs related to caregiving were considered as specified by the patients (16,17).
Government Aid: Using a standardized general questionnaire, interviewees were asked directly whether they were receiving welfare benefits from the government and, if so, what the nature of the aid was (18).
Indirect Costs: Productivity losses because of dialysis were based on the theory of human capital approach. In a survey that asked specific questions about pre- and post-dialysis income, patients were assumed to have lost wages because of dialysis if their monthly income decreased from pre- to post-dialysis. For example, if monthly pre-dialysis income was $100 dollars and dropped to $60 post-dialysis, the lost productivity was calculated as $40 times the number of months the patient was in the study (19,20).
Sources of Costs: The public system (“Unified Health System”) and the private one (“Supplemental Health”) provided reimbursement values to the present investigation (22). The source of values for private insurance, particularly for direct reimbursement of ambulatory dialysis, was the average reimbursement value of packages provided by private health insurers (n = 20) that covered the centers in which the study was conducted (22-24). A weighted analysis was not performed, because no discrepancy was found between the average value used and a weighted average in the analysis of the contribution of the private insurers. The value of reimbursement is intended to cover several medical and nonmedical items such as personnel expenses; taxes; basic solutions and drugs to provide dialysis; administrative materials; costs of equipment; and expenses for the dialysis room, building, furniture, and so on. We ensured that no costs were double-counted in the analysis (18-20).
Using recommendations from the literature, we adopted this strategy because the Brazilian health system is a mixed one, consisting of a public system and a private one. We chose to estimate the costs, including the reimbursement values, because access to those values is limited in both systems.
Costs were calculated in Brazilian reals (R$) and converted into U.S. dollars based on the average of mean exchange values during the 12 months of the follow-up period (US$1.00 = R$1.91). Afterwards, the average cost per patient-year in each resource category was estimated by summing the patient-days in each group and dividing the total by 365. That result was then divided by the total number of patients in each group.
STATISTICAL ANALYSIS
The descriptive statistics sample and the resources used in each cost category were analyzed in detail. Comparisons of basic parameters between the groups used the chi-square test and Student t-test. Also, we used an Anderson-Darling test, which is an alternative to the chi-square. It tests whether a sample of data comes from a population with a specific distribution, making use of the specific distribution to calculate critical values.
The costing process used an analysis of the frequency of use for each resource multiplied by its respective cost unit, according to the values for public and private reimbursement. The average total cost per patient-year for each dialysis modality (HD and PD) was calculated (25,26).
Two other scenarios were built for comparison with the baseline scenario. Both scenarios included all resources used by the patients during follow-up:
Scenario 1 (reference scenario): Resources found in either or both of the public and the private sector costing tables, in accordance with what happened in the study
Scenario 2 (public scenario): Hypothetical values considering exclusively the public sector costing table
Scenario 3 (private scenario): Hypothetical values considering exclusively the private sector costing table
A multivariate analysis using a log-linear model assessed the impact of dialysis modality on costs at the patient level, adjusting for baseline characteristics. The dependent variable was the total cost per patient per year. Potential independent variables included age category (0 for age ≤ 54 years, 1 for age > 54 years), sex (0 for men, 1 for women), race (0 for nonwhite, 1 for white), payer type (0 for public, 1 for private), comorbidities [0, 1 (dummy variables)], dialysis center (0 for all other centers, 1 for center A), lab values (phosphorus and hemoglobin), dialysis modality (0 for PD, 1 for HD), and years on dialysis before the start of the study. Variables with a p value of 0.1 or less were retained in the final multivariate regression model (25,26).
The protocol was approved by the Institutional Committee of Research at the Federal University of São Paulo and in the centers where the study was conducted. All patients signed an informed consent after a full explanation of the study was provided.
RESULTS
Between April 2007 and February 2009, 249 HD and 228 PD patients [190 (83.3%) on automated PD and 38 (16.7%) on continuous ambulatory PD] were selected to participate in the study. The study cohort included 21 more patients on HD than on PD, because it was not possible to find patients on PD who met the matching criteria. Table 1 describes the demographic, clinical, and laboratory characteristics of the patients. Mean time on dialysis at the beginning of the study was 3.85 years for the HD group and 3.44 years for the PD group (p = 0.03). In the HD group, 16 patients (6.4%) and, in the PD group, 20 patients (8.8%) had been on dialysis for less than 3 months.
TABLE 1.
Baseline Demographic, Clinical, and Laboratory Characteristics of the Study Groups
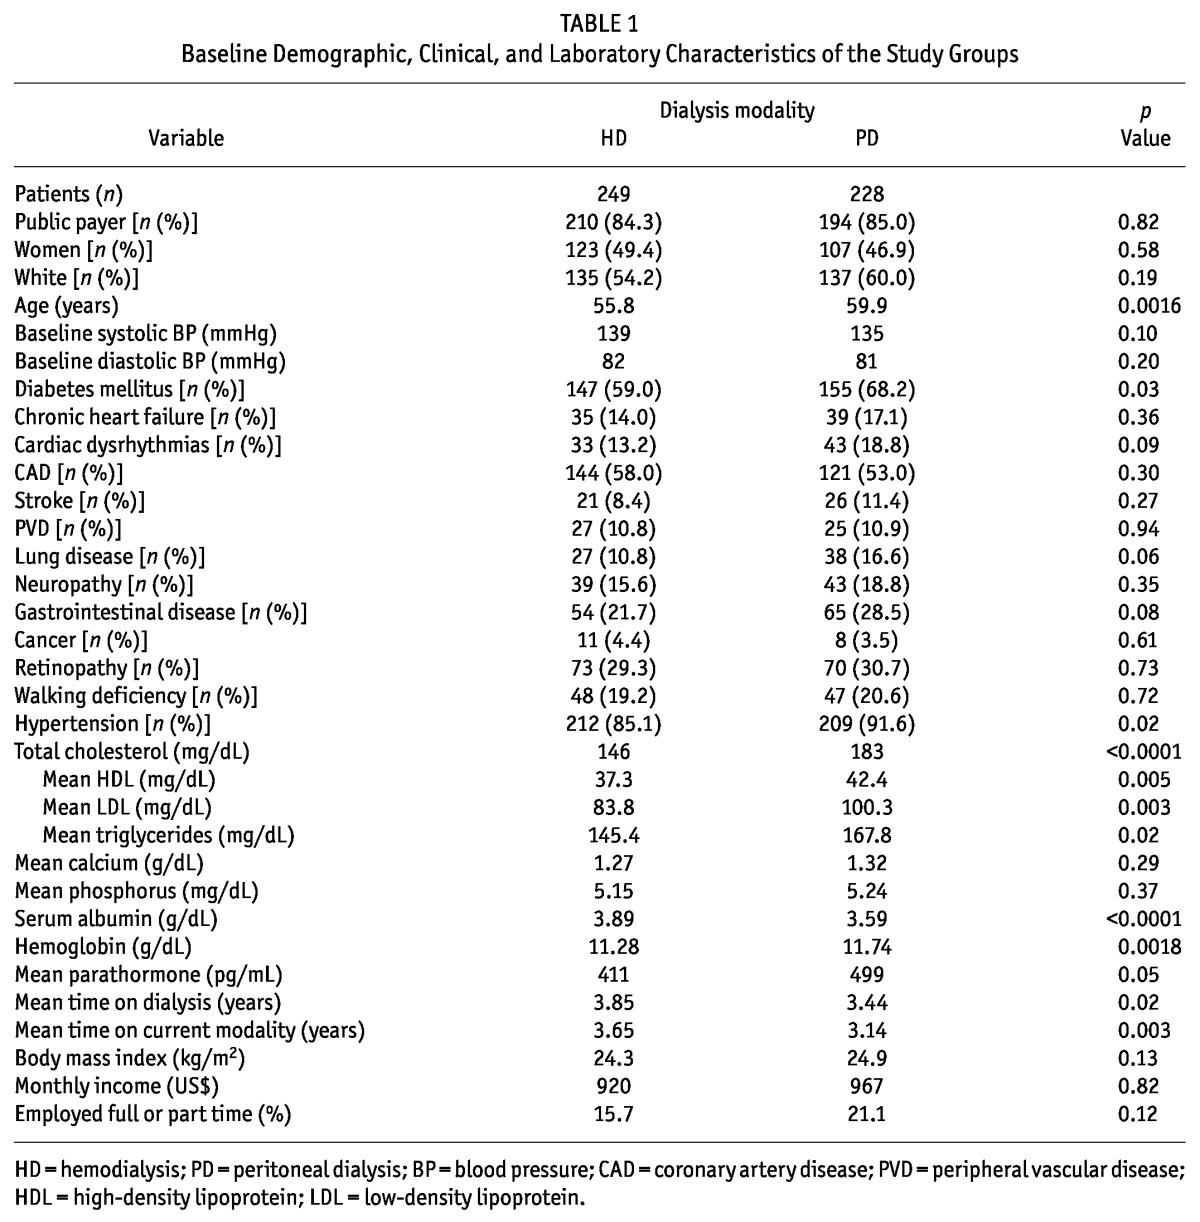
Approximately half the patients in both groups were women. The mean age was 55.8 years for women; for men, it was 59.8 years (p = 0.001). Of the study patients, 59% of those on PD and 68% of those on HD were diabetic (p = 0.03), and 184 patients on HD (74%) and 160 on PD (70%) completed 12 months of follow-up. The total patient follow-up in the study was 209 patient-years for HD and 186 patient-years for PD.
Figure 1 shows clinical complications and reasons that patients did not complete follow-up. Infectious events totaled 61 in the HD patients and 90 in the PD patients. In both groups, infections were particularly related to the dialysis access. Cardiovascular disease (CVD) was the main clinical complication and reason for death in the HD group (59.4%); in PD, infection was the main cause of death (50%).
Figure 1.

— Flowchart of study patients per group during follow-up. CHF = chronic heart failure; CHD = coronary heart disease; PVD = peripheral vascular disease.
About 85% of patients in both groups were covered by public insurance, a percentage similar to the national distribution (5). The average monthly income was US$920 for the HD group and US$967 for the PD group, with 15.7% of HD patients and 21.1% of PD patients actively working full- or part-time. Detailed questions on indirect costs were answered by 86 PD patients (37.7%) and 135 HD patients (54.2%).
On average, resources consumed were similarly distributed between the groups. Table 2 details the mean cost distributions in each group by resource category. The overall average cost per patient-year was US$28 570 for HD and US$27 158 for PD. Direct medical costs was the main resource category that contributed to overall cost (82.3% for HD, 86.5% for PD). The most relevant items were ambulatory maintenance dialysis (57.7% of total direct medical costs for HD, 64.7% for PD) and medications (38.7% and 22.1% of total direct medical costs for HD and PD respectively). The total cost per patient-year for erythropoietin was US$5 252 for HD and US$4 951 for PD. The average costs for hospitalization, professional fees, and diagnostic procedures were similar between the groups (Table 2).
TABLE 2.
Distribution of Resources and Overall Average Costs (Direct and Indirect), at the Patient Level in the Study Groups
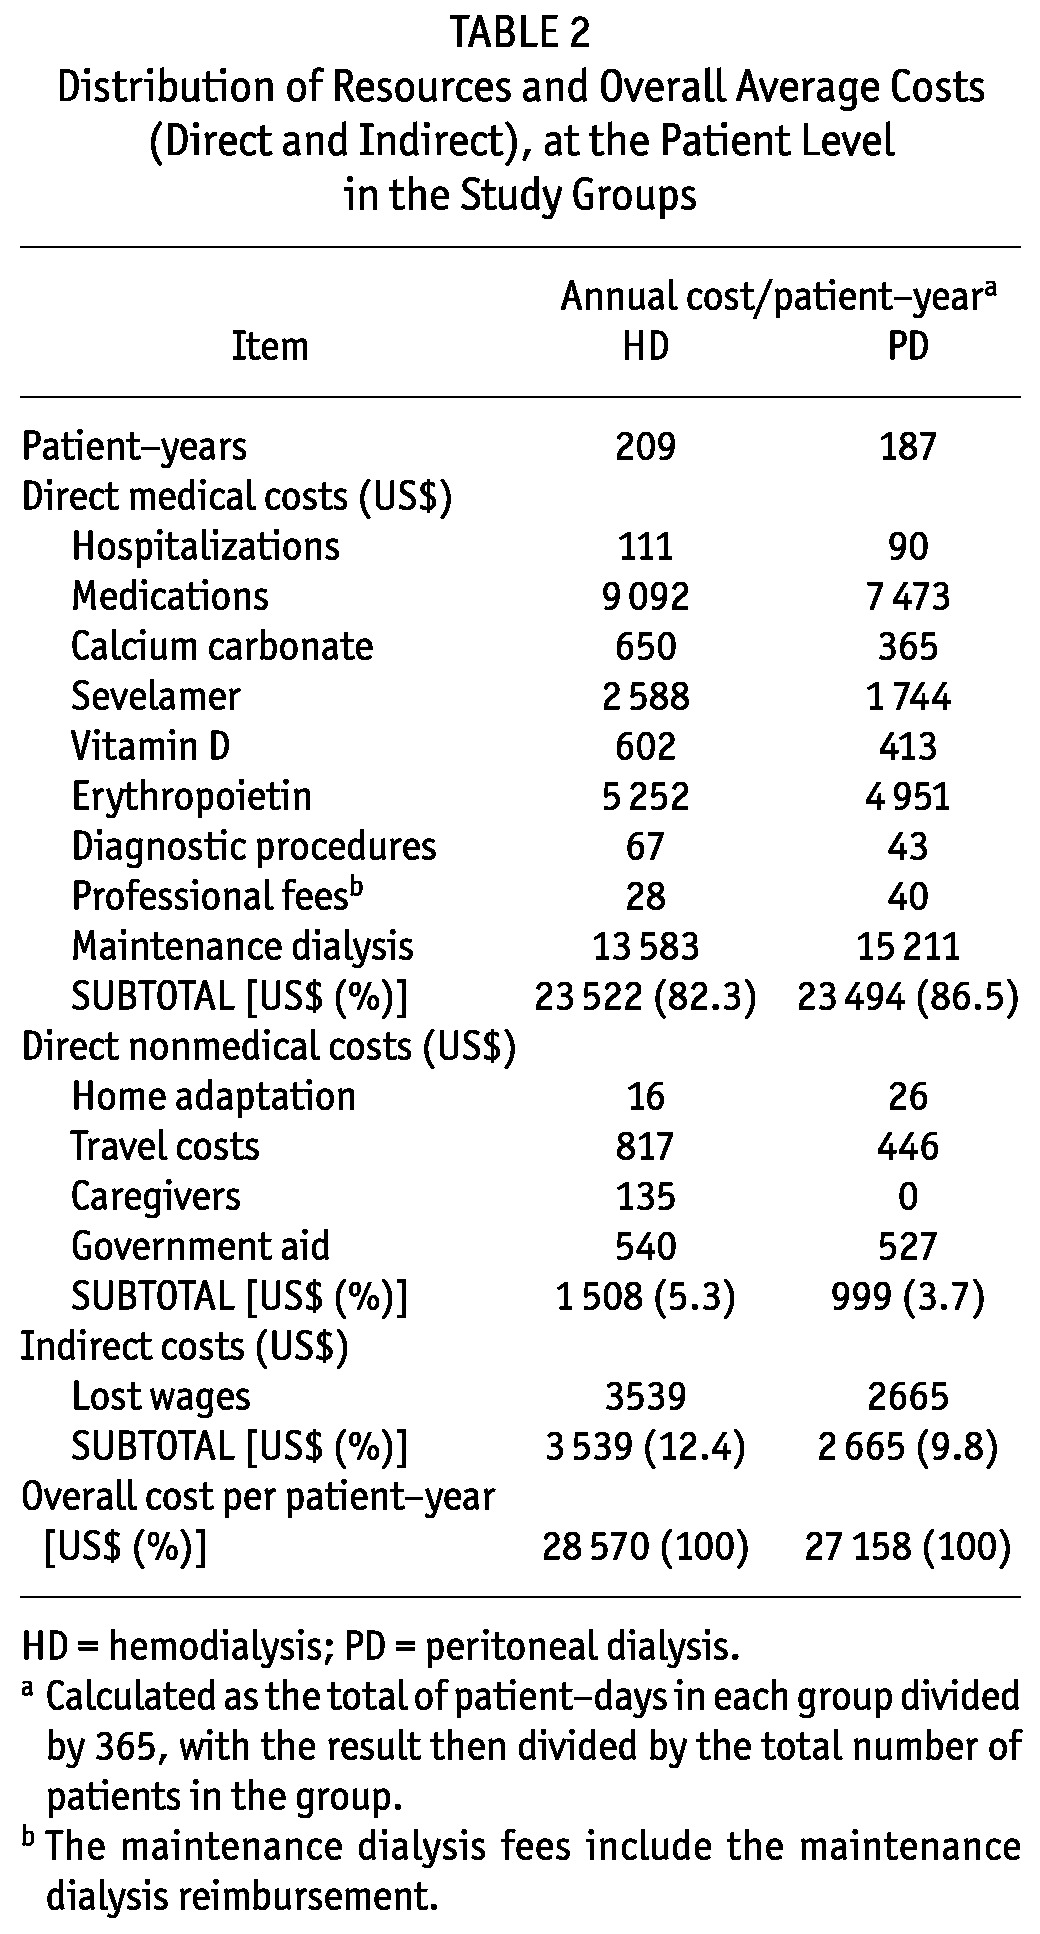
Direct nonmedical costs accounted for 5.3% of the overall costs in the HD group and 3.7% in the PD group. The major cost factors were related to travelling to the dialysis unit (US$817 and US$446 for HD and PD respectively) and government aid (US$540 and US$527 for HD and PD respectively).
For total indirect costs, lost wages were US$3 539 per patient-year for HD and US$2 665 for PD.
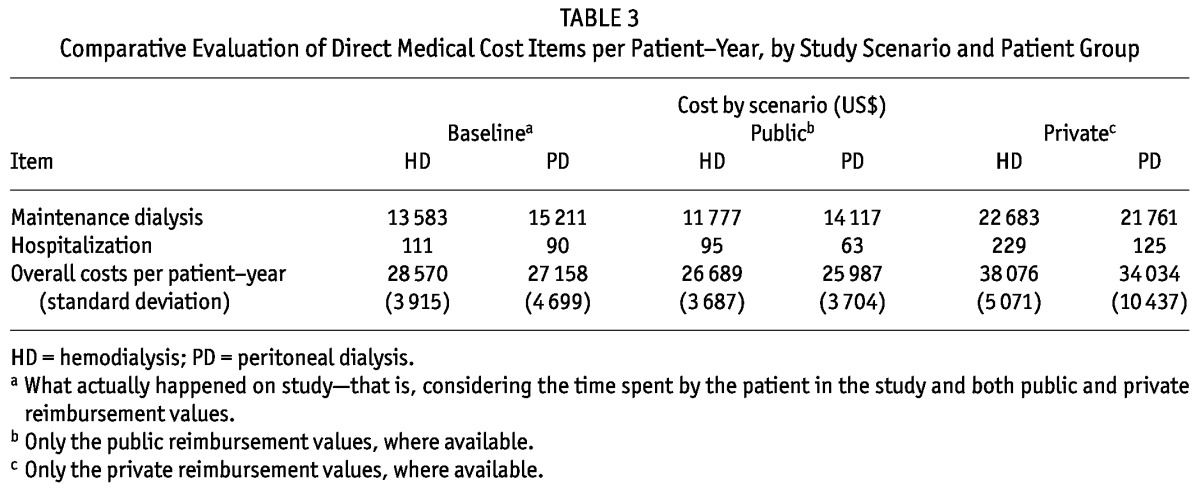
Variations in overall costs were attributable mainly to the costs of maintenance dialysis, which were substantially higher when the reimbursement was made by private health insurance (Table 3). In the public scenario, the mean values per patient-year for maintenance dialysis were US$11 777 for HD and US$14 177 for PD. In this scenario, compared with the study’s base scenario, the latter two figures represented an average decrease of US$1 806 per patient-year for HD and US$1 094 for PD. In the private scenario, the maintenance dialysis cost was US$22 683 for HD and US$21 761 for PD. In comparison with the base scenario, those amounts represented an increase of US$9 100 (67%) for HD and US$6 550 (43%) for PD per patient-year.
TABLE 3.
Comparative Evaluation of Direct Medical Cost Items per Patient-Year, by Study Scenario and Patient Group
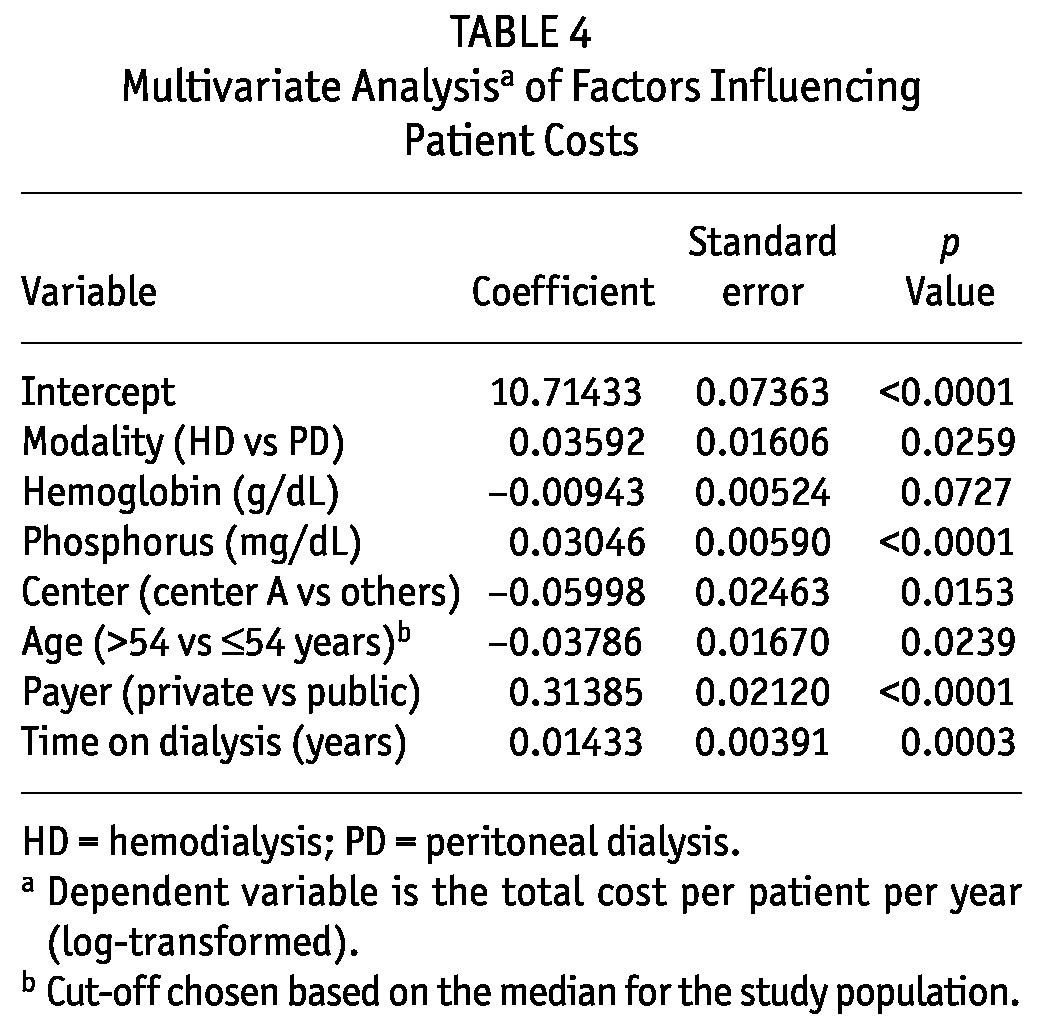
In the multivariate analysis, based on the Anderson-Darling normality test, the untransformed dependent variable (total cost per patient-year) violated the normality assumption. A log transformation of total costs per patient-year resulted in a distribution that did not violate the normality assumption. Our model was therefore log-linear. As shown in Table 4, the variables retained in the final regression model were dialysis modality, hemoglobin, phosphorus, dialysis center, age category, payer type, and years on dialysis. The adjusted final model R2 was 0.4016, and no colinearity or heteroscedasticity issues with the model were observed. Unexpectedly, the older age category (compared with the younger age category) had the lower total costs per patient-year. According to the model, adjusted total costs per patient-year were US$27 843 for HD and US$26 882 for PD (p = 0.026).
TABLE 4.
Multivariate Analysisa of Factors Influencing Patient Costs
DISCUSSION AND CONCLUSIONS
Our study sought to assess the resources and costs associated with chronic dialysis in São Paulo, Brazil. Our results showed that overall average costs per patient-year were US$28 570 and US$27 158 for HD and PD respectively.
In the medical direct costs category, maintenance dialysis was the item that represented the greatest proportion of the costs for both modalities (68% for HD, 72% for PD), followed by medications (37.2% and 31.4%).
The groups were comparable with respect to their socio-demographic characteristics. However, our study has some limitations. The group matching was not entirely strict. At baseline, patients on PD were older and more frequently had diabetes (stemming from the actual distribution of those characteristics in the patient population). Incident and prevalent patients were both included in the study.
Initially, all available PD patients were selected; afterward, they were matched with HD patients according to sex and age group. However, data on an additional 21 HD patients were collected during the study period, and considering the difficulty in obtaining follow-up data, we chose to keep the extra patients in the study, trying to find PD patients to match them. Unfortunately, by study end, we still had not been able to find matched PD patients. The decision to retain the extra HD patients was made before the analysis.
Hospitalization may have been underestimated given that it represented less than 1% of the costs in both groups. Despite the magnitude of the hospitalization item in the sample, the scenario that included only private insurance costs showed an increase in the costs of hospitalization by 41.5% in the HD group and by 50% in the PD group compared with public costs. In fact, our study indicates that the costs reimbursed by government for hospitalization, procedures, and professional fees are low and clearly below the real costs. That observation had already been made in an earlier retrospective study conducted in our setting (27), reinforcing the importance of our analysis of costs from the perspective of private insurance. That perspective reflects values that are closer to the actual costs of care for this item category, and importantly, it differentiates the present study from other international studies. For instance, the cost of hospitalization corresponds to almost half the cost of a patient on dialysis in the United States (28,29,30). With respect to maintenance dialysis, reimbursement costs were used because actual costs were not available.
The productivity loss assessment may not have been totally accurate. We did not incorporate official data for retirement and sick leave, because they did not serve the purposes of the present study. Another potential limitation is that loss of productivity incorporates the concept of “presenteeism,” which is the loss of productivity during labor. Thus far, we lack validated instruments in Brazil to measure the costs of those aspects, which might be able to be assessed in future studies (17,20,31).
During follow-up, cardiovascular disease was the main clinical complication in the HD group. In a previous study, Sesso et al. reported that, in Brazil, cardiovascular disease is the leading cause of hospitalization and consumes significant health care resources in HD therapy (27). In the PD group, infection predominated as the main cause of clinical complications and death (Figure 1). Infection is known to be a relevant issue in developing countries (32-35). Nevertheless, the causes and their impacts on costs for infections must be further investigated. Despite the clinical complications observed, hospitalization and professional fees did not, as discussed earlier, influence total costs. That observation might be explained by reports in other studies that addressed developing countries. Blake showed that the issues of modality distribution in developing countries are different. In such settings, staff costs for HD are relatively lower and the prices for PD solutions are relatively higher (36,37,38).
To our knowledge, the present study is the first to have estimated the indirect costs related to dialysis therapy in Brazil. The methodology used accords with the human capital theory. The results were different from those observed in some international studies (37), but similar to those in another Brazilian survey that focused on a different disease (31). Additionally, there were some limitations in regard to the analysis of caregiving costs, which might potentially have led to underestimated values.
As Horl et al. (39) and Lameire et al. (40) pointed out, PD is more common in countries in which public dialysis providers predominate than in those in which the service is predominantly private. The Brazilian health system is mixed: services are provided by both the public and the private sectors (5,6). To better understand the discrepant distribution between the modalities in this complex framework, we built hypothetical scenarios assessing differences between the monetary values for public and private health care assistance. In the private scenario, an increase of US$9 100 dollars per patient-year corresponding to maintenance dialysis for the HD group was observed (total value of US$22 683); for the PD group, the difference was US$6 550 (total value of US$21 761). Those differences may have several causes, such as taxes, incentives, and certain political trends.
When it comes to taxes and incentives, another Brazilian study that aimed to analyze the micro-costing of HD services showed that values differed according to the scale economy. Additionally, it showed that there were cost increments because of overhead (administrative costs) and that those increments were different for the public and the private services. The public service cost substantially less than the private one (41).
Other studies have tried to understand the differences between health system types, dialysis reimbursement, and the implications for macroeconomic policy (42,43). De Vecchi et al. conducted an international comparison of the costs and reimbursements for certain key dialysis modalities in several developed countries. They also found that reimbursement for dialysis differs between health system organizations. According to the authors, one possible explanation relates to microeconomic aspects (43). Although the present study did not contemplate those aspects, discrepancies between modality distributions may have been influenced by them.
In the multiple linear regression analysis, the influence of treatment modality significantly favored PD (β = 0.03592, p = 0.026), which represents only 11% of dialysis in Brazil (Table 4). Results of studies from other developing countries may help to illuminate the present one (10,11,33,44,45). In Chile, one study that evaluated direct costs documented an annual average cost of US$18 885 for HD and $17 031 for PD (31). Mexico is the main country in which PD prevails over HD (76% - 81%) (31). China represents the second country in the proportion of PD use (11%), although HD still predominates. The annual average cost per patient-year for HD (in relation to PD) exceeded US$8 308 in Mexico and RMB 14 063 in China (31).
Choosing the perspective is one of the basic decisions that must to be made at the start of every assessment, and that choice has a long-lasting effect on the result of the study (16-20). We took a societal perspective because that viewpoint contemplates more facets of the actual health system. Pharmacoeconomic guidelines highly recommend the societal perspective as a “gold standard” in evidence hierarchy.
In Canadian guidelines and U.S. recommendations for pharmacoeconomics analysis, the societal perspective is stipulated. In contrast, Australia takes into account only the consequences for the health care system (44).
The relevance of the present study hinges on the prospective data collection, the assessment of indirect costs (rarely found in the literature), the substantial number of patients surveyed, the various cost scenarios used, and the multivariate analysis performed. The potential generalization of our data for the country relies on the fact that the study was developed in the largest city in Latin America. São Paulo has the largest number of patients on renal replacement therapy in the country, and our dialysis population has demographic and clinical characteristics that are similar to those found in the national census of patients on dialysis (5,6). Furthermore, the estimated costs for the public and private sector also reflect the national reality. Our findings estimate more precisely the comparative costs of chronic dialysis in Brazil and indicate that the costs tend to be lower for PD than for HD. A differential was observed even considering that the patients on PD were older, with more comorbidities.
Future studies should be conducted to analyze the decision-making process in dialysis treatment, both in terms of micro-decision (physician-patient encounter) and macro-decision (policy choices). Such studies should also attempt a deeper understanding of the indirect costs and social consequences arising from each modality (45-48).
DISCLOSURES
The authors have no financial conflicts of interest to declare.
Acknowledgments
Grant support was provided by Baxter Healthcare Corporation.
References
- 1. Weening JJ. Advancing nephrology around the globe: an invitation to contribute. J Am Soc Nephrol 2004; 15:2761–2 [DOI] [PubMed] [Google Scholar]
- 2. Zhang QL, Rothenbacher D. Prevalence of chronic kidney disease in population-based studies: systematic review. BMC Public Health 2008; 8:117 [DOI] [PMC free article] [PubMed] [Google Scholar]
- 3. Huang HC, Wang JY, Chang CC, Chiu PF, Chiang MC, Yang Y. Nonclinical factors associated with treatment with peritoneal dialysis in ESRD patients in Taiwan. Perit Dial Int 2010; 30:638–43 [DOI] [PubMed] [Google Scholar]
- 4. Schieppati A, Perico N, Remuzzi G. Preventing end-stage renal disease: the potential impact of screening and intervention in developing countries. Nephrol Dial Transplant 2003; 18:858–9 [DOI] [PubMed] [Google Scholar]
- 5. Sesso R. Epidemiology of Chronic Kidney Disease in Brazil and Its Prevention [Portuguese, Web page]. São Paulo, Brazil: Centro de Vigilância Epidemiológica “Prof. Alexandre Vranjac”; n.d. [Available at: http://www.cve.saude.sp.gov.br/htm/cronicas/irc_prof.htm; accessed 3 July 2010] [Google Scholar]
- 6. Brazilian Society of Nephrology. Census Results: 2009 [Portuguese]. São Paulo, Brazil: Brazilian Society of Nephrology; n.d. [Available online at: http://www.sbn.org.br/pdf/censo_SBN_2009_final.pdf; accessed 3 July 2010] [Google Scholar]
- 7. Sennfält K, Magnusson M, Carlsson P. Comparison of haemodialysis and peritoneal dialysis—a cost utility analysis. Perit Dial Int 2002; 22:39–47 [PubMed] [Google Scholar]
- 8. Kirby L, Vale L. Dialysis for end-stage renal disease. Determining a cost-effective approach. Int J Technol Assess Health Care 2001; 17:181–9 [DOI] [PubMed] [Google Scholar]
- 9. Pacheco A, Saffie A, Torres R, Tortella C, Llanos C, Vargas D, et al. Cost/utility study of peritoneal dialysis and hemodialysis in Chile. Perit Dial Int 2007; 27:359–63 [PubMed] [Google Scholar]
- 10. Cusumano AM, Di Gioia C, Hermida O, Lavorato C. on behalf of the Latin American Registry of Dialysis and Renal Transplantation. The Latin American dialysis and renal transplantation registry annual report 2002. Kidney Int Suppl 2005; (97):S46–52 [DOI] [PubMed] [Google Scholar]
- 11. Sanabria M, Muñoz J, Trillos C, Hernández G, Latorre C, Díaz CS, et al. Dialysis outcomes in Colombia (DOC) study: a comparison of patient survival on peritoneal dialysis vs hemodialysis in Colombia. Kidney Int Suppl 2008; (108):S165–72 [DOI] [PubMed] [Google Scholar]
- 12. Blake PG, Floyd J, Spanner E, Peters K. How much extra does “adequate” peritoneal dialysis cost? Perit Dial Int 1996; 16(Suppl 1):S171–5 [PubMed] [Google Scholar]
- 13. Li PK, Chow KM. The cost barrier to peritoneal dialysis in the developing world—an Asian perspective. Perit Dial Int 2001; 21(Suppl 3):S307–13 [PubMed] [Google Scholar]
- 14. Tungsanga K, Kanjanabuch T, Mahatanan N, Praditpornsilp K, Avihingsanon Y, Eiam-Ong S. The status of, and obstacles to, continuous ambulatory peritoneal dialysis in Thailand. Perit Dial Int 2008; 28(Suppl 3):S53–8 [PubMed] [Google Scholar]
- 15. White SL, Chadban SJ, Jan S, Chapman JR, Cass A. How can we achieve global equity in provision of renal replacement therapy? Bull World Health Organ 2008; 86:229–37 [DOI] [PMC free article] [PubMed] [Google Scholar]
- 16. Drummond MF. Cost analysis. In: Drummond MF, O’Brien B, Stoddart GL, Torrance GW, eds. Methods for the Economic Evaluation of Health Care Programmes. 2nd ed. New York, NY: Oxford University Press; 1997: 52–92 [Google Scholar]
- 17. Drummond MF. Critical assessment of economic evaluation. In: Drummond MF, O’Brien B, Stoddart GL, Torrance GW, eds. Methods for the Economic Evaluation of Health Care Programmes. 2nd ed. New York, NY: Oxford University Press; 1997: 27–45 [Google Scholar]
- 18. Drummond MF, Richardson WS, O’Brien BJ, Levine M, Heyland D. Users’ guides to the medical literature. XIII. How to use an article on economic analysis of clinical practice. A. Are the results of the study valid? Evidence-Based Medicine Working Group. JAMA 1997; 277:1552–7 [DOI] [PubMed] [Google Scholar]
- 19. O’Brien BJ, Heyland D, Richardson WS, Levine M, Drummond MF. Users’ guides to the medical literature. XIII. How to use an article on economic analysis of clinical practice. B. What are the results and will they help me in caring for my patients? Evidence-Based Medicine Working Group. JAMA 1997; 277:1802–6 [Erratum in: JAMA 1997; 278:1064] [DOI] [PubMed] [Google Scholar]
- 20. Kolbet G. Health economics—general issues. In: Kolbet G. Health Economics: An Introduction to Economic Evaluation. 2nd ed. London, UK: Office of Health Economics; 2002: 9–21 [Google Scholar]
- 21. Sesso R, Fernandes PF, Anção M, Drummond M, Draibe S, Sigulem D. Acceptance for chronic dialysis treatment: insufficient and unequal. Nephrol Dial Transplant 1996; 11:982–6 [PubMed] [Google Scholar]
- 22. Departamento de Ciência e Tecnologia, Secretaria de Ciência, Tecnologia e Insumos Estratégicos, Ministério da Saúde. Consolidation of health technology assessment in Brazil. [Portuguese]. Rev Saúde Pública 2010; 44:381–3 [DOI] [PubMed] [Google Scholar]
- 23. Departamento de Ciência e Tecnologia, Secretaria de Ciência e Tecnologia e Insumos Estratégicos do Ministério da Saúde. Health technology assessment: institutionalization of actions in the Brazilian Ministry of Health [Portuguese]. Rev Saúde Pública 2006; 40:743–7 [Available online at: http://portal.saude.gov.br/portal/arquivos/pdf/artigo_ats_institucionalizacao_acoes_ms.pdf; accessed 1 July 2010] [DOI] [PubMed] [Google Scholar]
- 24. Noll R, Cassali SL. Hemodialysis clinics—a warning to companies: sanitation [Portuguese]. Presented at the XXVII Congresso Interamericano de Engenharia Sanitária e Ambiental; Porto Alegre, Brazil; 3 - 8 December 2000. [Available online at: http://www.bvsde.paho.org/bv-saidis/saneab/vii-018.pdf; accessed 1 July 2010] [Google Scholar]
- 25. Upshur RE. The ethics of alpha: reflections on statistics, evidence and values in medicine. Theor Med Bioeth 2001; 22:565–76 [DOI] [PubMed] [Google Scholar]
- 26. Altman DG, Bland JM. Improving doctors’ understanding of statistics. J R Stat Soc 1991; 154:223–67 [Google Scholar]
- 27. Sesso R, da Silva CB, Kowalski SC, Manfredi SR, Canziani ME, Draibe SA, et al. Dialysis care, cardiovascular disease and costs in end-stage renal disease in Brazil. Int J Technol Assess Health Care 2007; 23:126–30 [DOI] [PubMed] [Google Scholar]
- 28. Kirby L, Vale L. Dialysis for end-stage renal disease. Determining a cost-effective approach. Int J Technol Assess Health Care 2001; 17:181–9 [DOI] [PubMed] [Google Scholar]
- 29. Mehrotra R. Changing patterns of peritoneal dialysis utilization in the United States. Perit Dial Int 2007; 27(Suppl 2):S51–2 [PubMed] [Google Scholar]
- 30. Khawar O, Kermah D, Fried L, Kalantar-Zadeh K, Kermah D, Fried L, et al. Clinical experience: improving chronic peritoneal dialysis (CPD) outcomes but unchanged maintenance hemodialysis (MHD) outcomes in the United States (Abstract). Perit Dial Int 2007; 27:S16 17556297 [Google Scholar]
- 31. de Azevedo AB, Ferraz MB, Ciconelli RM. Indirect costs of rheumatoid arthritis in Brazil. Value Health 2008; 11:869–77 [DOI] [PubMed] [Google Scholar]
- 32. Nayak KS, Prabhu MV, Sinoj KA, Subhramanyam SV, Sridhar G. Peritoneal dialysis in developing countries. Contrib Nephrol 2009; 163:270–7 [DOI] [PubMed] [Google Scholar]
- 33. Neil N, Walker DR, Sesso R, Blackburn JC, Tschosik EA, Sciaraffia V, et al. Gaining efficiencies: resources and demand for dialysis around the globe. Value Health 2009; 12:73–9 [DOI] [PubMed] [Google Scholar]
- 34. Mowatt G, Vale L, Perez J, Wyness L, Fraser C, MacLeod A, et al. Systematic review of the effectiveness and cost-effectiveness, and economic evaluation, of home versus hospital or satellite unit haemodialysis for people with end-stage renal failure. Health Technol Assess 2003; 7:1–174 [DOI] [PubMed] [Google Scholar]
- 35. Andrade MV, Junoy JP, Andrade EI, Acurcio Fde A, Sesso R, Queiroz OV, et al. Allocation of initial modality for renal replacement therapy in Brazil. Clin J Am Soc Nephrol 2010; 5:637–44 [DOI] [PMC free article] [PubMed] [Google Scholar]
- 36. Blake PG. The complex economics of modality selection. Perit Dial Int 2004; 24:509–11 [PubMed] [Google Scholar]
- 37. Mahajan S, Tiwari SC, Kalra V, Bhowmik DM, Agarwal SK. Factors affecting the use of peritoneal dialysis among the ESRD population in India: a single-center study. Perit Dial Int 2004; 24:538–41 [PubMed] [Google Scholar]
- 38. Ernst R. Indirect costs and cost-effectiveness analysis. Value Health 2006; 9:253–61 [DOI] [PubMed] [Google Scholar]
- 39. Horl WH, de Alvaro F, Williams PF. Healthcare systems and end-stage renal disease (ESRD) therapies—an international review: access to ESRD treatments. Nephrol Dial Transplant 1999; 14(Suppl 6):10–15 [DOI] [PubMed] [Google Scholar]
- 40. Lameire N, Joffe P, Wiedemann M. Healthcare systems—an international review: an overview. Nephrol Dial Transplant 1999; 14(Suppl 6):3–9 [DOI] [PubMed] [Google Scholar]
- 41. Fundação Instituto de Pesquisas Econômicas (FIPE). Cost Structure of Hemodialysis Service in São Paulo [Portuguese]. São Paulo, Brazil: FIPE; 1997. [Google Scholar]
- 42. Berger A, Edelsberg J, Inglese GW, Bhattacharyya SK, Oster G. Cost comparison of peritoneal dialysis versus hemodialysis in end-stage renal disease. Am J Manage Care 2009; 15:509–18 [PubMed] [Google Scholar]
- 43. De Vecchi AF, Dratwa M, Wiedemann ME. Healthcare systems and end-stage renal disease (ESRD) therapies—an international review: costs and reimbursement/funding of ESRD therapies. Nephrol Dial Transplant 1999; 14(Suppl 6):31–41 [DOI] [PubMed] [Google Scholar]
- 44. International Society for Pharmacoeconomics and Outcomes Research (ISPOR). Country-specific pharmacoeconomics guidelines [Web resource]. Lawrenceville, NJ: ISPOR; n.d. [Available online at: http://www.ispor.org/PEguidelines/COUNTRYSPECIFIC.asp; accessed 30 September 2011] [Google Scholar]
- 45. Meltzer MI, Teutsch SM. Setting priorities for health needs, managing resources. In: Stroup DF, Teutsch SM, eds. Quantitative Solutions to Public Health Problems. New York, NY: Oxford University Press; 1998: 123–50 [Google Scholar]
- 46. Venkataraman V, Nolph KD. Socioeconomic aspects of peritoneal dialysis in North America: role of non medical factors in the choice of dialysis. Perit Dial Int 1999; 19(Suppl 2):S419–22 [PubMed] [Google Scholar]
- 47. Quinn RR, Laupacis A, Hux JE, Moineddin R, Paterson M, Oliver MJ. Forecasting the need for dialysis services in Ontario, Canada to 2011. Healthcare Policy 2009; 4:e151–61 [PMC free article] [PubMed] [Google Scholar]
- 48. Detsky AS, Laupacis A. Relevance of cost-effectiveness analysis to clinicians and policy makers. JAMA 2007; 298:221–4 [DOI] [PubMed] [Google Scholar]