

Abstract
Earlier reports have suggested that the BCR/ABL oncogene, associated with chronic myeloid leukemia, induces a mutator phenotype; however, it is unclear whether this leads to long-term changes in chromosomes and whether the phenotype is found in primary chronic myelogeneous leukemia (CML) cells. We have addressed both these issues. BCR/ABL-expressing cell lines show an increase in DNA breaks after treatment with etoposide as compared to control cells. However, although BCR/ABL-expressing cell lines have an equivalent cell survival, they have an increase in chromosomal translocations after DNA repair as compared to control cells. This demonstrates that BCR/ABL expression decreases the fidelity of DNA repair. To see whether this is true in primary CML samples, normal CD34 + progenitor cells and CML progenitor cells were treated with etoposide. CML progenitor cells have equivalent survival but have an increase in DNA double-strand breaks (DSBs). Spectral karyotyping demonstrates new chromosomal translocations in CML cells, but not normal progenitor cells, consistent with error-prone DNA repair. Taken together, these data demonstrate that BCR/ABL enhances the accumulation of DSBs and alters the apoptotic threshold in CML leading to error-prone DNA repair.
Keywords: BCR/ABL, chronic myeloid leukemia, etoposide, spectral karyotyping (SKY), genomic instability
Introduction
Chronic myelogeneous leukemia (CML) is a two-stage malignant disease of the blood. In the initial chronic stage, there is expansion of a clonal population of myeloid cells. These cells retain the capacity to differentiate, and the disease can be controlled by hydroxyurea or ABL kinase inhibitors, such as imatinib.1 However, over a period of several years, untreated disease progresses to blast crisis stage in which there are increased numbers of cells that are incapable of normal differentiation and resistant to chemotherapy. Multiple lines of evidence from animal and human models support the conclusion that the BCR/ABL oncogene is necessary for chronic phase CML.1,2 BCR/ABL is an activated tyrosine kinase, which is the protein product of the t(9;22)(q34;q11) translocation seen in patients with CML.3 BCR/ABL induces dysregulated cellular growth leading to chronic phase CML; however, it is unclear whether or not BCR/ABL is involved in the progression to CML blast crisis.
The majority of CML blast crisis patients have cytogenetic abnormalities in addition to the original t(9;22)(q34;q11) translocation.4–6 The cytogenetic abnormalities include trisomy 8, loss of chromosome 17, other chromosomal deletions and new translocations. However, none of these translocations occur in a high percentage of patients, suggesting that progression to blast crisis does not depend on the acquisition of mutations in a single, critical protein or pathway, but instead, reflects a more general state of genomic instability. This observation has caused multiple investigators to question whether a mutator phenotype is an essential phenotype of CML. This issue was initially addressed by the laboratory of Dr Fialkow who proposed that stem cells from all patients with CML demonstrate a single glucose-6 phosphate dehydrogenase isoform and that only some of these stem cells contained the Philadelphia chromosome, whereas others did not.7 On the basis of this finding, these investigators proposed that the Philadelphia chromosome arose in a cell with a prior mutator phenotype. However, these results have never been confirmed.
More recently, investigators have considered whether BCR/ABL itself could cause a mutator phenotype. Initially, several groups studied cell survival after genotoxic stress as a surrogate for the response to DNA damage in both BCR/ABL-expressing cell lines and primary CML cells. The results were conflicting, with some groups reporting that BCR/ABL expression decreased the cytotoxicity associated with DNA damage8 and others suggesting that BCR/ABL expression increased cytotoxicity.9–11 However, these experiments were carried out with different DNA-damaging agents and under different conditions, making it difficult to compare the results. Laneuville et al.12 originally suggested that BCR/ABL may induce a mutator phenotype in murine cell lines. In the past few years, several attempts have been made to address this by looking more directly at DNA damage or DNA repair. It has been proposed that BCR/ABL enhances the efficiency but compromises the fidelity of two major DNA double-strand break (DSB) repair mechanisms, homologous recombination and non-homologous end-joining8,13,14 and that BCR/ABL expression increases the production of reactive oxygen species, which lead to mutations.15,16 On the other hand, we have demonstrated that after the treatment of cells with DNA-damaging agents, BCR/ABL-expressing cells have an increase in DSBs, suggesting a delay in DSB repair after genotoxic stress.17 Consistent with the accumulation of high numbers of DSBs by leukemia cells, Deutsch and colleagues18,19 have demonstrated that BCR/ABL-expressing cells have increased sister chromatid exchanges and other types of DNA damage after treatment with chemotherapeutic agents. Importantly, CML blast crisis is associated with chromosomal abnormalities but no one has previously examined chromosomal abnormalities directly in primary BCR/ABL-expressing cells after recovery from DNA damage.
To perform these experiments, we initially utilized murine Ba/F3 cells expressing BCR/ABL under the regulation of a tetracycline-inducible promoter (Ba/F3 pTET-On p210).20 Thus, the cells are isogenic with control cells except for expression of BCR/ABL. We examined the response of cells after a 2 h exposure to etoposide, a topoisomerase II inhibitor, known to induce DSBs. Importantly, we have shown earlier that in these cells, treatment with etoposide for 2 h induces DNA DSBs, which are repaired after 24 h.17 We now address whether such repair is error-prone leading to chromosomal abnormalities. Using spectral karyotyping (SKY) of cells, we demonstrate that BCR/ABL-expressing cells, but not control cells, have error-prone DNA repair leading to novel chromosomal aberrations and translocations. Next, we studied primary CML cells and confirmed that CML cells when compared to normal hematopoietic progenitor cells are equivalent in cell survival but have increased DSBs and increased chromosomal abnormalities after a fixed dose of etoposide. Taken together, these results demonstrate that BCR/ABL alters the apoptotic threshold in cells and leads to error-prone DNA damage and chromosomal rearrangements.
Methods
Cells and reagents
Ba/F3 pTET-On p210 cells were a kind gift of Dr George Daley (Harvard University, Boston, MA, USA) and have been described earlier.20 Cells were maintained in RPMI 1640 media containing 10% fetal bovine serum and 1.0 ng/ml recombinant interleukin 3 (IL3). For induction of BCR/ABL expression, cells were washed two times in phosphate-buffered saline (PBS) and re-incubated in media containing 1 μg/ml doxycycline (Sigma, St Louis, MO, USA). Anonymous primary CML cells and normal bone marrow cells were obtained from the Stem Cell and Leukemia Core facility at the University of Pennsylvania. All cells were collected after informed consent. CD34 + cells were purified to greater than 90% purity using the Miltenyi AutoMacs device according to the manufacturer's directions.
Colony-forming assays
Ficoll-purified bone marrow and leukopheresis samples were washed in 10% fetal bovine serum/PBS/Pen-Strep and resuspended in PBS with DNase (8 μg/ml) to minimize clumping. Cells were divided equally and suspended at a maximum concentration of 2 × 10⁶ cells/ml in media (90% Iscove's Modified Dulbecco's Medium/10% fetal bovine serum/Pen-Strep) with cytokines (IL3, IL6 and stem cell factor at 10 ng/ml each) and treated with a final concentration of 10 μm etoposide (Sigma) for 2 h (0.1% DMSO was used in controls of etoposide-treated cells). Cells were washed twice, resuspended in media and live cell counts were taken by Trypan blue staining. CML chronic, CML blast crisis and normal bone marrow samples were resuspended at 2000 or 10 000 cells/ml of MethoCult methylcellulose-based media with cytokines (H4434; Stem Cell Technologies, Vancouver, BC, CA). All conditions were done in triplicate at 37 °C and 5% CO2 and randomly numbered for unbiased colony counting 14 days after treatment. CD34 + sorted cells were plated at 125 or 500 cells/ml unless otherwise noted. Colonies were classified by having a minimum number of 40 cells per cluster.
Cell viability and survival assays
Ba/F3 pTET-On-p210 cells were treated with recombinant mouse IL3 (10 ng/ml), doxycycline (1 μg/ml or as indicated in figures and text), and doxycycline + recombinant mouse IL3 for 24 h prior to plating. Cells were+plated at 2.5 × 10⁴ cells in 100 μl of media in triplicate in a 96-well plate for each concentration range of etoposide, aphidicolin and hydroxyurea tested. At 44 h after addition of drug, a 25 μl solution of (2,3-bis-(2-methoxy-4-nitro-5-sulfophenyl)-2H-tetrazolium-5-carboxanilide) (XTT) (Invitrogen, Carlsbad, CA, USA) at 1 mg/ml and Phenazine methosulfate (PMS) (Sigma) at 35 μg/ml was added to each well and incubated at 37 °C and 5% CO2 for 4 h. Data were recorded with an EL-800 plate reader (Bio-Tek Instruments Inc., Winooski, VT, USA) at 515 nm wavelength. Values represent average with standard deviations. Trypan blue exclusion was used to determine cell viability.
Comet assay
A modified comet assay was performed as described.21 Exponentially growing cells were treated with the desired concentrations of etoposide or irradiated. The medium was replaced with fresh complete medium and incubated for the required post-incubation time. Cells were diluted to a density of 2.5 × 10⁴ cells/ml, and kept on ice. Microscope slides were precoated with 1% (wt/vol) type-IA agarose, and 0.5 ml of cells was mixed with 1 ml of 1% (wt/vol) type-VII agarose and spread over a precoated slide in duplicate. A coverslip was added, and the agarose was allowed to solidify. Coverslips were removed, and slides were placed in lysis solution (100 mM disodium EDTA, 2.5 M NaCl, 10 mM Tris-HCl (pH 10.5)) containing 1% Triton X-100 at 4 °C and incubated for 1 h in the dark. Slides were subsequently washed with ice-cold water for 3 × 15 min each. The slides were then transferred to an electrophoresis tank containing ice-cold alkaline solution (50 mM NaOH, 1 mM disodium EDTA (pH 12.5)) and incubated for 45 min in the dark. Electrophoresis was carried out for 25 min at 18 V (0.6 V/cm) and 250 mA in the dark. Slides were removed, and 1 ml of neutralizing solution (0.5 M Tris-HCl (pH 7.5)) was added and incubated for 10 min. Each slide was rinsed twice with 1 ml of PBS and allowed to dry overnight at room temperature. Slides were stained with propidium iodide (2.5 mg/ml), and comets were analyzed using a Nikon DIAPHOT TDM inverted epifluorescent microscope (consisting of a high-pressure mercury vapor light source, a 580-nm dichromic mirror, 510- to 560-nm excitation filter, and 590-nm barrier filter) at ×20 magnification. In total, 50–100 cells were analyzed per slide using the Komet Assay software (Kinetic Imaging, Liverpool, UK) for olive tail moment, and mean and standard deviation for each experiment were calculated using Microsoft Excel.
Western blotting
Cells were lysed in TTN buffer (50 mM Tris-HCl (pH 7.6), 1% Triton X-100, 150 mM NaCl with protease and phosphatase inhibitors (Sigma)). Protein was quantified using a Bradford reagent (Bio-Rad, Hercules, CA, USA) and 100 μg of protein per lane was used for western blots. Antibodies used were: anti-ABL Ab 8E9 (Pharmingen, San Jose, CA, USA), or anti-β-actin A2228 (Sigma).
SKY
Cells were prepared by treating cells with colcemid (0.1 mg/ml) for 1 h. Cells were treated with hypotonic solution (0.075 M KCl) fixed in methanol:acetic acid (3:1 vol/vol), and resulting metaphase spreads were dropped onto glass slides for analysis Additionally, slides containing metaphase chromosome spreads were incubated with SKY probes for 72 h.22,23 The preparation of SKY probes, slide pretreatment, slide denaturation, detection and imaging have been described earlier, and protocols for all these steps are available at http://www.riedlab.nci.nih.gov/protocols. Approximately 20 metaphase spreads were analyzed per sample and scored for the following: chromosome number (ploidy), numerical aberrations and structural aberrations. Spectrum-based classification and analysis of the fluorescence images (SKY) were achieved using the SkyView software (Applied Spectral Imaging, Carlsbad, CA, USA). The karyotypes of every metaphase spread, from all groups were analyzed using the murine chromosome rules for nomenclature established by the Jackson Laboratories: http://www.informatics.jax.org/mgihome/nomen/anomalies.shtml. For human metaphase spreads analyzed by SKY, the karyotypes of every metaphase spread were analyzed using the human chromosome nomenclature rules described in ISCN, 2005.
Statistical methods
All tests and subsequently the reported P-values are two-sided; we used a type I error rate of 0.05 as the threshold for declaring statistical significance. Analyses were carried out in the freeware R 2.1.0 (2005) using the glm library (numerical alterations and translocations) and the Wilcoxon test (comet tails).
Numerical alterations and translocations
The results of the mutation experiment were analyzed using an approach analogous to a two-way analysis of variance. Unlike data suitable for analysis of variance, our outcomes (either translocation or numerical alterations) are counts, and so we used a quasi-likelihood approach with a log link and a generalized linear modeling approach with an unspecified dispersion parameter.24 In the initial analysis, we fit two models: model 1 included a term for both drug level and experimental group (IL3 or BCR/ABL), and model 2 included terms for drug level, group and terms allowing the effect of drug level to vary by group. We used χ2 tests to compare the fit of the two models to determine whether there was evidence of a statistically significant effect of group that varied by level. If the initial analysis indicated that there were significant group effects that varied by level, we asked two subsequent questions using Wald statistics: first, for each group, did rates of outcome differ between different levels of the drug? Second, for each level, did rates of outcome differ among experimental groups? Fold changes reported in the text are based on the model results.
Results
We initially used a murine hematopoietic cell line, Ba/F3 pTET-On p210, which expresses BCR/ABL under the control of a tetracycline-inducible promoter. The parental Ba/F3 cells are an IL3-dependent cell line, which can be transformed to IL3 independence by the induction of BCR/ABL. We confirmed (Figure 1a) that cells growing in IL3 did not express BCR/ABL (Figure 1a, lane 1) and that BCR/ABL is induced after the addition of doxycycline for 24 h. To study the role of BCR/ABL in chromosomal stability, we hypothesized that a critical role of BCR/ABL in regulating genotoxic stress would be revealed by studying cells that were exposed to low doses of DNA damage that would induce DSBs but not apoptosis. To test this hypothesis, we have studied the response of BCR/ABL-expressing cells exposed to 10 mM etoposide for 2 h and then analyzed for cell viability during a period of DNA repair for 48 h. Cells were treated with etoposide for 2 h, washed free of the drug and replated in IL3 alone, doxycycline alone to induce continued BCR/ABL expression, or a combination of IL3 and doxycycline. As shown in Figure 1b, cells growing in IL3 or expressing BCR/ABL have a constant cell number for 24 h and then a modest increase in cell number between 24 and 48 h of recovery. Cells growing in IL3 and doxycycline grow slightly faster. As there is minimal cell death in these cultures (by Annexin V staining, data not shown), it is likely that cells undergo a cell cycle arrest during the time of DNA damage before beginning to re-grow. Importantly, in several repeat experiments, we never saw a significant difference in cell growth by comparing cells growing in IL3 with those expressing BCR/ABL and growing in the absence of IL3 (data not shown).
Figure 1.

Characterization of Ba/F3 pTET-On p210 cells. (a) Cells were either grown in interleukin 3 (IL3) (lane 1), washed free of IL3 and treated with doxycycline (1 μg/ml, lane 2 or 10 μg/ml, lane 3) for 24 h or treated with doxycycline and IL3 for 24 h (1 μg/ml, lane 4 or 10 μg/ml, lane 5). Cells were harvested, washed and lysed. Lysates were examined for the expression of BCR/ABL by western blotting with anti-ABL antibody. (b) Cells were grown in IL3 (white bars), doxycycline alone (gray bars) or both (black bars) for 24 h. Cells were then treated with 10 μm etoposide for 2 h, washed free of drug and re-plated at 2 × 10⁵ cells/ml. Viable cells were counted each day by Trypan blue exclusion. (c) Cells were grown in IL3 (boxes), doxycycline (triangles), both (circles) or neither (diamonds) and then treated with etoposide for 48 h at indicated concentrations. Cell survival was assayed by XTT and compared to untreated cells. (d) Cells were grown in IL3 (diamonds with solid line), no cytokine (open diamonds with hatched line) or with IL3 at a fixed dose and doxycycline at various concentrations to induce different levels of BCR/ABL expression and then treated with etoposide for 48 h at indicated concentrations. Cell survival was assayed by XTT and compared with untreated cells. Cells growing in IL3 (e) or in doxycycline to induce BCR/ABL (f) were treated with etoposide (10 μm) for 2 h, washed and allowed to recover for 48 h. Cells were treated with colcemid to arrest cells in metaphase, and metaphase spreads were prepared. a and b, abnormalities present in the parent cells; cr, chromatid break; dic, dicentric chromosome; T, translocation; tri-rad, triradial form. Also note that there is only one sex chromosome, a single × chromosome.
Earlier reports have shown conflicting results as to the effect of BCR/ABL expression on cell survival after genotoxic stress. We hypothesized that these differences may reflect variations in culture conditions or level of expression of BCR/ABL. To address this controversy, we performed a more detailed analysis of cell survival after varying the doses of etoposide (Figure 1c). In these experiments, the exposure to etoposide was continued for 48 h, in contrast to the short exposure above. This experiment confirmed that when IL3 is included in the media of BCR/ABL-expressing cells, there is a modest enhancement of cell survival compared to cells growing in IL3 alone or with BCR/ABL expression alone (Figure 1b and Slupianek et al.14). This was true at multiple different concentrations of etoposide. To determine the effect of different levels of BCR/ABL expression, Ba/F3 pTET-On p210 cells were treated with different concentrations of doxycycline. As expected, increased amounts of doxycycline induced higher levels of expression of BCR/ABL (Figure 1a, compare lanes 2 and 3). Unexpectedly, if IL3 was present in the media, BCR/ABL expression was increased at low levels of doxycycline (Figure 1a, compare lanes 2 and 4). The cause of this effect of IL3 is not clear. As shown (Figure 1d), the effect of BCR/ABL on cell survival correlates with the level of expression of BCR/ABL. These two experiments demonstrate that cell survival after genotoxic stress is dependent on culture conditions and the level of BCR/ABL expression.
Ba/F3 pTET-On p210 cells are near-diploid with three chromosomal abnormalities
Many cell lines have chromosomal amplifications or other abnormalities, including some subclones of Ba/F3 cells. To characterize Ba/F3 pTET-On p210 cells, we first confirmed (Supplementary Figure 1) that the cell line is near-diploid. Cytogenetic analysis of the cells growing in IL3 demonstrated that the cells carry the following chromosomal abnormalities: a Robertsonian Rb(3.3) translocation; a T(8;3) translocation and an abnormality of chromosome 17, which appears to be either an inversion 17 or a small translocation involving chromosome 17 (Supplementary Figure 1). In cells growing in IL3 and cells expressing BCR/ABL, both the Rb(3.3) and T(8;3) translocations appeared to be particularly susceptible to further alterations or chromosomal loss. As this was seen to a similar extent in the presence or absence of BCR/ABL and involved a baseline abnormal chromosome, alterations in these recurrent abnormalities were not scored in subsequent analysis.
Expression of BCR/ABL leads to chromosomal abnormalities after DNA repair
We next examined the effect of DNA damage on the chromosomal integrity of cells expressing BCR/ABL. Cells were treated with 10 μm etoposide for 2 h, allowed to recover and metaphase spreads were prepared after 48 h. Analysis of cells growing in IL3 alone and treated with etoposide demonstrated few chromosomal abnormalities (Figure 1e). Approximately 25% of cells revealed chromosomal or chromatid damage. However, the majority of cells showed a near-diploid chromosomal structure (data not shown). Induction of BCR/ABL expression alone did not induce gross chromosomal abnormalities over the 3 days of this experiment (data not shown). In contrast, the majority of BCR/ABL-expressing cells treated with etoposide exhibit massive chromatid and chromosome type damage, consisting of rings, acentric fragments, unbalanced translocations such as tri-radials and other complex aberrations after the treatment of cells with etoposide (Figure 1f). Similar results were seen in each of three experiments and qualitatively suggested that BCR/ABL expression alters DNA repair leading to the formation of chromosomal abnormalities.
Expression of BCR/ABL leads to increased chromosomal translocations after DNA damage
To see the effect of BCR/ABL expression on chromosomal instability after genotoxic stress, we performed SKY analysis focusing on metaphase preparations from the same experiment as above but selected metaphases that did not contain extensive abnormalities. Even in those selected metaphases, a number of cells showed complex chromosomal translocations involving three or more chromosomes (Figure 2a). The majority of cells demonstrated new chromosomal abnormalities, including simple unbalanced chromosomal translocations and gains and losses of whole chromosomes. An example of SKY karyotype from BCR/ABL-expressing cells is shown in Figure 2b. These results suggest that the expression of BCR/ABL significantly alters the response to DNA damage leading to DSBs that are repaired through inappropriate mechanisms. To quantify the relative incidence of chromosomal abnormalities in cells growing in IL3 as compared to those expressing BCR/ABL, full karyotypic analysis was performed on 8 and 12, metaphases respectively. The number of translocations was scored and the number of translocations per cell was calculated. Results are shown in Figures 2c and d. Note that for purposes of this analysis, metaphases containing more than 10 chromosomal translocations per cell were scored as a maximum of 10. Such metaphases were present in BCR/ABL-expressing cells and none were seen in cells growing in IL3. As can be seen, cells growing in IL3 averaged less than one new translocation per metaphase after 10 μm etoposide (Figure 2c). In contrast, cells expressing BCR/ABL showed an average of more than five new translocations per cell. Comparison of groups treated with 10 μm etoposide demonstrated that differences between groups were highly significant (P=0.00005) with BCR/ABL showing rates of translocations that were 8.04 times higher than IL3. Analysis of numerical alterations (gains or losses of whole chromosomes) demonstrated a complex pattern. After the treatment of cells growing in IL3 with 6 μm etoposide, these cells showed an increase in numerical alterations compared to cells expressing BCR/ABL and treated with 6 μm etoposide (Figure 2d). In contrast, after treatment with 10 μm etoposide, BCR/ABL-expressing cells had rates of numeric alterations that were 9.34-fold higher than IL3 at the same level (P=0.00034). It is not clear at this time whether there is in fact a nonlinear dose–response to etoposide with low (6 μm) doses of etoposide or whether the results shown here are a result of the modest number of metaphases examined.
Figure 2.

BCR/ABL-expressing cells have chromosomal abnormalities after treatment with etoposide. Cells were treated as in Figure 1; that is, Ba/F3 pTET-On p210 cells were grown in interleukin 3 (IL3) or doxycycline, treated with etoposide for 2 h, washed and replated in IL3 or doxycycline for 48 h. Metaphase spreads were prepared and spectral karyotyping was performed on a minimum of 20 metaphases. Note that only cells without gross chromosomal abnormalities were chosen for analysis. (a) Bizarre chromosomal abnormalities present in BCR/ABL-expressing cells representing complex translocations. (b) Typical karyotype analysis from BCR/ABL-expressing cell, demonstrating multiple translocations. (c) Graphic display of increase in chromosomal translocations in BCR/ABL-expressing cells. (d) Graph of numeric alterations in chromosome number in cells incubated in IL3 (gray bars) and expressing BCR/ABL (black bars).
Primary human CML cells have equivalent short-term survival after etoposide but increased DNA damage
To determine whether the results above are physiologically relevant, we performed similar experiments in primary human cells. For these experiments, we compared normal bone marrow CD34+ progenitor cells to CD34+ cells from CML patients (Figure 3). As seen (Figure 3a), the survival of these purified cell populations in short-term liquid culture assays (48 h) is equivalent. To assay DSBs, we performed the comet assay. The comet assay is a single-cell gel electrophoresis assay that allows for quantitative evaluation of DSBs. Interestingly, we consistently found that untreated CML samples had a modest increase in the olive tail moment over normal CD34+ cells (Figure 3b, untreated). This increase was greater in CML blast crisis samples than chronic phase samples, but these variations are small and of unclear significance. After etoposide treatment (10 μm), as we have shown earlier for BCR/ABL-expressing cell lines, CML samples have a relative increase in DSBs at 2 h and delayed repair of these breaks (Figure 3b) over 48 h. These results demonstrate that primary CML cells have an impaired response to DNA damage leading to delayed repair of DNA DSBs. Because of limiting cell numbers, it was not feasible to perform these experiments in the presence of an ABL kinase inhibitor.
Figure 3.

Primary human chronic myelogeneous leukemia (CML) cells have increased DNA double-strand breaks after DNA damage but equivalent cell survival. CD34+ cells were purified either from cryopreserved CML patient samples or from normal volunteer bone marrow samples. Cells were incubated in interleukin 3 (IL3), IL6 and stem cell factor (SCF) and treated with etoposide at indicated concentrations for 2 h. (a) Cells were washed and re-plated in the same media for 48 h. Cell survival was measured using XTT assay and compared with untreated cells. (b) Cells were treated as in (a). At the indicated time, cells were analyzed for DNA double-strand breaks using the comet assay as described in Materials and methods. AP, accelerated phase; CP, chronic phase; MBC, myeloid blast crisis. Numbers (579, 547, 631 and 623) indicate distinct patient samples. Error bars represent standard deviation.
CML cells develop new chromosomal translocations after DNA damage
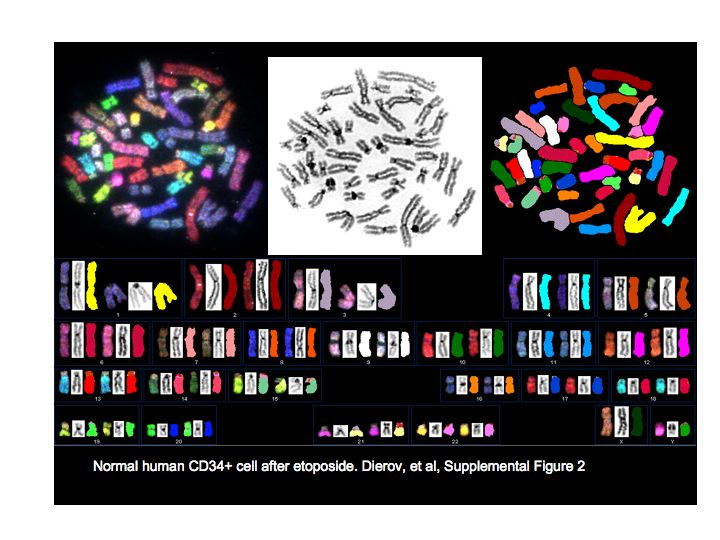
CML blast crisis is associated with new chromosomal translocations. If CML cells have delayed and error-prone DNA repair, they may develop chromosomal translocations, some of which may lead to disease progression. To determine whether CML cells have error-prone DNA repair, we again assayed cells after treatment with etoposide for chromosomal abnormalities using SKY (Figure 4a). Analysis confirmed a t(9:22) translocation in all CML samples and this abnormality was found but not scored in karyotypic analysis. Normal bone marrow CD34+ cells did not develop spontaneous or etoposide-induced chromosomal abnormalities during the 48 h of culture (Figure 4b, black bars; Supplementary Figure 2). Untreated CD34+ CML cells did show an average of one chromosomal translocation per metaphase when examined after 48 h of tissue culture (n=3) and acquired an average of three new translocations per metaphase after etoposide treatment. No consistent changes in chromosome numbers were seen in normal or CML samples. Taken together, these data indicate that CML CD34+ cells survive etoposide treatment with an increased number of chromosomal translocations.
Figure 4.
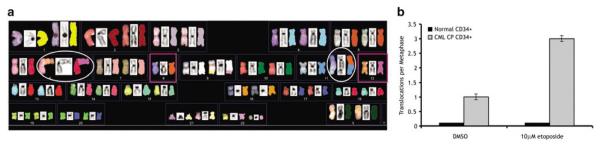
Primary human chronic myelogeneous leukemia (CML) cells have increased chromosomal abnormalities after DNA damage. CML CD34+ cells were treated as in Figure 3. After 48 h of repair, metaphase spreads were prepared and analyzed by spectral karyotyping. Results are summarized from 20 to 25 metaphases from three different CML patient samples and three normal controls. (a) Representative karyotype from a CML sample demonstrating the Philadelphia chromosome and additional translocations and chromosomal losses. (b) Summary of data from all cells. Black bars, normal cells; gray bars, CML cells. Error bars represent standard deviation.
Etoposide induces a similar decrease in colony-forming activity in normal and CML cells
The cells that give rise to CML blast crisis arise from hematopoietic progenitor or stem cells. Earlier reports have shown contrasting results as to the result of DNA damage on survival of CML colony-forming cells. To re-assess this question, we assayed colony-forming activity from eight CML samples and four normal controls after a 2-h treatment with 10 μm etoposide (Figure 5). Importantly, colony-forming activity of CML samples in our experiments was highly variable ranging from as few as 20 colonies per 10 000 cells to as high as 1000 colonies per 10 000 cells. Colony-forming activity of normal cells was more consistent ranging from 25 to 120 colonies per 10 000 cells. Note that Figure 5a is shown with a log scale vs Figure 5b that has a linear scale. Etoposide decreased colony-forming activity in all CML and normal samples tested. However, when the percentage decrease in colony-forming activity is calculated (Figures 5c and d), there is a consistent 60–70% decrease in colony-forming activity after etoposide treatment in most CML samples and normal bone marrows. Similar results are seen in CML and normal cells after more physiologic stress induced with aphidicolin (data not shown). Overall, this result indicates to us that, based on these parallel experiments, CML cells survive and are capable of forming colonies despite the increase in DSBs demonstrated above. This would provide a mechanism for persistence of cells containing damaged DNA that may develop into the precursor cells giving rise to CML blast crisis.
Figure 5.

Chronic myelogeneous leukemia (CML) cells do not have an alteration in progenitor cell survival. Mononuclear cells or purified CD34+ cells from CML patients or normal donors (as indicated) were treated with etoposide (10 μm) for 2 h, washed and plated in methylcellulose media. Colony numbers were scored on day 14. (a, b) Actual colony numbers are displayed. Note that the Y axis is a log scale in (a), whereas Y axis in (b) is a linear scale. (c, d) Same data as in (a), (b) standardized to make untreated cells equal to 100%. Error bars represent standard deviation.
Discussion
The pathogenic role of BCR/ABL in CML chronic phase is well established. However, the pathogenesis of disease progression, which occurs in 100% of untreated CML patients, remains unclear. We have demonstrated here that BCR/ABL expression leads to error-prone DNA repair and the formation of new chromosomal translocations. An increase in DNA damage after BCR/ABL expression occurs both after induction of DNA damage with etoposide and after replication stress (data not shown). Importantly, we demonstrate here that these effects are seen in primary CML cells as well as in BCR/ABL-expressing cell lines. A recent paper found similar results in 32D cells but did not study primary CML cells.25 In particular, CML cells have a delay in the repair of DSBs and an increase in chromosomal translocations after DNA damage, despite an overall equivalent level of survival after low doses of etoposide. This suggests a model in which BCR/ABL kinase activity alters the apoptotic threshold in CML progenitor cells allowing cells to survive despite damaged DNA and creating the cellular `seed' for development of CML blast crisis. A critical question regarding these effects is whether the BCR/ABL effects on DNA damage are dependent on its kinase activity and will be inhibited by ABL kinase inhibitor therapy. Unfortunately, we were unable to perform experiments in primary cells in the presence of such inhibitors.
There have been several mechanisms proposed whereby BCR/ABL inhibits DNA repair. One group suggested that BCR/ABL alters the expression of RAD51; others have suggested that BCR/ABL alters the expression of BRCA1.14,19 We have not been able to confirm either of these results and we suggested earlier that BCR/ABL alters the function of the DNA damage sensor, ataxia telangiectasia and Rad 3 related (ATR) protein.17 This assessment was based on altered phosphorylation of the ATR substrate, Chk1 after DNA damage. This observation was not reproduced in recent experiments by Nieborowska-Skorska26 and, in fact, using a different phospho-Chk1 antibody than we originally used, we have also not consistently reproduced this result (data not shown). Analysis of other ATR effector functions, including association of Dbf4 and cdc7 as we originally described, is ongoing in our laboratory.17 However, at this point, we must conclude that the mechanism whereby BCR/ABL alters DNA damage remains controversial. Descriptive data including the effect of BCR/ABL on radioresistant DNA synthesis and induction of fragile site damage after DNA damage (BAB and MC, unpublished results) suggest a defect in sensing of DNA damage during an intra-S phase checkpoint. Recent results suggest that BCR/ABL expression leads to centrosomal abnormalities.27 Alternatively, earlier results suggest that reactive oxygen species contribute to BCR/ABL induction of DNA damage and chromosomal instability.15
The relevance of these results for the treatment of CML and understanding the biology of activated tyrosine kinases in human malignancies require further study. As noted, we have not been able to document a necessary role for the BCR/ABL kinase activity in the induction of chromosomal instability. Current results with the ABL kinase inhibitor, imatinib, suggest that patients remain well with only a small percentage of patients progressing to CML blast crisis for at least 5 years on therapy.28 Even patients with chromosomal aberrations, which develop on Imatinib, appear to have a favorable prognosis.29 These results suggest that clinically relevant chromosomal instability may be suppressed by imatinib, but further studies are required to understand the role of the BCR/ABL kinase in chromosomal instability. Furthermore, our results regarding chromosomal changes in primary patient samples are based on comparison of a small number of samples and, given the heterogeneity of patient samples, may not be conclusive. This statistical issue is important in applying our results to other diseases associated with activated tyrosine kinases. Many human malignancies are associated with activating mutations of tyrosine kinase oncogenes. These oncogenes clearly induce dysregulated cell growth but whether genomic instability is a common phenotype of mutations associated with activated tyrosine kinases also remains unclear. It may be that the level of genomic instability is modest but pathologically important.
In summary, we have shown that in both murine cell lines and primary human CML cells, BCR/ABL expression is associated with a delay in the repair of DNA DSBs, which leads to error-prone DNA repair and chromosomal abnormalities after DNA damage. BCR/ABL expression can alter the apoptotic threshold of cells under some conditions but this is not seen in primary CML cells after treatment with etoposide. Taken together, these results clearly suggest that BCR/ABL is the sole cause of CML, including its role in the induction of myeloproliferation associated with chronic phase CML and chromosomal instability, which, in untreated patients, leads to the development of CML blast crisis.
Supplementary Material
Acknowledgements
MC is a Clinical Scholar of the Leukemia Lymphoma Society and is supported by NCI R01CA100885. This research was supported (in part) by the Intramural Research Program of the National Institutes of Health, National Cancer Institute, Center for Cancer Research. We thank Tomasz Skorski and colleagues for sharing data prior to publication. JD, PVS, BAB and HP-N performed experiments. MEP performed statistical analysis. TR provided reagents and expertise. MC supervised the experiments and wrote the papers.
Footnotes
Supplementary Information accompanies the paper on the Leukemia website (http://www.nature.com/leu)
References
- 1.Druker BJ, Talpaz M, Resta DJ, Peng B, Buchdunger E, Ford JM, et al. Efficacy and safety of a specific inhibitor of the BCR-ABL tyrosine kinase in chronic myeloid leukemia. N Engl J Med. 2001;344:1031–1037. doi: 10.1056/NEJM200104053441401. [DOI] [PubMed] [Google Scholar]
- 2.Pear WS, Miller JP, Xu L, Pui JC, Soffer B, Quackenbush RC, et al. Efficient and rapid induction of a chronic myelogenous leukemia-like myeloproliferative disease in mice receiving P210 bcr/abl-transduced bone marrow. Blood. 1998;92:3780–3792. [PubMed] [Google Scholar]
- 3.Wong S, Witte ON. The BCR-ABL story: bench to bedside and back. Annu Rev Immunol. 2004;22:247–306. doi: 10.1146/annurev.immunol.22.012703.104753. [DOI] [PubMed] [Google Scholar]
- 4.Giehl M, Fabarius A, Frank O, Hochhaus A, Hafner M, Hehlmann R, et al. Centrosome aberrations in chronic myeloid leukemia correlate with stage of disease and chromosomal instability. Leukemia. 2005;19:1192–1197. doi: 10.1038/sj.leu.2403779. [DOI] [PubMed] [Google Scholar]
- 5.Gribble SM, Sinclair PB, Grace C, Green AR, Nacheva EP. Comparative analysis of G-banding, chromosome painting, locus-specific fluorescence in situ hybridization, and comparative genomic hybridization in chronic myeloid leukemia blast crisis. Cancer Genet Cytogenet. 1999;111:7–17. doi: 10.1016/s0165-4608(98)00213-1. [DOI] [PubMed] [Google Scholar]
- 6.Johansson B, Fioretos T, Mitelman F. Cytogenetic and molecular genetic evolution of chronic myeloid leukemia. Acta Haematol. 2002;107:76–94. doi: 10.1159/000046636. [DOI] [PubMed] [Google Scholar]
- 7.Fialkow PJ, Jacobson RJ, Papayannopoulou T. Chronic myelocytic leukemia: clonal origin in a stem cell common to the granulocyte, erythrocyte, platelet and monocyte/macrophage. Am J Med. 1977;63:125–130. doi: 10.1016/0002-9343(77)90124-3. [DOI] [PubMed] [Google Scholar]
- 8.Gaymes TJ, Mufti GJ, Rassool FV. Myeloid leukemias have increased activity of the nonhomologous end-joining pathway and concomitant DNA misrepair that is dependent on the Ku70/86 heterodimer. Cancer Res. 2002;62:2791–2797. [PubMed] [Google Scholar]
- 9.Amos TA, Lewis JL, Grand FH, Gooding RP, Goldman JM, Gordon MY. Apoptosis in chronic myeloid leukaemia: normal responses by progenitor cells to growth factor deprivation, X-irradiation and glucocorticoids. Br J Haematol. 1995;91:387–393. doi: 10.1111/j.1365-2141.1995.tb05308.x. [DOI] [PubMed] [Google Scholar]
- 10.Bedi A, Barber JP, Bedi GC, el-Deiry WS, Sidransky D, Vala MS, et al. BCR-ABL-mediated inhibition of apoptosis with delay of G2/M transition after DNA damage: a mechanism of resistance to multiple anticancer agents. Blood. 1995;86:1148–1158. [PubMed] [Google Scholar]
- 11.Bedi A, Zehnbauer BA, Barber JP, Sharkis SJ, Jones RJ. Inhibition of apoptosis by BCR-ABL in chronic myeloid leukemia. Blood. 1994;83:2038–2044. [PubMed] [Google Scholar]
- 12.Laneuville P, Sun G, Timm M, Vekemans M. Clonal evolution in a myeloid cell line transformed to interleukin-3 independent growth by retroviral transduction and expression of p210bcr/abl. Blood. 1992;80:1788–1797. [PubMed] [Google Scholar]
- 13.Nowicki MO, Falinski R, Koptyra M, Slupianek A, Stoklosa T, Gloc E, et al. BCR/ABL oncogenic kinase promotes unfaithful repair of the reactive oxygen species-dependent DNA double-strand breaks. Blood. 2004;104:3746–3753. doi: 10.1182/blood-2004-05-1941. [DOI] [PubMed] [Google Scholar]
- 14.Slupianek A, Schmutte C, Tombline G, Nieborowska-Skorska M, Hoser G, Nowicki MO, et al. BCR/ABL regulates mammalian RecA homologs, resulting in drug resistance. Mol Cell. 2001;8:795–806. doi: 10.1016/s1097-2765(01)00357-4. [DOI] [PubMed] [Google Scholar]
- 15.Koptyra M, Falinski R, Nowicki MO, Stoklosa T, Majsterek I, Nieborowska-Skorska M, et al. BCR/ABL kinase induces self-mutagenesis via reactive oxygen species to encode imatinib resistance. Blood. 2006;108:319–327. doi: 10.1182/blood-2005-07-2815. [DOI] [PMC free article] [PubMed] [Google Scholar]
- 16.Sattler M, Verma S, Shrikhande G, Byrne CH, Pride YB, Winkler T, et al. The BCR/ABL tyrosine kinase induces production of reactive oxygen species in hematopoietic cells. J Biol Chem. 2000;275:24273–24278. doi: 10.1074/jbc.M002094200. [DOI] [PubMed] [Google Scholar]
- 17.Dierov J, Dierova R, Carroll M. BCR/ABL translocates to the nucleus and disrupts an ATR-dependent intra-S phase checkpoint. Cancer Cell. 2004;5:275–285. doi: 10.1016/s1535-6108(04)00056-x. [DOI] [PubMed] [Google Scholar]
- 18.Deutsch E, Dugray A, AbdulKarim B, Marangoni E, Maggiorella L, Vaganay S, et al. BCR-ABL down-regulates the DNA repair protein DNA-PKcs. Blood. 2001;97:2084–2090. doi: 10.1182/blood.v97.7.2084. [DOI] [PubMed] [Google Scholar]
- 19.Deutsch E, Jarrousse S, Buet D, Dugray A, Bonnet ML, Vozenin-Brotons MC, et al. Down-regulation of BRCA1 in BCR-ABL-expressing hematopoietic cells. Blood. 2003;101:4583–4588. doi: 10.1182/blood-2002-10-3011. [DOI] [PubMed] [Google Scholar]
- 20.Klucher KM, Lopez DV, Daley GQ. Secondary mutation maintains the transformed state in BaF3 cells with inducible BCR/ABL expression. Blood. 1998;91:3927–3934. [PubMed] [Google Scholar]
- 21.Singh NP, McCoy MT, Tice RR, Schneider EL. A simple technique for quantitation of low levels of DNA damage in individual cells. Exp Cell Res. 1988;175:184–191. doi: 10.1016/0014-4827(88)90265-0. [DOI] [PubMed] [Google Scholar]
- 22.Liyanage M, Coleman A, du Manoir S, Veldman T, McCormack S, Dickson RB, et al. Multicolour spectral karyotyping of mouse chromosomes. Nat Genet. 1996;14:312–315. doi: 10.1038/ng1196-312. [DOI] [PubMed] [Google Scholar]
- 23.Padilla-Nash HM, Heselmeyer-Haddad K, Wangsa D, Zhang H, Ghadimi BM, Macville M, et al. Jumping translocations are common in solid tumor cell lines and result in recurrent fusions of whole chromosome arms. Genes Chromosomes Cancer. 2001;30:349–363. doi: 10.1002/gcc.1101. [DOI] [PubMed] [Google Scholar]
- 24.McCullogh C, Searle S. Generalized, linear, and mixed models. John Wiley & Sons, Inc; Hoboken, NJ, USA: 2001. [Google Scholar]
- 25.Koptyra M, Cramer K, Slupianek A, Richardson C, Skorski T. BCR/ABL promotes accumulation of chromosomal aberrations induced by oxidative and genotoxic stress. Leukemia. 2008;22:1969–1972. doi: 10.1038/leu.2008.78. [DOI] [PMC free article] [PubMed] [Google Scholar]
- 26.Nieborowska-Skorska M, Stoklosa T, Datta M, Czechowska A, Rink L, Slupianek A, et al. ATR-Chk1 axis protects BCR/ABL leukemia cells from the lethal effect of DNA double-strand breaks. Cell Cycle. 2006;5:994–1000. doi: 10.4161/cc.5.9.2722. [DOI] [PubMed] [Google Scholar]
- 27.Giehl M, Fabarius A, Frank O, Erben P, Zheng C, Hafner M, et al. Expression of the p210BCR-ABL oncoprotein drives centrosomal hypertrophy and clonal evolution in human U937 cells. Leukemia. 2007;21:1971–1976. doi: 10.1038/sj.leu.2404834. [DOI] [PubMed] [Google Scholar]
- 28.Druker BJ, Guilhot F, O'Brien SG, Gathmann I, Kantarjian H, Gattermann N, et al. Five-year follow-up of patients receiving imatinib for chronic myeloid leukemia. N Engl J Med. 2006;355:2408–2417. doi: 10.1056/NEJMoa062867. [DOI] [PubMed] [Google Scholar]
- 29.Deininger MW, Cortes J, Paquette R, Park B, Hochhaus A, Baccarani M, et al. The prognosis for patients with chronic myeloid leukemia who have clonal cytogenetic abnormalities in Philadelphia chromosome-negative cells. Cancer. 2007;110:1509–1519. doi: 10.1002/cncr.22936. [DOI] [PubMed] [Google Scholar]
Associated Data
This section collects any data citations, data availability statements, or supplementary materials included in this article.