Abstract
Ovarian cystic masses include a spectrum of benign, borderline and high grade malignant neoplasms. Imaging plays a crucial role in characterization and pretreatment planning of incidentally detected or suspected adnexal masses, as diagnosis of ovarian malignancy at an early stage is correlated with a better prognosis. Knowledge of differential diagnosis, imaging features, management trends and an algorithmic approach of such lesions is important for optimal clinical management. This article illustrates a multi-modality approach in the diagnosis of a spectrum of ovarian cystic masses and also proposes an algorithmic approach for the diagnosis of these lesions.
Keywords: Ovarian, Neoplasm, Ultrasound, Computed tomography, Magnetic resonance imaging
INTRODUCTION
Ovarian cancer is the second most common gynecological malignancy with the highest mortality rate of all gynecological malignancies and an overall 5-year survival rate of 46%[1]. An important reason for this high mortality is the extensive disease at the time of diagnosis which makes it important to characterize these lesions early in its course. Many of the ovarian lesions are incidentally detected, for which imaging plays an important role in treatment planning by characterization of these lesions. An accurate characterization of a lesion as benign may obviate the need for surgery, while an indeterminate or malignant lesion needs surgical intervention and perhaps detailed chemotherapeutic planning.
TAXONOMY OF CYSTIC OVARIAN MASSES
Adnexal cystic masses can be broadly classified as ovarian and extraovarian. The most commonly encountered extraovarian masses are overwhelmingly benign, including hydrosalpinx, hematosalpinx, paraovarian/paratubal cysts and peritoneal inclusion cysts. In this article, special emphasis will be placed on cystic ovarian masses, which can broadly be classified as benign, borderline (low malignant potential) and malignant lesions[2-5] (Figure 1).
Figure 1.
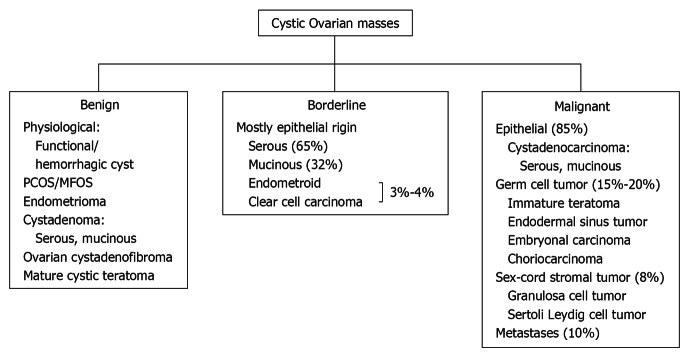
Classification of cystic ovarians lesions. Adapted from[2-5].
MULTI-MODALITY IMAGING WORKUP
Ultrasonography (US) remains the primary modality of choice for evaluating pelvic masses, due to its easy availability, high-sensitivity, cost-effectiveness and lack of ionizing radiation. Transvaginal US (TVUS) also remains helpful in differentiating various simple benign entities from indeterminate or malignant lesions. Color Doppler has been proposed in differentiating benign from malignant neoplasms, based on the fact that malignant neoplasms usually have a low resistance index. A resistive index of less than 0.4 and a pulsatility index of less than 1.0 are considered suspicious of malignancy. However, due to overlap of these findings in benign and malignant neoplasms, the clinical utility of Doppler imaging is limited[6].
Overall, ultrasound has variable sensitivity and specificity for identifying and characterizing borderline or malignant lesions which may partly be attributed to operator dependency and/or patient’s body habitus[7-10].
Computed tomography
Many ovarian lesions detected by computed tomography (CT) are incidental findings on studies performed for nonspecific symptoms, such as abdominal distension, pain and urinary symptoms[11]. CT has a limited role in primary evaluation and characterization of ovarian cystic lesions, except for mature cystic teratoma which can be confidently characterized due to the presence of macroscopic fat and calcifications. However, CT is the imaging modality of choice to evaluate the extent of the disease in pretreatment planning, including cytoreduction and for post treatment follow up[11]. The sensitivity and specificity of CT in the staging of ovarian carcinoma has been described to be 50% and 92% respectively in one study[12].
Magnetic resonance imaging
Due to its better tissue characterization and multiplanar capabilities with excellent anatomical delineation, contrast enhanced magnetic resonance imaging (MRI) helps in differentiating benign from malignant ovarian masses, in most cases[13]. In one study, MRI demonstrated a sensitivity and specificity of 100% and 94%, respectively, in the evaluation of sonographically indeterminate ovarian lesions[14]. Due to its limited availability and relatively high cost, MRI is frequently utilized as a problem solving tool in indeterminate lesions.
Positron emission tomography/CT
Although this modality has recently shown an expanding utilization for treatment planning and follow-up, it is not a recommended modality for primary detection of cancer[11,15]. Positron emission tomography (PET)/CT have been described to show false negative results in borderline indeterminate ovarian neoplasms[11]. Since increased FDG activity has been demonstrated with endometriosis, fibroids and also normal follicles in premenopausal women, it may alter the cancer staging[15-17]. However, increased FDG uptake in postmenopausal women is always abnormal. It has been demonstrated that combined PET/CT has a higher sensitivity and specificity in detecting tumor recurrence than with CT or MRI alone[18-20].
BENIGN CYSTIC OVARIAN MASSES
Functional/hemorrhagic cysts
Most ovarian cysts in the reproductive age group are physiological or functional in nature, including dominant follicles, follicular cysts which result from failure of the follicle to rupture or regress, and corpus luteal cysts which may contain hemorrhage[21,22]. On ultrasound, functional cysts are thin walled (< 3 mm), unilocular, with posterior acoustic enhancement[23] (Figure 2A). Complex cysts may present as reticular echoes or a heterogeneous clot from hemorrhage. The presence of solid components, papillary projections, intralesional vascularity or nodular septa is a high concern for malignancy[24,25]. In premenopausal women, cysts with uniform internal echoes, reticulations or septations may represent hemorrhagic functional cysts or an endometrioma. A follow up ultrasound in 6-12 wk should be performed in these cases[26]. A functional hemorrhagic cyst shows complete interval resolution whereas an endometrioma persists or even slightly increases in size intervalley (Figure 2B). On MRI, most functional cysts have low signal intensity on T1-weighted images and very high signal intensity on T2-weighted images (Figure 3). Hemorrhagic corpus luteum cysts have a characteristic appearance of blood products manifested by relatively high signal intensity on T1-weighted images and intermediate to high signal intensity on T2-weighted images and this may pose a difficulty in differentiation from endometrioma if no prior imaging is available[27-29] (Figure 4).
Figure 2.
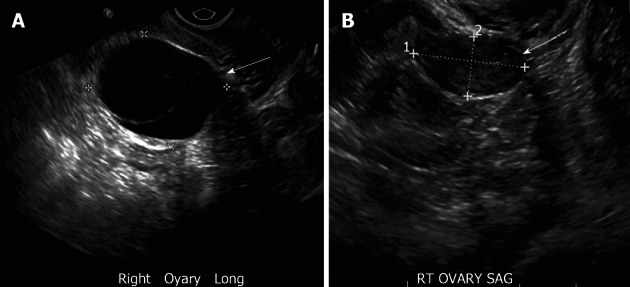
Functional ovarian cyst. A 26-year-old woman with right adnexal pain. A: Transvaginal ultrasonography (TVUS) demonstrates two adjacent well defined thin walled cystic lesions (arrow) in the right ovary with no internal echoes or debris; B: TVUS (for some pelvic discomfort) in a 3 mo interval shows complete interval resolution of the right ovarian cysts, suggesting functional cysts.
Figure 3.
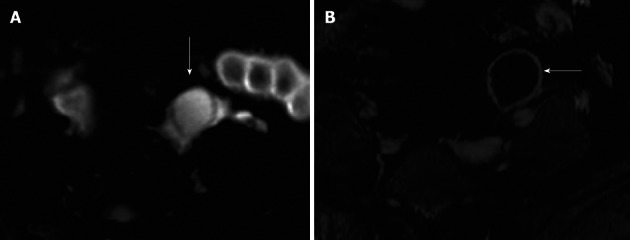
Functional cyst on magnetic resonance imaging. A 31-year-old woman with magnetic resonance abdomen pelvis performed for inflammatory bowel disease evaluation. A: Axial fat suppressed T2 weighted image with fat saturation demonstrates high signal intensity focus in the left ovary (arrow), without any internal debris or septation; B: Axial post contrast fat suppressed T1 weighted image showing thin enhancing wall of the cyst without internal enhancement or septation (arrow).
Figure 4.

Hemorrhagic cyst. A 33-year-old woman for evaluation of adenomyosis. (A) Axial T1 weighted image demonstrates a high signal intensity of the lesion in the right ovary (arrow), which remains hyperintense on fat suppressed T2 weighted image (B) without internal debris or septations. The lesion remains hyperintense with no significant enhancement on post contrast fat suppressed T1 weighted images. Ut: Uterus.
Polycystic ovaries
Polycystic ovarian syndrome (PCOS) is one of the most common human endocrinopathies, affecting 5%-10% of women of reproductive age[30]. Not all patients with ultrasound features of PCO have clinical PCOS, which is characterized by menstrual irregularities, hirsuitism, obesity and sclerotic ovaries[31]. TVUS is currently the gold standard for diagnosing PCO. The classic ultrasound feature is an enlarged ovary with 10 or more peripherally arranged cysts, each cyst of 2-8 mm diameter, with an echogenic central stroma[31]. MRI is rarely utilized in primary evaluation of PCO as it does not add to information provided by TVUS. The best sequence is T2 weighted images in the long and short axis of the uterus, demonstrating peripherally arranged uniform sized high signal intensity cysts with hypointense central stroma (Figure 5).
Figure 5.
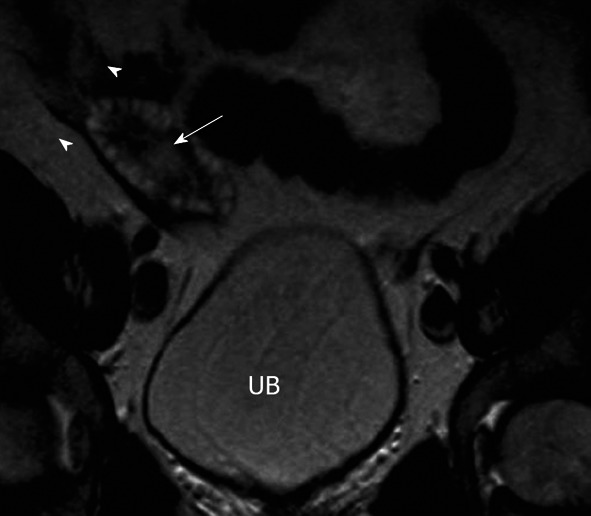
Polycystic ovaries. A 25-year-old woman with obesity, infertility and altered LH/FSH ratio. Coronal T2 weighted image through the pelvis demonstrates mildly enlarged right ovary with several small symmetric peripherally arranged hyperintense cysts (arrowheads) with relatively hypointense central stroma (arrow). UB: Urinary bladder. Similar appearance of left ovary was noted.
Endometrioma
The ectopic implantation of endometrial tissue outside the uterus is termed as endometriosis. It is commonly seen in child bearing age with 80% implanted in the ovary[32,33]. Endometriosis may be clinically silent or may present with pelvic pain, dysmenorrhea and infertility. Sonographically, endometrioma are cystic masses with diffuse low level internal echoes. However, they can have a varied presentation ranging from cystic to complex, with hyperechoic foci secondary to a cholesterol cleft or blood clot in the wall[23] (Figure 6A). Endometriomas and implants may mimic malignant lesions on CT. MRI usually reveals very high signal intensity on T1-weighted images (light-bulb) and intermediate to low signal intensity on T2-weighted images classically labeled gray haze/shade, which is attributed to hemoglobin degradation products in various stages (deoxyhemoglobin, methemoglobin and iron products) and decreased free water content[34-36]. Generally, high signal intensity on T1-weighted images could be seen secondary to either fat or blood and persistent high signal on fat saturated T1-weighted image confirms the absence of fat in the lesion (Figures 6B-D and 7). Other MR findings could include high signal intensity on T1- and T2-weighted images and adhesion/tethering to the adjacent structures. The presence of multiple high signal intensity foci on T1-weighted images in both ovaries also favors the diagnosis of endometrioma. Less than 1% of endometriosis is associated with malignancy, particularly endometrioid or clear cell adenocarcinoma[37]. Malignant transformation of endometriomas has been rarely described to demonstrate low signal intensity on T2-weighted images with post contrast enhancing mural nodules[7]. The mural nodular enhancement is more conspicuous on subtracted pre and post contrast enhanced images[37].
Figure 6.
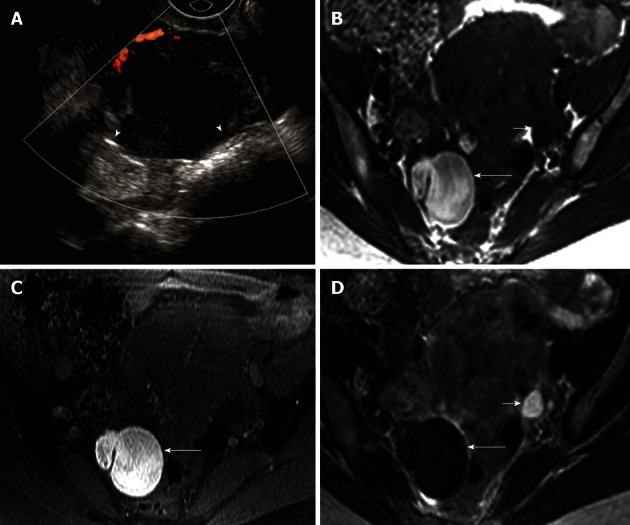
Endometrioma. A 39-year-old woman with right adnexal pain and mass of per vaginum examination. A: Transvaginal ultrasonography showing a complex lesion in the right ovary with mildly thickened wall and uniform internal echoes (arrowheads), without intralesional vascularity; B-D: Axial fat suppressed T1 weighted image without fat saturation (B) and with fat saturation (C) demonstrate hyperintense lesion in the right ovary (long arrow) which is relatively hypointense on T2 weighted image - “T2 shading” (D). Normal left ovary with follicle (short arrow).
Figure 7.
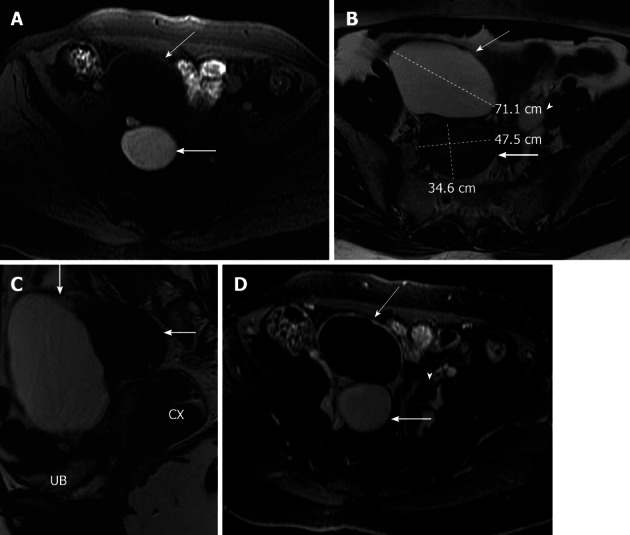
Ovarian serous cystadenoma and endometrioma. A 41-year-old woman with pelvic mass. Axial fat suppressed T1 weighted image (A), axial and sagittal T2 weighted images (B and C) and axial post contrast T1 weighted image (D) showing a right adnexal lesion posteriorly (thick arrow), which has a high signal intensity on T1 weighted image, low signal intensity on T2 weighted image (T2 shading), without any internal debris or septation. Another 7.2 cm lesion in the right adnexa anteriorly (thin arrow) demonstrating low signal intensity on T1 weighted image, high signal intensity on T2 weighted image without internal septations or solid component. Both lesions demonstrate no post contrast enhancement. Left ovary with follicles also noted (arrowhead). On surgery and histopathology, two cystic lesions were seen arising from the right ovary, the posterior lesion was endometrioma and the anterior lesion was serous cystadenoma. UB: Urinary bladder; CX: Cervix.
BENIGN EPITHELIAL OVARIAN TUMOR
Benign epithelial tumors are primarily cystic in appearance and seen in younger age groups. On the other hand, the malignant counterparts are cystic with predominant solid components[38]. The two most common subtypes of epithelial neoplasms are serous and mucinous tumors.
Serous cystadenoma are usually thin walled (less than 3 mm) cysts; unilocular or rarely multilocular. Serous cystadenoma usually demonstrate homogeneous high signal intensity on T2-weighted images and low signal intensity on T1-weighted images and do not exhibit significant post contrast enhancement[39] (Figure 7). They are usually bilateral and smaller than mucinous cystadenomas.
Mucinous cystadenoma are larger in size than serous cystadenoma. On US and MRI, it presents as multilocular (honeycomb like locules) with a thin regular wall and septa without any endo or exocytic vegetation and shows no significant post contrast enhancement[39] (Figure 8). The MR signal intensity of mucinous cystadenoma depends on the hydration of the mucin, which when dehydrated can be of low signal intensity on T2-weighted images.
Figure 8.
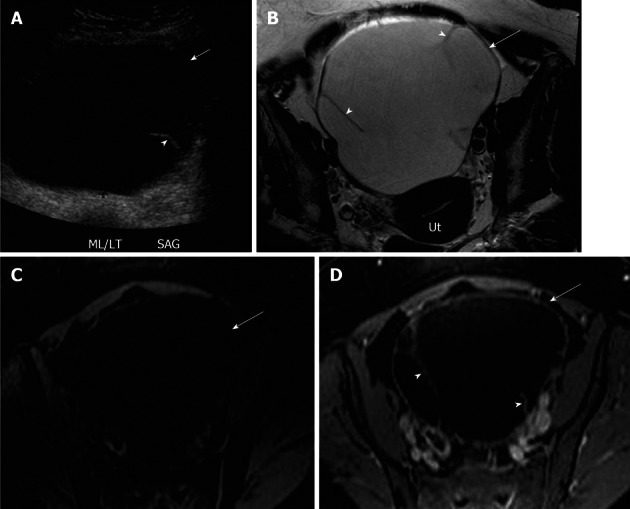
Mucinous cystadenoma. A 44-year-old woman with large pelvic mass. A: Transabdominal pelvic ultrasound demonstrates a large cystic lesion (arrow) in the mid pelvis with a thin septation (arrowhead); B-D: Axial T2 weighted image (B), axial pre contrast (C) and fat saturated post contrast T1 weighted image (D), demonstrates a large left ovarian cystic lesion (arrow) with several thin septations (arrowheads). The lesion has a low signal intensity on T1 weighted image and high signal on T2 weighted image and hypointense septae, with no significant post contrast enhancement. Ut: Uterus.
Ovarian cystadenofibroma is an uncommon epithelial ovarian neoplasm in which fibrous stroma is the dominant component in addition to the epithelial lining. These are usually benign, occurring in the reproductive period and an accurate preoperative diagnosis may contribute to avoiding surgical intervention[40,41]. Half of ovarian cystadenofibromas are purely cystic and the other half are complex cystic masses with a solid component and/or thick septa, thereby mimicking a malignant lesion[42]. Imaging findings of purely cystic cystadenofibroma are similar to cystadenomas; however, on microscopy they have small foci of fibrous stroma[43]. On ultrasound and CT, cystadenofibroma may appear as a complex cystic or solid mass mimicking malignancy. Characteristic MR imaging features of these tumors on T2-weighted images include very low signal intensity of the solid component (relatively isointense to the skeletal muscle) and a hyperintense cystic component[44] (Figure 9). Diffuse or partial thickening of the cyst wall with low signal intensity on T2-weighted images may be also seen with or without a solid component[44,45]. These solid components, however, demonstrate mild post contrast enhancement.
Figure 9.
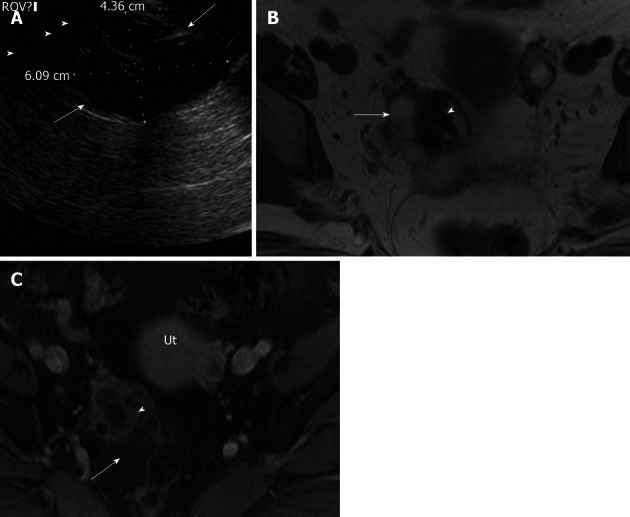
Ovarian cystadenofibroma. A 35-year-old women with adnexal fullness and dysuria. (A) Transvaginal ultrasonography demonstrates a complex cystic mass in the right ovary with thick septations (arrow). Axial T2 weighted image (B), axial post contrast T1 weighted images (C) through the pelvis, shows the right ovarian complex cystic mass. The cystic component (arrow) is of high signal intensity on T2 weighted image without post contrast enhancement. The solid components demonstrate very low signal intensity on T2 weighted image (arrowhead) with mild post contrast enhancement, relative to uterus (Ut). On surgery, pathologically confirmed benign cystadenofibroma.
Mature cystic teratoma is commonly seen in women less than 45 years of age and is composed of tissues from all three embryogenic germ cell layers, constituting sebaceous material, hair follicle, skin glands and muscles. They usually demonstrate a raised protuberance called a Rokitansky nodule into the cyst within which hair, bone and teeth could be noted[39,46,47]. On imaging, findings vary from purely cystic to mixed to non cystic mass containing predominantly fat. On ultrasound, appearances vary from a purely cystic lesion with a peripheral nodule to a partially echogenic mass with posterior shadowing from adipose material, calcifications and hair, as well as multiple thin, echogenic bands which are occasionally seen resulting from hair in the cyst[39]. CT demonstrates characteristic fat attenuation with or without calcification in the wall[48,49]. On MR imaging, sebaceous components have high signal intensity on T1-weighted imaging similar to retroperitoneal fat and loses signal on fat suppression T1-weighted sequence, suggesting macroscopic fat. Low signal intensity on T1 and T2 weighted images could be secondary to soft tissue protuberances from Rokitansky nodules and calcifications (teeth) (Figure 10). Complications include torsion from large size and rupture causing leakage of sebaceous component into the peritoneum causing granulomatous peritonitis. Less than 2% may undergo malignant transformation[50].
Figure 10.
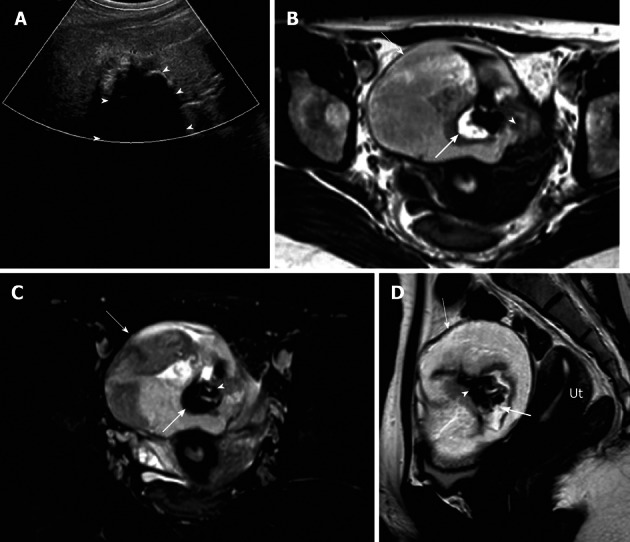
Mature cystic teratoma. A 51-year-old woman with pelvic mass and constipation. (A) Transvaginal ultrasonography demonstrates a complex cystic mass in the right ovary with septations and solid component, causing posterior acoustic shadowing (arrowhead) suggesting calcification. Axial precontrast T1 weighted image of the pelvis without fat saturation (B), post contrast T1 weighted image with fat saturation (C) and sagittal T2 weighted image though the pelvis (D) demonstrates a left ovarian complex mass with cystic component (arrow) showing mild to moderate low signal intensity on T1 weighted image and high signal intensity on T2 weighted image. Hyperintense foci on T1 weighted image with signal loss on T1 fat saturation (thick arrow) representing fat content, T1 and T2 hypointense foci representing calcific foci (arrowhead). Ut: Uterus.
BORDERLINE CYSTIC OVARIAN NEOPLASMS
This group includes noninvasive ovarian neoplasms histologically characterized as epithelial tumors with a stratified growth pattern. These usually manifest in younger females with an excellent prognosis[51]. The mean age of presentation of borderline ovarian tumors has been described to be approximately 20 years earlier than that of invasive ovarian carcinomas[52]. Considerable controversy remains regarding definition and management of borderline ovarian tumors[53]. Serous and mucinous neoplasms constitute the majority of borderline tumors[54]. On imaging, borderline serous cystic neoplasms manifest as complex cystic masses with mural nodules and septations. Serous borderline tumors may behave aggressively, presenting with lymphadenopathy and peritoneal implants. Despite extraovarian spread, serous borderline tumors still have a better prognosis in contrast to the high-grade serous cystadenocarcinoma[51]. Given the lack of distinguishing characteristics between benign and early malignant epithelial neoplasms, these are rarely diagnosed preoperatively[11]. The diagnosis may be considered based on a younger age group and mildly elevated CA-125 levels[55].
Endometroid carcinomas constitute 10%-15% of all ovarian carcinomas[39]. They are the most common malignant neoplasm arising within endometriosis[37,56]. These tumors are bilateral in 30%-50% cases. An association with endometrial carcinoma and endometrial hyperplasia has been described[57,58]. Imaging findings include a large, complex cystic mass with enhancing solid components (Figure 11).
Figure 11.

Endometroid carcinoma. A 30-year-old women with abdominopelvic mass. Contrast enhanced computed tomography (A) shows a large complex cystic mass (arrow) demonstrating thick irregular enhancing septae and solid components (arrowheads). A 22-year-old women with right pelvic pain. Axial T2 weighted (B) and post contrast fat suppressed T1 weighted images (C) showing a complex cystic mass with mildly heterogenous high signal intensity cystic component and intermediate signal intensity solid components (arrow) on T2 weighted image. The cystic component is of low signal intensity on post contrast T1 weighted images and solid components demonstrate significant enhancement. A complex lesion in the right ovary (short arrow), was found to be a dermoid cyst on surgery.
Clear cell carcinoma constitutes 5% of all ovarian carcinomas and is usually seen in patients with endometriosis[57,58]. Imaging findings include a unilocular or large cyst with solid protrusions demonstrating mild post contrast enhancement and may overlap with cystadenofibroma[39,59] (Figure 12). These findings are non specific and add to the differentials of low malignant potential serous tumors.
Figure 12.
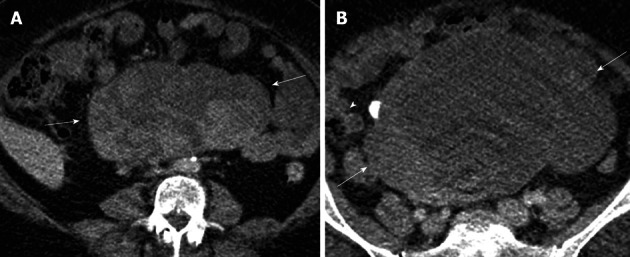
Clear cell carcinoma. A 49-year-old woman with abdominopelvic mass. Contrast enhanced computed tomography images of the lower abdomen and pelvis (A and B), showing a large lobulated complex cystic mass with enhancing nodular and solid component (arrows) and also a calcific focus (arrowhead).
MALIGNANT CYSTIC NEOPLASMS
On imaging, malignant cystic neoplasms are complex masses with a solid and cystic component. The presence of a thick irregular wall (> 3 mm), septations (> 3 mm), papillary projections and enhancing soft tissue with a necrotic component are highly suggestive of malignant neoplasms and are better appreciated on dynamic contrast enhanced MR imaging[60]. They are usually associated with ascites, peritoneal and omental implants and lymphadenopathy, depending on the extent of the disease. MRI remains more sensitive and specific relative to Doppler ultrasound and contrast enhanced CT in characterizing these masses[61].
High grade serous cystadenocarcinoma constitutes 25% of serous epithelial neoplasms and usually demonstrates low signal intensity papillary projections on T2-weighted images which demonstrate significant enhancement on post contrast MR images (Figure 13). Heterogeneity and calcifications (psammoma bodies in 30%) are also seen. Bilaterality and peritoneal carcinomatosis are frequently encountered with serous cystadenocarcinoma[5].
Figure 13.

Serous cystadenocarcinoma. A 53-year-old woman with lower pelvic discomfort, weight loss. Axial pre contrast T1 weighted image (A), axial T2 weighted image (B), axial fat suppressed post contrast T1 weighted image (C), showing a large complex right ovarian cystic lesion with septations, papillary projections and solid nodular components (arrowheads). Cystic component is low signal on pre contrast axial T1 weighted image and high signal on T2 weighted image (arrow). Septae, papillary projections and solid component are isointense on pre contrast T1 weighted and T2 weighted images with a significant post contrast enhancement.
Mucinous cystadenocarcinoma constitutes 5% to 10% of mucinous epithelial neoplasms. They are mostly unilateral and have papillary projections and solid enhancing soft tissue components[39] (Figure 14). They can rupture and cause pseudomyxoma peritonei.
Figure 14.

Mucinous cystadenocarcinoma. A 47-year-old woman with mobile pelvic mass. Axial T2 weighted image (A), axial pre contrast and post contrast T1 weighted images (B and C) demonstrating a right ovarian large heterogenous complex mass, which has a relatively high signal intensity on T2 weighted image (thick arrow) and low signal intensity on pre contrast T1 weighted image with a significant post contrast heterogenous enhancement. Another smaller lesion with similar characteristic is noted in the left adnexa (thin long arrow), representing bilateral surgically proven mucinous cystadenocarcinoma.
Germ cell tumors represent 15%-20% of all ovarian neoplasms and include the following subtypes: mature teratoma, immature teratoma, dysgerminoma, endodermal sinus tumor, embryonal carcinoma and choriocarcinoma[4,5]. Of all the subtypes, mature teratoma is the most common lesion and is benign in nature. Elevated enzyme markers like serum α fetoprotein and human chorionic gonadotropin are seen with choriocarcinoma and can help establish the diagnosis[4,46,47]. Endodermal sinus tumor (Yolk sac tumor) is a rare malignant tumor of germ cell group and seen during the second decade of life. It is associated with an elevated serum α-fetoprotein level. TVUS demonstrates a large heterogeneous complex mass with solid and cystic component. MRI is useful in evaluating the extent, given the large size of this tumor, and demonstrates solid and cystic components with differential post contrast enhancement[4,62].
Granulosa cell tumor accounts for less than 5% of all malignant ovarian tumors and is the commonest malignant sex cord tumor[3]. Adult ovarian Granulosa cell tumors are the most common ovarian neoplasms associated with overt endocrine manifestations, such as irregular menstruation cycles, menorrhagia and amenorrhea due to estrogen production by the tumor[63,64]. On US, Granulosa cell tumor has been described as a complex cystic echogenic mass[65,66]. On CT and MRI, it presents as a complex mass with solid and cystic component, sometimes showing a honey comb pattern. The multilocular cystic spaces are usually filled with hemorrhage or serous fluid. They are mostly confined to the ovary at the time of diagnosis[6]. They are complex masses with high T2-signal intensity from the cystic component and intermediate to low signal intensity from the solid component. Hemorrhage within the cysts may present with high signal intensity on T1- and T2-weighted images[6].
Ovarian metastases constitute approximately 10% of all ovarian neoplasms[39]. Metastases may occur via direct extension or peritoneal spread. The most common primary neoplasms are bowel, stomach and breast. Krukenberg tumors are used as a synonym for ovarian metastasis from gastric cancer demonstrating mucin filled signet cells and are mostly bilateral and solid[67].
Cystic ovarian metastases originate from colon cancer and frequently present as multiloculated cystic masses with a varying amount of solid component (Figure 15). Metastases from mucin producing tumors and also those with cystic and necrotic solid component closely resemble primary neoplasms[68]. Thick mucinous material exhibiting very low signal intensity on T2-weighted images has been described (Figure 16)[6].
Figure 15.

Ovarian metastases. A 52-year-old woman with weight loss, loss of appetite and pelvic mass. Contrast enhanced computed tomography (CT) images of the lower abdomen and pelvis (A and B) shows a large complex cystic mass (arrow) with enhancing solid components (arrowhead), arising from the pelvis and extending superiorly into the abdomen. Contrast enhanced CT (C), demonstrates nodular thickening along the lesser curvature of the stomach (thick arrow) which was found to be gastric adenocarcinoma on biopsy. Also note metastatic deposits in the left hepatic lobe (thin arrows) with perihepatic ascites and omental nodularity (double arrow).
Figure 16.
Imaging based algorithmic approach to cystic ovarian lesions: premenopausal age group. US: Ultrasonography; MRI: Magnetic resonance imaging; CT: Computed tomography. Adapted from[26].
Sonographic anechoic unilocular ovarian cyst (< 3 cm) with no septations or solid component seen on ultrasound is almost certainly a benign functional cyst/dominant follicle. No further imaging needed. If more than 5 cm and less than 7 cm, a yearly follow up ultrasound is suggested. If more than 7 cm, either surgical evaluation or follow up may be considered to document stability[26].
Ovarian cysts with a thin wall and uniform internal echoes with no intralesional vascularity may represent a hemorrhagic functional cyst or endometrioma. A follow up ultrasound in 6-12 wk should be performed to ensure resolution[26]. If there is complete interval resolution, it suggests a hemorrhagic functional cyst; if the lesion remains unchanged, it likely represents endometrioma and either a surgical evaluation vs further imaging with MRI for confirmation or yearly follow up may be considered. Alternately, an incidentally detected ovarian lesion on MRI showing high signal intensity on both T1- and T2-weighted imaging may represent a hemorrhagic cyst vs endometrioma. A follow up ultrasound in 6-12 wk should be performed in these cases to document interval resolution.
A sonographic ovarian complex cyst with internal echoes, fluid-fluid level and foci of calcification (posterior acoustic shadowing) is likely to represent a dermoid/teratoma. This can either be confirmed with CT or MRI for the presence of fat and also to evaluate the extent of the lesion (as many dermoids with calcification can represent just the tip of iceberg) or should undergo surgical evaluation. Incidentally, a detected lesion on CT with foci of fat attenuation, fat-fluid level and calcification is diagnostic of a dermoid.
Sonographic complex cystic lesions with solid components and/or mural nodules and/or thickened irregular septa remains a concern for a malignant neoplastic process and surgical evaluation or imaging with contrast enhanced MRI is recommended for characterization and evaluation of the extent of the disease (Figure 17)[26].
Figure 17.
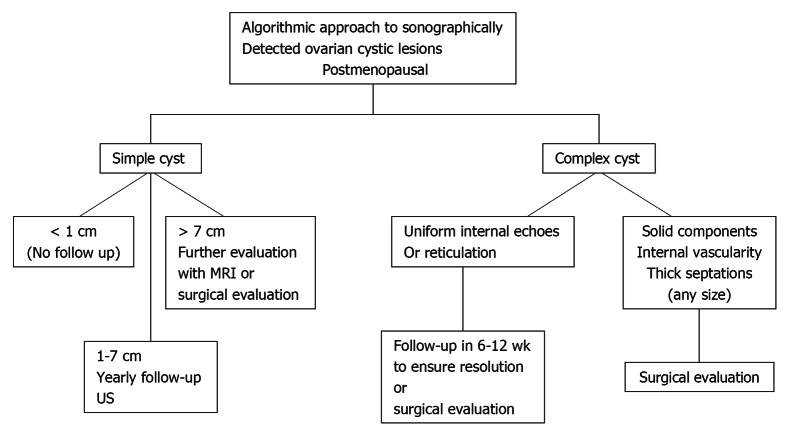
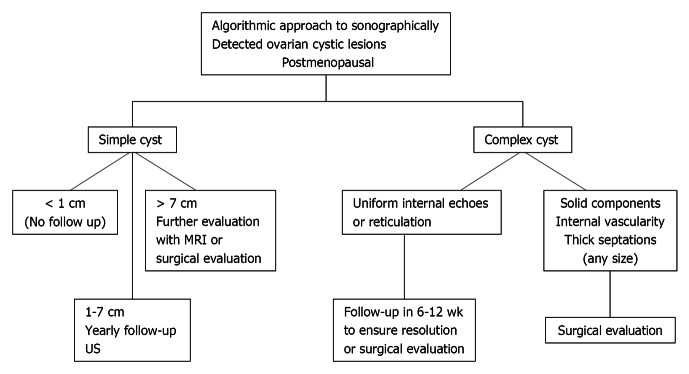
Postmenopausal age group. US: Ultrasonography; MRI: Magnetic resonance imaging. Adapted from[24,26,69,70].
Simple < 1 cm cysts are commonly seen in this age group and are considered clinically unimportant[26].
Anechoic unilocular simple cysts (no septations or solid component) less than 5 cm in diameter and seen on ultrasound have a very low malignant potential[69,70]. Cysts more than 1 cm and less than 7 cm should have a yearly follow up ultrasound to document stability. If more than 7 cm, either surgical evaluation or further imaging with MRI should be considered[26].
Any complex cystic mass demonstrating thick, irregular septations and a solid component with or without intralesional vascularity is mostly malignant and should undergo surgical evaluation[26]. Some of these patients may undergo CT or MRI imaging prior to surgery to define the nature and extent of the disease and also as baseline study for post treatment follow up[23].
CONCLUSION
Ovarian cystic lesions constitute a spectrum from benign to malignant pathology. Imaging can confidently characterize the majority of cystic lesions as benign, thereby avoiding an aggressive surgical approach. Lesions that remain indeterminate can be closely followed or surgically resected with a relatively conservative approach. Whilst cases of malignant lesions while imaging can raise a high diagnostic concern, it can also evaluate the extent of disease, thereby guiding appropriate treatment planning.
Footnotes
P- Reviewers Alcazar JL, Deter RL, Martins WP, Kabaalioglu A S- Editor Cheng JX L- Editor Roemmele A E- Editor Zheng XM
References
- 1.Cancer facts and figures. Atlanta: American cancer society, 2010: 19 (aaccessed January 2, 2011) [Google Scholar]
- 2.Zaloudek C. Ovary, fallopian tube and broad and round ligaments. In: Fletcher CDM, editor. Diagnostic histopathology of tumors. Philadelphia, PA: Churchill Livingstone Elsevier; 2007. pp. 567–652. [Google Scholar]
- 3.Koonings PP, Campbell K, Mishell DR, Grimes DA. Relative frequency of primary ovarian neoplasms: a 10-year review. Obstet Gynecol. 1989;74:921–926. [PubMed] [Google Scholar]
- 4.Brammer HM, Buck JL, Hayes WS, Sheth S, Tavassoli FA. From the archives of the AFIP. Malignant germ cell tumors of the ovary: radiologic-pathologic correlation. Radiographics. 1990;10:715–724. doi: 10.1148/radiographics.10.4.2165627. [DOI] [PubMed] [Google Scholar]
- 5.Pretorius ES, Outwater EK, Hunt JL, Siegelman ES. Magnetic resonance imaging of the ovary. Top Magn Reson Imaging. 2001;12:131–146. doi: 10.1097/00002142-200104000-00005. [DOI] [PubMed] [Google Scholar]
- 6.Togashi K. Ovarian cancer: the clinical role of US, CT, and MRI. Eur Radiol. 2003;13 Suppl 4:L87–104. doi: 10.1007/s00330-003-1964-y. [DOI] [PubMed] [Google Scholar]
- 7.Sohaib SA, Reznek RH. MR imaging in ovarian cancer. Cancer Imaging. 2007;7 Spec No A:S119–S129. doi: 10.1102/1470-7330.2007.9046. [DOI] [PMC free article] [PubMed] [Google Scholar]
- 8.Buy JN, Ghossain MA, Hugol D, Hassen K, Sciot C, Truc JB, Poitout P, Vadrot D. Characterization of adnexal masses: combination of color Doppler and conventional sonography compared with spectral Doppler analysis alone and conventional sonography alone. AJR Am J Roentgenol. 1996;166:385–393. doi: 10.2214/ajr.166.2.8553953. [DOI] [PubMed] [Google Scholar]
- 9.Brown DL, Doubilet PM, Miller FH, Frates MC, Laing FC, DiSalvo DN, Benson CB, Lerner MH. Benign and malignant ovarian masses: selection of the most discriminating gray-scale and Doppler sonographic features. Radiology. 1998;208:103–110. doi: 10.1148/radiology.208.1.9646799. [DOI] [PubMed] [Google Scholar]
- 10.Alcázar JL, Jurado M. Using a logistic model to predict malignancy of adnexal masses based on menopausal status, ultrasound morphology, and color Doppler findings. Gynecol Oncol. 1998;69:146–150. doi: 10.1006/gyno.1998.4995. [DOI] [PubMed] [Google Scholar]
- 11.Iyer VR, Lee SI. MRI, CT, and PET/CT for ovarian cancer detection and adnexal lesion characterization. AJR Am J Roentgenol. 2010;194:311–321. doi: 10.2214/AJR.09.3522. [DOI] [PubMed] [Google Scholar]
- 12.Forstner R, Hricak H, Occhipinti KA, Powell CB, Frankel SD, Stern JL. Ovarian cancer: staging with CT and MR imaging. Radiology. 1995;197:619–626. doi: 10.1148/radiology.197.3.7480729. [DOI] [PubMed] [Google Scholar]
- 13.Kinkel K, Lu Y, Mehdizade A, Pelte MF, Hricak H. Indeterminate ovarian mass at US: incremental value of second imaging test for characterization--meta-analysis and Bayesian analysis. Radiology. 2005;236:85–94. doi: 10.1148/radiol.2361041618. [DOI] [PubMed] [Google Scholar]
- 14.Adusumilli S, Hussain HK, Caoili EM, Weadock WJ, Murray JP, Johnson TD, Chen Q, Desjardins B. MRI of sonographically indeterminate adnexal masses. AJR Am J Roentgenol. 2006;187:732–740. doi: 10.2214/AJR.05.0905. [DOI] [PubMed] [Google Scholar]
- 15.Fenchel S, Grab D, Nuessle K, Kotzerke J, Rieber A, Kreienberg R, Brambs HJ, Reske SN. Asymptomatic adnexal masses: correlation of FDG PET and histopathologic findings. Radiology. 2002;223:780–788. doi: 10.1148/radiol.2233001850. [DOI] [PubMed] [Google Scholar]
- 16.Woodward PJ, Hosseinzadeh K, Saenger JS. From the archives of the AFIP: radiologic staging of ovarian carcinoma with pathologic correlation. Radiographics. 2004;24:225–246. doi: 10.1148/rg.241035178. [DOI] [PubMed] [Google Scholar]
- 17.Nishizawa S, Inubushi M, Okada H. Physiological 18F-FDG uptake in the ovaries and uterus of healthy female volunteers. Eur J Nucl Med Mol Imaging. 2005;32:549–556. doi: 10.1007/s00259-004-1703-x. [DOI] [PubMed] [Google Scholar]
- 18.Schwarz JK, Grigsby PW, Dehdashti F, Delbeke D. The role of 18F-FDG PET in assessing therapy response in cancer of the cervix and ovaries. J Nucl Med. 2009;50 Suppl 1:64S–73S. doi: 10.2967/jnumed.108.057257. [DOI] [PubMed] [Google Scholar]
- 19.Yoshida Y, Kurokawa T, Kawahara K, Tsuchida T, Okazawa H, Fujibayashi Y, Yonekura Y, Kotsuji F. Incremental benefits of FDG positron emission tomography over CT alone for the preoperative staging of ovarian cancer. AJR Am J Roentgenol. 2004;182:227–233. doi: 10.2214/ajr.182.1.1820227. [DOI] [PubMed] [Google Scholar]
- 20.Gu P, Pan LL, Wu SQ, Sun L, Huang G. CA 125, PET alone, PET-CT, CT and MRI in diagnosing recurrent ovarian carcinoma: a systematic review and meta-analysis. Eur J Radiol. 2009;71:164–174. doi: 10.1016/j.ejrad.2008.02.019. [DOI] [PubMed] [Google Scholar]
- 21.Russell P, Bannatyne P. Dysfunctional cysts. Surgical Pathology of the ovaries. New York, NY: Churchill Livingstone; 1989. pp. 97–107. [Google Scholar]
- 22.Young RH, Clement PB, Scully RE. The ovary. In: Sternberg SS, editor. Diagnostic surgical pathology. New York, NY: Raven; 1989. pp. 1655–1734. [Google Scholar]
- 23.Jeong YY, Outwater EK, Kang HK. Imaging evaluation of ovarian masses. Radiographics. 2000;20:1445–1470. doi: 10.1148/radiographics.20.5.g00se101445. [DOI] [PubMed] [Google Scholar]
- 24.Wolf SI, Gosink BB, Feldesman MR, Lin MC, Stuenkel CA, Braly PS, Pretorius DH. Prevalence of simple adnexal cysts in postmenopausal women. Radiology. 1991;180:65–71. doi: 10.1148/radiology.180.1.2052725. [DOI] [PubMed] [Google Scholar]
- 25.Bailey CL, Ueland FR, Land GL, DePriest PD, Gallion HH, Kryscio RJ, van Nagell JR. The malignant potential of small cystic ovarian tumors in women over 50 years of age. Gynecol Oncol. 1998;69:3–7. doi: 10.1006/gyno.1998.4965. [DOI] [PubMed] [Google Scholar]
- 26.Levine D, Brown DL, Andreotti RF, Benacerraf B, Benson CB, Brewster WR, Coleman B, Depriest P, Doubilet PM, Goldstein SR, et al. Management of asymptomatic ovarian and other adnexal cysts imaged at US: Society of Radiologists in Ultrasound Consensus Conference Statement. Radiology. 2010;256:943–954. doi: 10.1148/radiol.10100213. [DOI] [PMC free article] [PubMed] [Google Scholar]
- 27.Nishi M, Akamatsu N, Sekiba K. Magnetic resonance imaging of the ovarian cyst: its diagnostic value of endometrial cyst. Med Prog Technol. 1990;16:201–212. [PubMed] [Google Scholar]
- 28.Outwater EK, Mitchell DG. Normal ovaries and functional cysts: MR appearance. Radiology. 1996;198:397–402. doi: 10.1148/radiology.198.2.8596839. [DOI] [PubMed] [Google Scholar]
- 29.Outwater E, Schiebler ML, Owen RS, Schnall MD. Characterization of hemorrhagic adnexal lesions with MR imaging: blinded reader study. Radiology. 1993;186:489–494. doi: 10.1148/radiology.186.2.8421756. [DOI] [PubMed] [Google Scholar]
- 30.Dunaif A. Insulin resistance and the polycystic ovary syndrome: mechanism and implications for pathogenesis. Endocr Rev. 1997;18:774–800. doi: 10.1210/er.18.6.774. [DOI] [PubMed] [Google Scholar]
- 31.Lakhani K, Seifalian AM, Atiomo WU, Hardiman P. Polycystic ovaries. Br J Radiol. 2002;75:9–16. doi: 10.1259/bjr.75.889.750009. [DOI] [PubMed] [Google Scholar]
- 32.Clement PB. Pathology of endometriosis. In: Rosen PP, Fechner RE, editors. Pathology annual. Vol 25. Norwalk, Conn: Appleton and Lange; 1994. pp. 245–295. [Google Scholar]
- 33.Gerbie AB, Merrill JA. Pathology of endometriosis. Clin Obstet Gynecol. 1988;31:779–786. doi: 10.1097/00003081-198812000-00004. [DOI] [PubMed] [Google Scholar]
- 34.Iizuka M, Igarashi M, Abe Y, Ibuki Y, Koyasu Y, Ikuma K. Chemical assay of iron in ovarian cysts: a new diagnostic method to evaluate endometriotic cysts. Gynecol Obstet Invest. 1998;46:58–60. doi: 10.1159/000009999. [DOI] [PubMed] [Google Scholar]
- 35.Sugimura K, Takemori M, Sugiura M, Okizuka H, Kono M, Ishida T. The value of magnetic resonance relaxation time in staging ovarian endometrial cysts. Br J Radiol. 1992;65:502–506. doi: 10.1259/0007-1285-65-774-502. [DOI] [PubMed] [Google Scholar]
- 36.Takahashi K, Okada S, Okada M, Kitao M, Kaji Y, Sugimura K. Magnetic resonance relaxation time in evaluating the cyst fluid characteristics of endometrioma. Hum Reprod. 1996;11:857–860. doi: 10.1093/oxfordjournals.humrep.a019266. [DOI] [PubMed] [Google Scholar]
- 37.Tanaka YO, Yoshizako T, Nishida M, Yamaguchi M, Sugimura K, Itai Y. Ovarian carcinoma in patients with endometriosis: MR imaging findings. AJR Am J Roentgenol. 2000;175:1423–1430. doi: 10.2214/ajr.175.5.1751423. [DOI] [PubMed] [Google Scholar]
- 38.Kawamoto S, Urban BA, Fishman EK. CT of epithelial ovarian tumors. Radiographics. 1999;19 Spec No:S85–102; quiz S263-4. doi: 10.1148/radiographics.19.suppl_1.g99oc10s85. [DOI] [PubMed] [Google Scholar]
- 39.Jung SE, Lee JM, Rha SE, Byun JY, Jung JI, Hahn ST. CT and MR imaging of ovarian tumors with emphasis on differential diagnosis. Radiographics. 2002;22:1305–1325. doi: 10.1148/rg.226025033. [DOI] [PubMed] [Google Scholar]
- 40.Kim KA, Park CM, Lee JH, Kim HK, Cho SM, Kim B, Seol HY. Benign ovarian tumors with solid and cystic components that mimic malignancy. AJR Am J Roentgenol. 2004;182:1259–1265. doi: 10.2214/ajr.182.5.1821259. [DOI] [PubMed] [Google Scholar]
- 41.Sohaib SA, Sahdev A, Van Trappen P, Jacobs IJ, Reznek RH. Characterization of adnexal mass lesions on MR imaging. AJR Am J Roentgenol. 2003;180:1297–1304. doi: 10.2214/ajr.180.5.1801297. [DOI] [PubMed] [Google Scholar]
- 42.Exacoustos C, Romanini ME, Rinaldo D, Amoroso C, Szabolcs B, Zupi E, Arduini D. Preoperative sonographic features of borderline ovarian tumors. Ultrasound Obstet Gynecol. 2005;25:50–59. doi: 10.1002/uog.1823. [DOI] [PubMed] [Google Scholar]
- 43.Lin PS, Gershenson DM, Bevers MW, Lucas KR, Burke TW, Silva EG. The current status of surgical staging of ovarian serous borderline tumors. Cancer. 1999;85:905–911. [PubMed] [Google Scholar]
- 44.Bent CL, Sahdev A, Rockall AG, Singh N, Sohaib SA, Reznek RH. MRI appearances of borderline ovarian tumours. Clin Radiol. 2009;64:430–438. doi: 10.1016/j.crad.2008.09.011. [DOI] [PubMed] [Google Scholar]
- 45.Bazot M, Nassar-Slaba J, Thomassin-Naggara I, Cortez A, Uzan S, Daraï E. MR imaging compared with intraoperative frozen-section examination for the diagnosis of adnexal tumors; correlation with final histology. Eur Radiol. 2006;16:2687–2699. doi: 10.1007/s00330-006-0163-z. [DOI] [PubMed] [Google Scholar]
- 46.Comerci JT, Licciardi F, Bergh PA, Gregori C, Breen JL. Mature cystic teratoma: a clinicopathologic evaluation of 517 cases and review of the literature. Obstet Gynecol. 1994;84:22–28. [PubMed] [Google Scholar]
- 47.Outwater EK, Siegelman ES, Hunt JL. Ovarian teratomas: tumor types and imaging characteristics. Radiographics. 2001;21:475–490. doi: 10.1148/radiographics.21.2.g01mr09475. [DOI] [PubMed] [Google Scholar]
- 48.Buy JN, Ghossain MA, Moss AA, Bazot M, Doucet M, Hugol D, Truc JB, Poitout P, Ecoiffier J. Cystic teratoma of the ovary: CT detection. Radiology. 1989;171:697–701. doi: 10.1148/radiology.171.3.2717741. [DOI] [PubMed] [Google Scholar]
- 49.Guinet C, Ghossain MA, Buy JN, Malbec L, Hugol D, Truc JB, Vadrot D. Mature cystic teratomas of the ovary: CT and MR findings. Eur J Radiol. 1995;20:137–143. doi: 10.1016/0720-048X(95)00646-8. [DOI] [PubMed] [Google Scholar]
- 50.Talerman A. Germ cell tumors of the ovary. In: Kurman RJ, editor. Blaustein’s pathology of the female genital tract. New York, NY: Springer-Verlag; 2002. pp. 967–1033. [Google Scholar]
- 51.Lalwani N, Shanbhogue AK, Vikram R, Nagar A, Jagirdar J, Prasad SR. Current update on borderline ovarian neoplasms. AJR Am J Roentgenol. 2010;194:330–336. doi: 10.2214/AJR.09.3936. [DOI] [PubMed] [Google Scholar]
- 52.Gotlieb WH, Chetrit A, Menczer J, Hirsh-Yechezkel G, Lubin F, Friedman E, Modan B, Ben-Baruch G. Demographic and genetic characteristics of patients with borderline ovarian tumors as compared to early stage invasive ovarian cancer. Gynecol Oncol. 2005;97:780–783. doi: 10.1016/j.ygyno.2005.02.022. [DOI] [PubMed] [Google Scholar]
- 53.Silverberg SG. Borderline ovarian tumors: consensus, controversy, and continuing challenges. Pathol Case Rev. 2006;11:9–17. doi: 10.1097/01.pcr.0000196556.41743.cd. [DOI] [Google Scholar]
- 54.Acs G. Serous and mucinous borderline (low malignant potential) tumors of the ovary. Am J Clin Pathol. 2005;123 Suppl:S13–S57. doi: 10.1309/J6PXXK1HQJAEBVPM. [DOI] [PubMed] [Google Scholar]
- 55.Skírnisdóttir I, Garmo H, Wilander E, Holmberg L. Borderline ovarian tumors in Sweden 1960-2005: trends in incidence and age at diagnosis compared to ovarian cancer. Int J Cancer. 2008;123:1897–1901. doi: 10.1002/ijc.23724. [DOI] [PubMed] [Google Scholar]
- 56.Woodward PJ, Sohaey R, Mezzetti TP. Endometriosis: radiologic-pathologic correlation. Radiographics. 2001;21:193–216; questionnaire 288-294. doi: 10.1148/radiographics.21.1.g01ja14193. [DOI] [PubMed] [Google Scholar]
- 57.Buy JN, Ghossain MA, Sciot C, Bazot M, Guinet C, Prévot S, Hugol D, Laromiguiere M, Truc JB, Poitout P. Epithelial tumors of the ovary: CT findings and correlation with US. Radiology. 1991;178:811–818. doi: 10.1148/radiology.178.3.1994423. [DOI] [PubMed] [Google Scholar]
- 58.Wagner BJ, Buck JL, Seidman JD, McCabe KM. From the archives of the AFIP. Ovarian epithelial neoplasms: radiologic-pathologic correlation. Radiographics. 1994;14:1351–1374; quiz 1375-1376. doi: 10.1148/radiographics.14.6.7855346. [DOI] [PubMed] [Google Scholar]
- 59.Matsuoka Y, Ohtomo K, Araki T, Kojima K, Yoshikawa W, Fuwa S. MR imaging of clear cell carcinoma of the ovary. Eur Radiol. 2001;11:946–951. doi: 10.1007/s003300000671. [DOI] [PubMed] [Google Scholar]
- 60.Occhipinti K. Computed tomography and magnetic resonance imaging of the ovary. In: Anderson JC, editor. Gynecologic imaging. London: Churchill Livingstone; 1999. pp. 345–359. [Google Scholar]
- 61.Kurtz AB, Tsimikas JV, Tempany CM, Hamper UM, Arger PH, Bree RL, Wechsler RJ, Francis IR, Kuhlman JE, Siegelman ES, et al. Diagnosis and staging of ovarian cancer: comparative values of Doppler and conventional US, CT, and MR imaging correlated with surgery and histopathologic analysis--report of the Radiology Diagnostic Oncology Group. Radiology. 1999;212:19–27. doi: 10.1148/radiology.212.1.r99jl3619. [DOI] [PubMed] [Google Scholar]
- 62.Levitin A, Haller KD, Cohen HL, Zinn DL, O’Connor MT. Endodermal sinus tumor of the ovary: imaging evaluation. AJR Am J Roentgenol. 1996;167:791–793. doi: 10.2214/ajr.167.3.8751702. [DOI] [PubMed] [Google Scholar]
- 63.Ko SF, Wan YL, Ng SH, Lee TY, Lin JW, Chen WJ, Kung FT, Tsai CC. Adult ovarian granulosa cell tumors: spectrum of sonographic and CT findings with pathologic correlation. AJR Am J Roentgenol. 1999;172:1227–1233. doi: 10.2214/ajr.172.5.10227493. [DOI] [PubMed] [Google Scholar]
- 64.Varma DG, Thorneycroft IH, Degefu S, Eberly SM, Smith LG. Magnetic resonance imaging of adult ovarian granulosa cell tumor. Case report. Clin Imaging. 1990;14:55–58. doi: 10.1016/0899-7071(90)90120-Z. [DOI] [PubMed] [Google Scholar]
- 65.Stein M, Koenigsberg M, Han M. US case of the day. Adult-type granulosa cell tumor. Radiographics. 1996;16:200–203. doi: 10.1148/radiographics.16.1.200. [DOI] [PubMed] [Google Scholar]
- 66.Mendelson EB, Böhm-Vélez M. Transvaginal ultrasonography of pelvic neoplasms. Radiol Clin North Am. 1992;30:703–734. [PubMed] [Google Scholar]
- 67.Holtz F, Hart WR. Krukenberg tumors of the ovary: a clinicopathologic analysis of 27 cases. Cancer. 1982;50:2438–2447. doi: 10.1002/1097-0142(19821201)50:11<2438::AID-CNCR2820501132>3.0.CO;2-X. [DOI] [PubMed] [Google Scholar]
- 68.Chang WC, Meux MD, Yeh BM, Qayyum A, Joe BN, Chen LM, Coakley FV. CT and MRI of adnexal masses in patients with primary nonovarian malignancy. AJR Am J Roentgenol. 2006;186:1039–1045. doi: 10.2214/AJR.04.0997. [DOI] [PubMed] [Google Scholar]
- 69.Rulin MC, Preston AL. Adnexal masses in postmenopausal women. Obstet Gynecol. 1987;70:578–581. [PubMed] [Google Scholar]
- 70.Goldstein SR, Subramanyam B, Snyder JR, Beller U, Raghavendra BN, Beckman EM. The postmenopausal cystic adnexal mass: the potential role of ultrasound in conservative management. Obstet Gynecol. 1989;73:8–10. [PubMed] [Google Scholar]


