

Abstract
A challenge in achieving optimal management of cancer is the discovery of secreted biomarkers that represent useful surrogates for the disease and could be measured noninvasively. Because of the problems encountered in the proteomic interrogation of plasma, secretomes have been proposed as an alternative source of tumor markers that might be enriched with secreted proteins relevant to the disease. However, secretome analysis faces analytical challenges that interfere with the search for true secreted tumor biomarkers. Here, we have addressed two of the main challenges of secretome analysis in comparative discovery proteomics. First, we carried out a kinetics experiment whereby secretomes and lysates of tumor cells were analyzed to monitor cellular viability during secretome production. Interestingly, the proteomic signal of a group of secreted proteins correlated well with the apoptosis induced by serum starvation and could be used as an internal cell viability marker. We then addressed a second challenge relating to contamination of serum proteins in secretomes caused by the required use of serum for tumor cell culture. The comparative proteomic analysis between cell lines labeled with SILAC showed a number of false positives coming from serum and that several proteins are both in serum and being secreted from tumor cells. A thorough study of secretome methodology revealed that under optimized experimental conditions there is a substantial fraction of proteins secreted through unconventional secretion in secretomes. Finally, we showed that some of the nuclear proteins detected in secretomes change their cellular localization in breast tumors, explaining their presence in secretomes and suggesting that tumor cells use unconventional secretion during tumorigenesis. The unconventional secretion of proteins into the extracellular space exposes a new layer of genome post-translational regulation and reveals an untapped source of potential tumor biomarkers and drug targets.
Over the last decade, we have witnessed great developments in the understanding of cancer at molecular level. However, the tremendous progress made in deciphering the molecular characteristics of cancer cells has not yet been widely translated into the development of clinical tools to better monitor the disease (1). The clinical impact of knowledge surrounding the molecular basis of cancer has been limited in part because of the need for repetitive tissue analysis. Therefore, a challenge for achieving improved management of cancer is the discovery of secreted tumor biomarkers that represent useful surrogates for the disease and can be measured noninvasively. Despite an intensive search over decades, only a small number of identified secreted cancer biomarkers, commonly at low abundance in normal plasma (e.g., PSA, CEA, CA125, …) and often in combination with other diagnostic tools, have proven to be clinically useful (2, 3, 4).
The advent of proteomics led to a new gold rush for the search of blood-based tumor biomarkers through the exhaustive proteomic analysis of serum and plasma. However, blood-based biomarker discovery has encountered important limitations because of the complexity and dynamic range of plasma as well as the relatively low abundance of many disease-specific biomarkers (5). An alternative strategy proposed for the search of secreted tumor markers is the proteomic interrogation of tissue-derived proximal fluids and cancer cell line conditioned mediums, both known as secretomes (6, 7). The rationale supporting this approach is that secretomes, being much closer to tumor cells than plasma, may be enriched with secreted proteins relevant to the disease and also be more likely to be present in the blood. The presence of growth factors and proteases previously linked to cancer in these fluids indicates that secretomes may be useful in monitoring critical aspects of tumorigenesis (8). Over the last few years different studies have analyzed the secretomes of cancer cell lines from different tissues searching for candidate tumor biomarkers (6, 9, 10). One of the most striking observations when secretome profiles are analyzed is that they contain hundreds of theoretical intracellular proteins, which are usually assumed to derive from cell death or Fetal Bovine Serum (FBS) contamination. However, different examples of intracellular proteins with alternative functions in the extracellular compartment have recently been reported (11–14) proposing another explanation for the presence of intracellular proteins in the secretomes. Additionally, the analysis of tumor cell-derived exosomes and the discovery of different nonclassical secretion pathways have evidenced the presence of several intracellular proteins in the extracellular space. However, a global proteomic analysis of tumor cells, whereby the secretion pathways of true secreted proteins are evaluated, is lacking. The unconventional secretion of proteins into the extracellular compartment could reveal a new layer of genome post-translational regulation, because of which protein function would depend on cellular location.
Theoretically, secretomes are made of proteins secreted using a signal peptide through the classical ER-Golgi pathway, proteins secreted through different nonclassical pathways (e.g, exosomes, microvesicles, etc.), and extracellular domains of plasma membrane proteins generated by protease shedding (11). However, secretome analysis faces challenges that make it difficult to discern between true secretome proteins and contaminants. First, an unknown amount of serum proteins from the bovine serum—required for the growth of tumor cells—can mask the secreted protein's signal despite careful rinsing before generating secretomes. Second, secretome proteins can be contaminated with proteins derived from cell lysis, as a result of serum starvation during the secretome production. Recent proteomic projects involving secretome studies have monitored the cell viability of cell lines as a quality control for the generation of secretomes. In all cases cell viability has been monitored using the trypan blue dye staining of cells (15–17). This technique is based on a dye exclusion approach whereby dead cells with a compromised plasma membrane integrity are stained and the live cells are not. The limitation of this technique is that it only measures cell viability rather than apoptosis, which is the cell death mechanism induced by serum deprivation. Therefore, cells that have entered into apoptosis could be secreting apoptosis-related proteins at the same time that they are trypan blue-negative, because they are alive.
Here we have addressed two of the main challenges in successfully using secretome analysis for comparative discovery proteomics. First, we carried out a kinetics experiment whereby both secretome and lysates were collected and analyzed at different times of secretome production to correlate cell viability and apoptosis with secretome profiles in MCF7 breast cancer cells. From these experiments an optimal time frame for secretome production that does not compromise cell viability was determined.
Additionally, the proteomics signal of a group of secreted proteins was found to correlate with the apoptosis induced by serum starvation. We then dealt with another challenge in secretome analysis relating to serum protein contamination. The comparative proteomic analysis between two cancer cell line secretomes revealed that the serum used to grow cells could bias differential expression results. Improving secretome methodology allowed us to tackle a key question in the use of secretome analysis for biomarker discovery: are the theoretically intracellular proteins found in cancer cell lines secretomes coming from cell lysis or are they being secreted through non-classical secretion pathways? The work shown here proves that there is a substantial fraction of secretome proteins being secreted through nonclassical secretion pathways.
EXPERIMENTAL PROCEDURES
All chemicals were purchased from Sigma-Aldrich (Madrid, Spain) unless otherwise stated.
Cell Culture
The human breast cancer cell lines MCF7, MDA-MB-231, and BT474 were obtained from the ATCC, and cultured in 5% CO2 and 95% humidified atmosphere at 37 °C in Dulbecco's modified Eagle's medium (Invitrogen, Carlsbad, CA), supplemented with 10% fetal bovine serum (FBS; Invitrogen), and 2 mm l-Glutamine (Invitrogen). MCF7 cells were transfected using X-TremeGene (Roche, Germany) with the plasmid pcDNA3.1 containing Turbo Red fluorescent protein. Briefly, 4 × 10⁶ cells in exponential phase were seeded in 150 ml tissue culture plates and allowed to grow for 48 h. After that, the media was aspirated, and the cells were washed five times, two times with phosphate buffered saline and the last three with serum-free media. After that, cells were maintained in the presence of serum-free media with or without treatment (2 μm doxorubicin, 50 ng/ml Brefelding) for different lengths of time before collecting the conditioned media (secretome).
SILAC Labeling
MCF7 and MDA-MB-231 were both isotopically labeled with Lysine 6 (13C6-l-Lysine) and arginine 10 (13C615N4-l-Arginine). To achieve labeling, cells were incubated for eight cell passages with stable isotope labeling by amino acids in cell culture (SILAC)1 medium composed of Dulbecco's modified Eagle's medium lacking l-lysine and l-arginine (Silantes GmbH, Germany), 1% dialyzed fetal bovine serum (FBS), 2 mm l-glutamine, 0.2 mg/ml proline, and 0.1 mg/ml of each isotopically labeled amino acid (0.75 mm Lys6 and 0.60 mm Arg10). Secretomes from SILAC-labeled cells were collected at 24 h using serum-free SILAC media, as described previously.
Flow Cytometry
Apoptotic cell death caused by serum-free media was determined using the AnnexinV-EGFP Apoptosis Detection kit (MBL International Corporation, Woburn, MA). Briefly, 5 × 10⁵ MCF7 cells were incubated (0 h, 6 h, 24 h, 48 h, 72 h, and 96 h) with serum-free media. At the specific time points cells were collected by gentle trypsinization and labeled with annexin V-EGFP and propidium iodide (IP) according to the manufacturer's instructions. Stained cells were analyzed by fluorescence activated cell sorting (FACSCalibur, BD Biosciences, San Jose, CA) using CellQuest 3.3 Software. Gating of voltages were set using MCF7 cells growing with FBS (negative control for apoptosis) and MCF7 cells treated with 2 μm of doxorubicin for 16 h (positive control for apoptosis).
Western Blot
Cells were seeded in complete growth medium, and allow to grow at the specified times and conditions. Protein quantitation and electrophoresis was performed as described elsewhere. Western blot analysis was performed with the following antibodies: rabbit anti-cleaved PARP polyclonal antibody used at 1:1000 (D214, Cell Signaling, Boston, MA) and mouse anti-alpha-tubulin monoclonal antibody used at 1:10,000 (clone B-5–1-2, Sigma). Sheep anti-mouse and donkey anti-rabbit IgG (GE Healthcare, UK) horseradish peroxidase-conjugated secondary antibodies were used at 1:1000. Immunodetection was followed by visualization and densitometry using Image J software (National Institutes of Health, Bethesda, MD).
Secretome Sample Preparation
The conditioned media were spun down at 200 × g for 5min, the supernatants were collected, and filtered through a Millex-GP 0.22 μm pore syringe driven filter (Millipore, Ireland). Then secretomes were first concentrated using a 10,000 MWCO Millipore Amicon Ultra (Millipore) at 4000 × g at room temperature until a final volume of 250 μl, and then using a 10,000 MWCO Microcon (Amicon) at 14,000 × g until a final volume of 50 μl. Protein concentration was determined with a Pierce BCA protein assay kit (Thermo Scientific).
Exosomes Isolation
Secretomes were collected as described in the Secretome Sample preparation section. After filtering, 30 ml of MCF7 secretomes were spun down at 10,000 × g for 30 min, to eliminate microvesicles. Supernatants were then collected an ultracentrifuged at 110,000 × g for 3 h. Pelleted exosomes were then washed and resuspended in phosphate buffered saline before spinning them down again at 110,000 × g for 3 h. The pellet obtained was resuspended in 30 μl of phosphate buffered saline and stored at −80 °C until needed. Before proceeding to further studies, exosome preparations were validated by Western blot analysis against TSG101, an established exosome marker (data not shown).
In-solution Digests
All samples were in-solution digested previous to HPLC-MS analysis. Fifteen micrograms of each secretome or exosome preparation were first dissolved in 15 μl of 50% 2,2,2-Trifluoroethanol and reduced with tris(2-carboxyethyl)phosphine hydrochloride to a final concentration of 5 mm for 1 h at 60 °C and 700 rpm, and alkylated in 10 mm of Iodoacetic acid at 25 °C for 20min at 700 rpm in the dark. Before trypsin digestion, samples were diluted with 50 mm AB (ammonium bicarbonate) to a final concentration of 10% 2,2,2-Trifluoroethanol, and then proteins were digested in a ratio of 1:20 (w/w) with trypsin for 5 h at 37 °C. The reaction was stopped with formic acid (FA) to give a final concentration of 0.4% FA in the digested solution. After digestion samples were cleared at 10,000 rpm for 10 min, dried, and re-dissolved in 30% acetonitrile, 0.1% FA to a final concentration of 1 μg/μl before liquid chromatography (LC)-MS analysis.
LC-MS/MS Analysis
Samples were analyzed using an linear ion trap Velos-Orbitrap mass spectrometer (Thermo Fisher Scientific, Bremen, Germany). Instrument control was performed using Xcalibur software package, version 2.1.0 (Thermo Fisher Scientific, Bremen, Germany). Peptide mixtures were fractionated by on-line nanoflow liquid chromatography using an EASY-nLC system (Proxeon Biosystems, Thermo Fisher Scientific) with a two-linear-column system. Digests were loaded onto a trapping guard column (EASY-column, 2 cm long, ID 100 μm and packed with Reprosil C18, 5 μm particle size from Proxeon, Thermo Fisher Scientific) at a maximum pressure of 160 Bar. Then, samples were eluted from the analytical column (EASY-column, 10 cm long, ID 75 μm and packed with Reprosil, 3 μm particle size from Proxeon, Thermo Fisher Scientific). Separation was achieved by using a mobile phase from 0.1% FA (Buffer A) and 100% acetonitrile with 0.1% FA (Buffer B) and applying a linear gradient from 5 to 35% of buffer B for 60 min at a flow rate of 300 nL/min. Ions were generated applying a voltage of 1.9 kV to a stainless steel nano-bore emitter (Proxeon, Thermo Fisher Scientific), connected to the end of the analytical column.
The LTQ Orbitrap Velos mass spectrometer was operated in data-dependent mode. A scan cycle was initiated with a full-scan MS spectrum (from m/z 300 to 1600) acquired in the Orbitrap with a resolution of 30,000. The 20 most abundant ions were selected for collision-induced dissociation fragmentation in the linear ion trap when their intensity exceeded a minimum threshold of 1000 counts, excluding singly charged ions. Accumulation of ions for both MS and MS/MS scans was performed in the linear ion trap, and the AGC target values were set to 1 × 10⁶ ions for survey MS and 5000 ions for MS/MS experiments. The maximum ion accumulation time was 500 and 200 ms in the MS and MS/MS modes, respectively. The normalized collision energy was set to 35%, and one microscan was acquired per spectrum. Ions subjected to MS/MS with a relative mass window of 10 ppm were excluded from further sequencing for 20 s. For all precursor masses a window of 20 ppm and isolation width of 2 Da was defined. Orbitrap measurements were performed enabling the lock mass option (m/z 445.120024) for survey scans to improve mass accuracy.
Protein Identification
XCalibur 2.05 software (Thermo Fisher Scientific) was used to generate RAW files of each MS run. The .RAW files were processed using Proteome Discoverer 1.2 (Thermo Fisher Scientific). All cancer cell line secretomes MS/MS were searched against the human database Swiss-Prot 2010.11 (20332 sequences). In all cases the search engine used was MASCOT (Matrix Science, London, U.K.; version 2.2.04). The data was searched with fragment ion mass tolerance of 0.8 Da and a parent ion tolerance of 10 ppm. Oxidation of methionine and carbamidomethylation of cysteins were specified in Mascot as dynamic and static modification respectively, and one missed cleavage was allowed for tryptic cleavage. For the SILAC data, 13C6-l-Lysine and 13C615N4-l-Arginine modifications were specified in Mascot as dynamic or static modification depending on the experiment. The files generated from MASCOT (.DAT files) were then uploaded into Scaffold (version 3 00 07; Proteome software, Inc., Portland, OR) resulting in a nonredundant list of identified proteins per sample. Peptide identifications were accepted if they could be established at a PeptideProphet probability greater than 95% (18). Protein identifications were accepted if they could be established at greater than 95% probability and contained at least two identified spectra. Using these filters we always achieve a protein false discovery rate (FDR) under 1.0%, as estimated by a search against a decoy database. Protein isoforms and members of a protein family would be identified separately only if peptides that enable differentiation of isoforms had been identified based on generated MS/MS data. Otherwise, Scaffold would group all isoforms under the same gene name. Different proteins that contained similar peptides and which were not distinguishable based on MS/MS data alone were grouped to satisfy the principles of parsimony.
Label-free Protein Quantification
Relative label-free protein quantification analysis was performed on the different samples analyzed using spectral counting. The “Number of assigned spectra” function of Scaffold software, which provides the total number of spectra that matched to a protein identified in each sample was used. Scaffold files containing all of the spectral counts for each sample and its replicates of a given experiment was generated and then exported to R software for normalization and statistical analysis (see next section).
Statistics
All statistical computations were performed using the open-source statistical package R (19). The data from an MS/MS experiment was assembled in a matrix of spectral counts where the different conditions are represented by the columns, and the identified proteins are represented in the rows of that matrix. The need for normalization was assessed by comparing the total spectral counts (SpC) in technical replicates of each sample. As the quantity of substance for each sample, in each experiment, was the same, any substantial deviation was corrected by normalizing to the median total sample counts. An exploratory data analysis by means of principal components analysis (PCA) and hierarchical clustering of the samples on the SpC matrix was performed to find potential outliers and patterns in the data. Dealing with counts precludes the use of statistical tests and procedures based on the normal distribution, and restricts the appropriate methods to those in the general frame of the Generalized Linear Models (GLM) (20) with discrete distributions. As no substantial biological variability is expected from cell line data, according to our experience, a Poisson regression was used for significance testing throughout this work. The GLM model based on the Poisson distribution was used as a significance test throughout our work. Finally we used the Benjamini and Hochberg multitest correction to adjust the p values with control on the FDR (21).
RESULTS
Cell Viability Affects the Protein Composition of Secretomes
One of the most important issues, often overlooked when working with cell line secretomes, is cell viability. It has been widely described that serum starvation in many cell types causes cellular stress leading to cell death by apoptosis (22). Because cells are usually serum-starved during the generation of secretomes, it is essential to ensure that cellular stress does not interfere with secretome analysis. For this reason we decided to study cellular stress caused by serum deprivation on a cancer cell line using standard cellular biology tools. We performed a kinetics experiment with MCF7 cells that were subjected to serum deprivation for 0, 6, 24, 48, 72 and 96 h (Fig. 1A). At the different time points, cells were labeled with an antibody against annexin V to label cells undergoing early apoptosis, and with propidium iodide to label those that entered late apoptosis or necrosis. Analysis was carried out using flow cytometry (Fig. 1B, supplemental Fig. S1). In parallel, a cell lysate was prepared for Western blot (WB) analysis against caspase-3 cPARP, which is an established marker for late apoptosis. Finally, at all time points the secretomes were processed and analyzed by LC-MS shotgun proteomics (supplemental Tables S1, S2, S3). The results show that MCF7 cells can maintain cell viability by over 97.5% for 24 h, which is no different than that obtained on the same cells growing with serum (Fig. 1B). However, from 48 h onwards the percentage of cells undergoing late apoptosis increases, shown by both the cPARP signal as well as the percentage of propidium iodide-positive cells (Figs. 1B, 1C, supplemental Fig. S1). At longer serum deprivation times—up to 96 h—there is a shift from cells undergoing early apoptosis (bottom right quadrant in Fig. 1B) to cells entering late apoptosis (top left quadrant in Fig. 1B). Although the overall viability does not decrease by much even after 96 h, the microscopic analysis of these cells show several floating cells that might have a compromised plasma membrane (Fig. 1D). This hypothesis is confirmed by the fact that the yield of secretome per cell is stable from 0 to 48 h followed by a dramatic increase coinciding with the increase in apoptosis (Fig. 1E, blue line). As an additional measure of cell lysis during serum starvation, we calculated the spectral count average of structural ribosomal proteins (based on the signal of 27 ribosomal proteins) in the secretomes at the different time points (0 to 96 h) (Fig. 1E, red line) (9). Because ribosomal proteins are among the most abundant intracellular proteins, a high signal in the secretomes would be associated to cell lysis. The spectral count average for ribosomal proteins goes from 0.6 to 1 count in the time frame from 0 to 72 h, which confirms the high cell viability observed using other methodologies (Figs. 1B, 1C, 1D, 1E). However, at 96 h the signal of ribosomal proteins goes up to 3.3 SpC, suggesting that cell lysis increases abruptly from 72 to 96 h of serum starvation.
Fig. 1.

Cell viability affects the protein composition of secretomes. A, Scheme of the experimental setup followed to collect cell lysates, secretomes, and cells for Western blot, mass spec, and flow cytometry analysis after serum deprivation for 0, 6, 24, 48, 72 and 96 h. B, Representative flow cytometry analysis to check apoptosis levels in MCF7 cells grown in media with serum or having been in the presence of serum-free media for 24 and 96h. Cells were stained with both Annexin V and propidium iodide (PI). In each histogram the lower left quadrant contains viable cells (negative for both stainings). The data shows that cell viability is over 97% for at least 24h. Increasing time in serum-free media decreases cell viability to 95%. Upper left quadrant shows necrotic cells (positive for PI and negative for Annexin V). Percentage of necrotic cells increases up to 1.35% after 96h in serum free-media. The lower right quadrant (positive for both stainings) and the upper right quadrant (Annexin V positive, PI negative) represent cells in apoptosis and late apoptosis state respectively. Prolonged growth of cells in the presence of serum-free media increases the amount of apoptotic cells, specially the number of cells already in late apoptosis states. C, Western blot showing the expression level of cleavage-PARP in MCF7 cells grown in serum-free media for the indicated hours. Tubulin was used as loading control. A representative result of two independent experiments is shown. D, Images of MCF7 cells expressing Turbo Red Fluorescent Protein after being cultured in serum-free media for 24, 48, 72 and 96h. Images are shown at 4X and 20X magnification. E, Graph representing for the kinetic experiment in serum-free media the ng of secretome per cell (blue), and the spectral counts coming from ribosomal proteins (red), at each time point from two biological replicates. The percentage of cell viability obtained by FACS is indicated for selected time point. F, Left. Principal component analysis of the secretome profiles of MCF7 cells collected after different hours in serum-free media. For each time point two biological replicates with three technical replicas each of the secretomes are shown. Right. Unsupervised hierarchical clustering analysis of the two biological replicates with three technical replicates for each of the time points. Unsupervised average-linkage hierarchical clustering was done with the spectral count data after exporting it from Scaffold software into R. The entire protein list was used. Columns represent samples; rows are proteins.
Finally, the unsupervised statistical analysis by PCA shows that the secretome profiles at 0 and 6 h are quite similar, whereas those of the samples collected at 72 and 96 h are similar to each other and separate from the rest (Fig. 1F, left). The secretomes collected at 24 and 48 h are at the intermediate point in the PCA plot. The heatmap of the hierarchical clustering analysis also shows how the 72 and 96 h secretomes contain a large amount of proteins that are absent in the rest of the secretomes (Fig. 1F, right). Based on our results, the secretome of MCF7 cells obtained after more than 48 h of serum starvation would partially reflect cell death rather than cancer biology. Because the cPARP signal of the cells after 48 h of serum starvation is quite high, we propose the 24 h time point as the preferred time to collect secretomes for proteomic analysis. However, the length of time suitable for studying the secretome of different cell lines might vary slightly among cell lines.
A Group of Secreted Proteins Correlates with Serum Starvation Induced-apoptosis and Can be Used as a Cell Viability Indicator in Proteomics
Although flow cytometry and WB can monitor apoptosis caused by serum starvation on cells, it would be useful to assess the quality of secretomes from the secretome profile itself. In the previous section, we used the signal of ribosomal proteins as a measure of cell lysis. However, the ribosomal signal is very low because there is not much cell lysis until 72–96 h of serum starvation. Furthermore, to monitor the quality of secretomes, it would be better to establish when cells are entering into apoptosis, and hence the secretome might not reflect cancer biology although the cells are alive, rather than monitoring cell lysis. Using the secretome kinetics experiment previously described in this manuscript, a group of proteins that correlated with apoptosis measured by FACS and cPARP WB was selected. The group of proteins (21) was selected based on a minimum MS signal and a good correlation with the increase in apoptosis measured by FACS and WB (supplemental Table S4). This group of 21 proteins is usually located in intracellular organelles, and are related to cellular biosynthetic processes such as protein translation and nucleotide metabolism (23)(Fig. 2A) (http://string-db.org/). Most of the proteins are tRNA synthetases and chaperones. Some of these proteins such as tRNA synthetases and HMGB1 are known to be secreted under cellular stress (24, 25). However, the majority have never been reported to play any extracellular function. When the SpC signal of these 21 proteins is summed and expressed as a percentage of total SpC for each sample, the percentages of signal coming from stressed proteins correlate accurately with the appearance of apoptosis (Fig. 2B). The results show that a secretome collected after 24 h of serum starvation has less than 1% of the MS signal coming from the stress proteins, whereas for another collected after 96 h, the stress proteins contribute with over 4% of the MS signal. We then performed a series of experiments to preliminarily validate that this group of 21 secreted proteins correlate with cellular stress. We first used a biological replica of the MCF7 cell line serum-starved for 96 h, showing a good correlation with that of the kinetics experiment. Two other breast cancer cell lines-MDA-MB-231 and BT474- representing different molecular subtypes of breast cancer were then subjected to the same serum starvation conditions. Additionally, a secretome of a MCF7 cell line that has been grown through a large number of cell passages (aprox. 150) since it was acquired from the ATCC, which we know to be highly apoptotic, was analyzed after 24 h of serum starvation. In the three cases—MDA-MB-231–96h, BT474–96h, MCF-High passage—at around 4% of the MS signal comes from the secreted stress proteins. Conversely, when secretomes for the two additional cell lines used for validation (MDA-MB-231 and BT474) were collected at 24 h, the MS signal derived from the secreted stress proteins was close to 2%. Finally, because chemotherapeutic agents usually kill tumor cells through apoptosis, we tested whether our group of secreted proteins would increase on a treatment of MCF7 cells with doxorubicin (2 μm), a drug that induces apoptosis by intercalating DNA. The results shown in Fig. 2B confirmed that doxorubicin treatment also increases the levels of secretion of the 21 proteins selected to correlate with apoptosis. Although more work is required to validate our findings, the results suggest that secretome profiles contain information about cell stress that could be used to assess cell viability. Information on secretome-based cell viability could be used as a quality control for cancer cell line secretome studies.
Fig. 2.
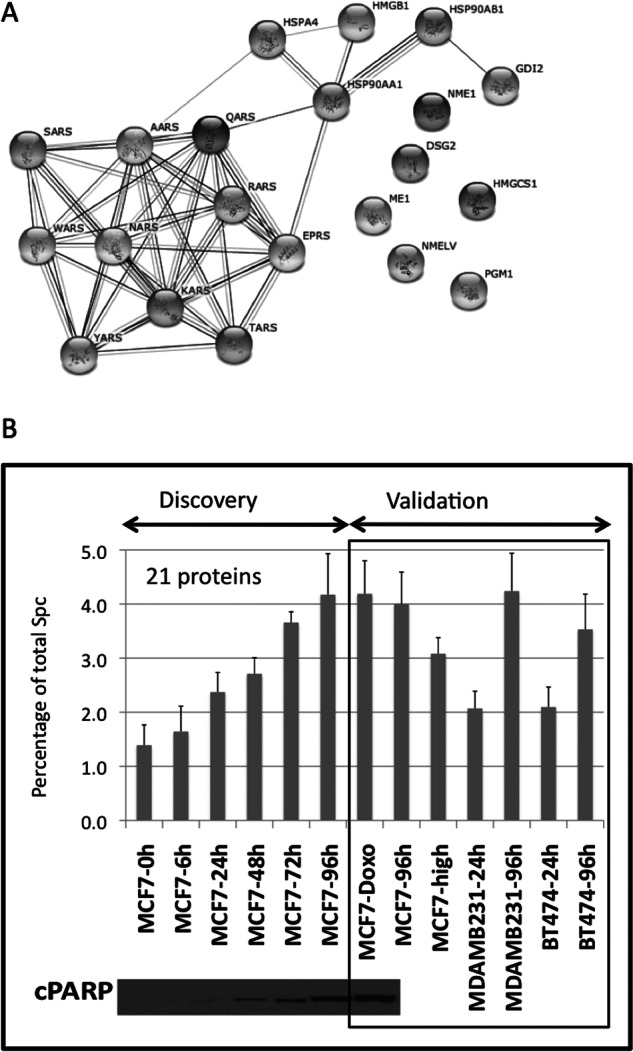
A group of secreted proteins correlates with apoptosis and can be used as a cell viability indicator. (A) Pathway analysis of the 21 selected proteins that correlate with apoptosis in the serum-deprivation kinetics experiment. The dataset was composed of two biological replicates with three technical replicates for each of the time points. The 21 selected proteins were uploaded into STRING software, mapped to gene objects and used to generate a biological network. (B) Graph representing the percentage of spectral counts coming from the stress signature proteins compared with total spectral counts of each sample during the secretome kinetics experiment in MCF7 cells. In the discovery phase the percentage of signal of the stress signature correlates with the levels of cPARP detected by Western blot. At 24h less than 1% of spectral counts comes from the stress proteins, while at 96h that signal represents more than 4%. The same subset of proteins was used to validate their correlation with cellular stress in: MCF7 cells treated with doxorubicin, an apoptotic inducer; in three different cell lines maintained in serum-free media for either 24h or 96h, and in a MCF7 high passage in which the apoptosis levels are increased versus the parental cells. The standard deviation was calculated using the aggregated MS signal of the 21 proteins, dividing it by the total MS signal in the sample LC-MS run, and then averaging the variances for the six technical replicas coming from two biological replicas.
A Substantial Group of Secretome Proteins Derive From FBS as Well as Being Secreted by Tumor Cells
The second major challenge in cell-line secretome analysis is to separate the proteomic signal deriving from FBS—used to grow the cells—from the proteomic signal coming from cells. Although some proteins such as albumin are known to come from FBS on rinsing the cells before secretome collection, there is an unknown amount of protein from the remaining FBS that can interfere with the secretome signal. Furthermore, these serum proteins can vary when using different serum lots and can also be present in different amounts depending on the cell line under study. As a preliminary analysis of the amount of serum signal present in our secretomes, we searched the secretome data against human and “Othermammal” databases (a mammal protein sequence database that does not contain human proteins) (Fig. 3A). The results show that between 5% and 10% of the proteins in the secretome are not human and hence derive from FBS. However, there is a gray area concerning 20% of secretome proteins that could either come from FBS or from tumor cells because of the high bovine-human protein sequence homology. Label-free proteomics cannot discriminate between proteins from serum and those secreted from cells. An easy solution to this problem is to use SILAC for the quantitative proteomic analysis of secretomes (26). Although SILAC can be used to remove the signal from serum contamination, it also constrains the flexibility of experimental design that can be achieved by label-free approaches, particularly when working in projects with several samples. A best of both worlds solution would be to use SILAC to label cells but then use spectral counting quantitation for the quantitative analysis of the secretomes. In this way we would remove the serum signal and at the same time benefit from the advantages of label-free quantitation. To test this strategy, we labeled three breast cancer cell lines—MCF7, MDA-MB-231, BT474—with heavy Arg and Lys. The proteomic results from their secretomes showed that more than 90% of secretome proteins (647) were labeled. A small fraction of 7.5% of proteins (53) were unlabeled and hence deriving from serum. Most interestingly, a substantial group of proteins of around 25% (164 proteins) were partially coming from serum as well as being secreted by tumor cells in different ratios (Fig. 3B, supplemental Table S6). We then took the SILAC-labeled secretomes of MCF7 and MDA-MB-231 and carried out comparative statistical analysis using two data sets: the data set containing the labeled plus unlabeled data and the one with only labeled data for the two cell lines (supplemental Table S5). Although most of the significant differences (202 proteins) were found in the two data sets, a small number (8 proteins) could be assigned to false positives because of the signal from serum (Fig. 3C, supplemental Table S6), whereas the remaining significant differences (12 proteins) were only found when analyzing the labeled data set. The scenario outlined here is well illustrated by the behavior of one of the false positives, SERPINA1. This protein is both present in the media and also being secreted by tumor cells. However, there is more unlabeled protein coming from the MDA-MB-231 than from the MCF7 secretome, probably because it attached to the plastic dish and/or to the cell membrane differently (Fig. 3B). Our results therefore suggest that the media can have an influence on the final list of significant differences in a comparative secretome analysis.
Fig. 3.

A substantial group of secretome proteins are also derived from FBS. (A) Venn diagrams of two breast cancer cell lines: MCF7 and MDA-MB-231, showing the overlap of proteins between the secretome data searched against both human and “other mammal” databases (mammal database that does not contain human proteins). Numbers in black represent proteins, numbers in gray represent unique peptides. Between 5–10% of the secretome proteins come from the FBS, and around 20% of the measured proteins could be either coming from tumor cells or from serum. (B) Graph representing the number of proteins measured in the secretome of MCF7 and MDA-MB-231 cells labeled with SILAC media. The results shown come from three biological replicates, each of them containing three technical replicates. The first column represents both labeled and unlabeled proteins (All, 623 proteins), the second column contains only labeled proteins (Silac-Labeled, 598 proteins). The third column (non-labeled proteins) is split between proteins that are both labeled and not labeled (104) and proteins with no labeled peptides (25). The right side of figure 3b shows the SpC levels for some of the proteins that are both SILAC labeled and unlabeled in secretomes of MCF7 and MDA-MB-231 cells. (C) Venn diagram showing the significant proteins different between two cell lines (MCF7 and MDA-MB-231), when comparing the dataset containing the labeled plus unlabeled data (All), and the one with only labeled data (SILAC). A dataset containing three biological replicates with three technical replicates for each cell line each was used to generate the Venn diagram. The statistical test used is GLM Poisson test. The lists of unique significant proteins for both the whole dataset (right) or the dataset with only labeled proteins (right) are shown.
A Substantial Fraction of Tumor Cell Secretomes Comes From Nonclassical Secretion
Finally, one of the most controversial issues using secretome analysis for biomarker discovery is that a substantial number of proteins found in secretomes are not supposed to be secreted. Commonly, more than half of the secretome proteins identified lack a signal peptide for the classical endoplasmic reticulum (ER)-Golgi secretion pathway. These proteins are frequently discarded during data analysis because they are thought to come from cell lysis or from the serum used to grow the cells. However, during the work presented in this manuscript we have shown that under the conditions used to generate secretomes, cell lysis is negligible. In addition, by labeling cells with SILAC we were able to remove the signal coming from FBS. The tumor cells are therefore secreting the proteins measured in the secretomes. When the proteins secreted by MCF7 cells under optimal experimental conditions were analyzed by Gene Ontology (GO), proteins from all cellular compartments were discovered. The comparison of the secretion profile kinetics of a group of proteins classically secreted with those from cytoplasmic and nuclear proteins shows that they all share similar secretion kinetics (figure 4a).The majority, regardless of GO category, peak their secretion between 24 and 48 h of serum-free incubation (Fig. 4A). Meanwhile, proteins known to come from the FBS tend to show a more erratic secretion profile (Fig. 4, bottom panel). The SILAC experiments results with MCF7 and MDA-MB-231 cells show that when considering the labeled signal only, 53% of the proteomic signal (24,510 SpC) and 45% of the proteins (314) are coming from classical secretion or shedding of plasma membrane proteins (supplemental Tables S7, S8, S9). Therefore, 47% of the proteomic signal (21,529 SpC) and 55% of the proteins (384) come from intracellular proteins being secreted through different unconventional secretion pathways, and theoretically located in intracellular compartments (Fig. 4B).
Fig. 4.

Kinetic profiles of the secretion of Secretome Proteins. (A) The three top panels show the kinetic profiles of selected proteins coming from classical secretion (extracellular) or located in the cytoplasm and nucleus by the Gene Ontology database. The bottom panel shows the kinetic profiles of classical serum proteins. (B) Pie chart showing Gene Ontology cellular compartment classification for all the secretome proteins found to be SILAC-labeled in the secretomes of MCF7 and MDA-MB-231 cells obtained with our optimized methodology.
To further confirm that proteins classified as intracellular and present in our secretomes are indeed secreted, we isolated exosomes from secretomes of MCF7 cells obtained after 24 h of serum starvation. Despite the fact that there are several routes through which proteins are nonclassically secreted, exosomes are probably the best characterized. Exosomes isolated by ultracentrifugation were analyzed by shotgun proteomics. The established exosomal marker CD63 was enriched in the exosomal fraction (top panel of Fig. 5). Other proteins known to be present in exosomes (annexins, histones and chaperones) were clearly enriched in the exosomal fraction with respect to the control secretome. The fact that proteins from most intracellular organelles were present in the exosomal fraction explains how these proteins lacking a signal peptide are secreted. Interestingly, the data suggests that several nuclear proteins are secreted by MCF7 cells through exosomes. Although exosomes are only one of the nonclassical protein secretion pathways, this experiment shows that in controlled experimental conditions, secretomes are made up of several proteins classified as intracellular. In parallel, we also treated MCF7 cells with Brefeldin A, an inhibitor of the classical ER-Golgi secretion pathway, and analyzed a secretome obtained after 24 h of serum starvation (27). The secretome obtained after Brefeldin A treatment shows that the secretion of several of the classically secreted proteins is blocked as compared with the control secretome, and that the same proteins are not enriched in the exosomal fraction (middle panel of Fig. 5). These experiments also demonstrate that there is a group of proteins whose secretion is not blocked by Brefeldin A and are not enriched in the exosomal fraction (bottom panel of Fig. 5). For example, MIF is secreted through an unconventional secretion pathway dependent on caspase-1 (28). However, most of these proteins are secreted thorough unknown secretion pathways.
Fig. 5.

A substantial fraction of tumor cell secretomes comes from non-classical secretion. Bar plots showing SpC quantification of selected proteins secreted by MCF7 cells when treated with Brefeldin A compared with the non-treated cells, and from exosomes isolated from the conditioned media of the same cells under identical experimental conditions. The top panel shows secreted proteins enriched in exosomes, the middle panel shows classically secreted proteins. The last panel shows secreted proteins unconventionally secreted but not enriched in the exosomes. The standard deviation was made from three biological replicates, each of them containing three technical replicates.
Proteins Change Their Cellular Localization in Breast Cancer
To establish whether the observations made on cancer cell lines correlate with clinical samples, a group of proteins present in secretomes were selected, and the Protein Atlas database (http://www.proteinatlas.org/) was mined to verify their expression by immunohistochemistry (IHC) in normal and tumor breast tissues (29). To support our hypothesis, the expression of proteins present in secretomes and classified as either extracellular or nuclear by GO, was checked in the Protein Atlas database. Although IHC on tissues does not permit the assessment of the extracellular localization of proteins, known extracellular proteins (CTGF, CYR61, IGFBP3, MIF, and MMP2) showed a clear cytoplasmic or membranous staining both in normal breast tissue as well as in breast tumors (Fig. 6A, supplemental Fig. S2). Interestingly, several secretome proteins classified as nuclear by GO showed a change in cellular localization between normal breast tissue and breast tumors. We show ten examples where a nuclear protein has a nuclear staining in normal breast tissue whereas in breast tumors adds a cytoplasmic/membranous localization by IHC, which is compatible with an extracellular localization (Fig. 6B, supplemental Fig. S2). Therefore, the data suggests that nuclear proteins that we find in secretomes might change their cellular localization during tumorigenesis and this may be the reason why they are found in cancer cell line secretomes. Additionally, we performed a Secretome P analysis (http://www.cbs.dtu.dk/services/SecretomeP/) on the 15 proteins (five secreted and ten nuclear) studied by IHC to predict secretion. Surprisingly, although the five secreted proteins (CTGF, CYR61, IGFBP3, MIF, and MMP2) were classified as secreted by the algorithm, only three out of the ten nonclassically secreted were classified as secreted (supplemental Table S10). This result illustrates the risk of only relying on algorithms for assigning the subcellular localization of proteins and underscores the need for further studies based on experimental evidence.
Fig. 6.

Proteins change their cellular localization in breast cancer. IHC analysis of secretome proteins in both normal and cancer breast tissue obtained from Protein Atlas database. In each case, one normal breast tissue and three different breast tumors are shown. (A) IHC analysis of known extracellular proteins showing a clear cytoplasmic/membranous staining in both normal and breast cancer. IHC analysis of extracellular proteins (CTGF, CYR61, IGFBP3, MIF and MMP2) are shown. (B) IHC analysis from the Protein Atlas database of ten secretome proteins classified as nuclear by GO. IHC analysis for: Anp32a, Apex1, Hnrpa2B1, Hnrnpk, Sub1, Snrnp70, Ssb, Sumo2, Thrap3 and Ub2l3 are shown.
DISCUSSION
One of the major drawbacks of cell line secretome analysis is that caused by cell culture conditions used to generate secretomes, the results are likely to be biased by cell death and serum contamination. We have evaluated the cell culture variables that greatly affect the composition of the secretome in this sense. Our experiments show that protein secretion is time-dependent, and that the longer the cells are left to generate the secretome, the more secretome is produced. However, a secretome generated for too long under serum starvation can result in a substantial contribution through apoptosis and cell death rather than from cancer biology. We have demonstrated that control cells grown with serum and cells under the conditions used to generate secretomes share the same viability and apoptotic features. Additionally, the almost negligible signal from abundant intracellular proteins in our secretomes confirm the absence of cell lysis and reinforces the validity of our methodological approach for proteomic biomarker discovery. Therefore, we have implemented a methodological framework to establish a safe time zone for the generation of secretomes that are likely to reflect tumor cell biology. Although we have worked mainly with MCF7 cells in this manuscript, data collected on BT474 and MDA-MB-231 cells also corroborates that the time window of around 24 h seems to be the best time point at which to obtain a biologically informative secretome. Despite the fact that profiling of cancer cell line secretomes has become a very popular approach for tumor biomarker discovery, to our knowledge no previous report has aimed to characterize how cell viability and apoptosis affects the cancer cell line secretome. Because apoptosis is the cell death mechanism induced by serum deprivation, we considered that the only way to assess which proteins are secreted by tumor cells was to study the influence of cell viability and apoptosis on the secretome. Following this methodological approach, we have been able to provide experimental evidence showing that unconventional secretion is a major contributor to the cancer cell line secretome.
Analysis of the protein secretion kinetics experiments showed that the secretion of a number of proteins increases on the induction of apoptosis by serum starvation. The secretion of this group of proteins—mainly composed by chaperones and tRNA synthetases—is increased almost linearly upon serum starvation. We think that their signal could be used as an internal biomarker of cell viability, thus as an internal quality control of secretomes. tRNA synthetases are the enzymes that ligate aa to tRNA for protein translation (25). Interestingly, mammalian tRNA synthetases differ from their bacterial homologs in that they have incorporated new protein domains to their structures, perhaps allowing them to carry out new functions. Some tRNA synthetases have been previously involved in alternative extracellular functions. For example, tyrosil-tRNA synthtase has been reported to be secreted from apoptotic cells and processed by elastase into two cytokine-like molecules that attract leukocytes to eliminate apoptotic cells (30). Lysil-tRNA synthtase has also been found to be secreted from intact cells initiating a pro-inflammatory response through the activation of monocyte and macrophages (31). Additionally, other proteins of our group of cellular stress proteins have also been reported to have an extracellular function. For example, HMGB1, a nuclear protein that is secreted during apoptosis, has pro-inflammatory activity that triggers coagulation, stimulates cytokine release by macrophages and monocytes, and induces neutrophil recruitment (32). Although we have not proven that the signal of these proteins will be useful as a secreted biomarker of cell viability for every cell line, we have provided a preliminary validation of their biomarker value in three cancer cell lines starved of serum, and also in the induction of apoptosis by a chemotherapeutic agent. However, more work is needed to assess whether this cellular stress signature can be generalized to the rest of the cell line secretomes.
Another major weakness of secretome analysis is the presence of serum proteins from the FBS in which cells are growing before generating secretome samples. Despite exhaustive rinsing of cells, an uncontrolled amount of serum remains during secretome analysis. SILAC labeling should easily set apart proteins coming from the serum from those secreted by tumor cells. In this work we chose to label cells with SILAC to remove the FBS signal but to do label-free quantitation rather than that of SILAC quantitation. This strategy provides more flexibility in terms of experimental design. Interestingly, the SILAC experiments revealed that a substantial number of secretome proteins are partially coming from the media and are also being secreted by tumor cells in different proportions. These experiments advocate for filtering out all the unlabeled signal of the dataset rather than removing suspicious proteins coming from serum, particularly because serum proteins can change among FBS commercial lots and cell lines studied. The comparative proteomic analysis performed between two SILAC labeled cell lines with and without removing the signal from serum, revealed some false positives due to serum proteins. The difference in the amounts of the same serum proteins in secretomes derived from different cell lines is puzzling. We speculate that serum proteins might bind differently to the cell surface of different cells due to different protein and lipid composition of the plasma membrane.
Our work shows experimental evidence that secretomes are made up of a substantial number of unconventionally secreted proteins. Despite both predictive algorithms and some reports showing that proteins lacking a signal peptide can be secreted by intact cells, here we show that hundreds of proteins classically located in intracellular organelles are in fact also being secreted by tumor cells. Our experiments with Brefeldin A and the isolation of exosomes allowed us to study some of the different secretion pathways used by epithelial cells for protein secretion, and prove that unconventionally secreted proteins are an integral part of cancer cell line secretomes. Over the last few years, tumor-derived exosomes have emerged as mediators of tumorigenesis (33). They have been found to exert immunosuppressive effects by blocking the activity of the host T cells (34). In addition, they seem to play a key role in tumor cell communication within the tumor microenvironment, and are also involved in drug resistance (35, 36). Furthermore, tumor-derived exosomes have just been reported to be prometastatic in melanoma (37). The protein content of tumor cells exosomes has been recently characterized by several proteomic publications and the proteins enriched in the exosome fraction described in this manuscript support previous publications on exosomes (38, 39). Although there is no doubt that exosomes are part of the unconventional protein secretion, we have found that a large number of secreted proteins are not enriched in exosomes and hence show that unconventional secretion is more prevalent than exosome secretion. Although other unconventional secretion pathways have already been revealed such as that depending on caspase-1, for several proteins the secretion routes are still unknown (28).
We have also shown that the data is compatible with the fact that some of the unconventionally secreted proteins described in our work are actually secreted in breast cancer patients. Furthermore, because most of the nuclear proteins studied by IHC change their cellular localization in the tumor tissue but not on the normal counterpart, we speculate that unconventional secretion could be a hallmark of cancer. The role of nonclassical secretion in biology has been the subject of speculation over the last few years. Unconventional secretion has been hypothesized as a strategy to increase the complexity of living organisms during evolution economizing on new protein designs and maximizing on functional diversity (12). Another hypothesis proposed is that multifunctional proteins working in different compartments are being used by cells to integrate global functions in tissues (13). Therefore, proteins classically located intracellularly could be in the extracellular compartment performing alternative functions. In the case of cancer secretomes, the alternative extracellular functions of intracellular proteins could be targeted using new therapeutic strategies such as specific antibodies. Either way, the strong contribution of unconventional protein secretion in cancer cell line secretomes reveals the existence of an untapped source of new candidate disease biomarkers and potential drug targets.
Supplementary Material
Acknowledgments
We thank Dr. Francesc Canals for helpful discussions and to Dr. Vicente Peg for his help in validating Protein Atlas histological data. We are also grateful to Dr. Irene Sales and Alejandro Bote for assistance with flow cytometry. We thank Dr. Ibasolo for the generous donation of the plasmid pcDNA3.1 containing Turbo Red fluorescent protein.
Footnotes
* This work was supported by a VHIO startup grant and grants from Instituto Carlos III (FIS PI0900777 and Miguel Servet CP0800234), Marie Curie Reintegration grant from the FP7 program of the European Union, the FERO and Josep Botet Foundations. J. V. was supported by the Miguel Servet Program, Instituto Carlos III.
 This article contains supplemental Figs. S1 and S2 and Tables S1 to S10.
1 The abbreviations used are:
- SILAC
- stable isotope labeling by amino acids in cell culture
- ITRAQ
- isobaric tags for relative and absolute quantitation
- LC-MS
- liquid chromatography-mass spectrometry
- GLM
- generalized linear model
- PCA
- principal component analysis
- SpC
- spectral count
- FDR
- false discovery rate
- FC
- fold change
- IHC
- Immunohistochemistry
- ER
- endoplasmic reticulum
- FBS
- fetal bovine serum
- PSA
- prostate-specific antigen
- CEA
- Carcinoembryonic antigen
- FACS
- Fluorescence-activated cell sorting
- cPARP
- poly(ADP-ribose) polymerase cleavage.
REFERENCES
- 1. Sawyers C. L. (2008) The cancer biomarker problem. Nature 452, 548–552 [DOI] [PubMed] [Google Scholar]
- 2. Sidransky D. (2002) Emerging molecular markers of cancer. Nat. Rev. Cancer 2, 210–219 [DOI] [PubMed] [Google Scholar]
- 3. Bidart J. M., Thuillier F., Augereau C., Chalas J., Daver A., Jacob N., Labrousse F., Voitot H. . (1999) Kinetics of Serum Tumor Marker Concentrations. 45(10), 1695–1707 [PubMed] [Google Scholar]
- 4. Kulasingam V., Diamandis E. P. (2008) Strategies for discovering novel cancer biomarkers through utilization of emerging technologies. Nat. Clin. Practice Oncol. 5, 588–599 [DOI] [PubMed] [Google Scholar]
- 5. Rifai N., Gillette M. A., Carr S. A. (2006) Protein biomarker discovery and validation: the long and uncertain path to clinical utility. Nat. Biotech. 24, 971–983 [DOI] [PubMed] [Google Scholar]
- 6. Grønborg M., Kristiansen T. Z., Iwahori A., Chang R., Reddy R., Sato N., Molina H., Jensen O. N., Hruban R. H., Goggins M. G., Maitra A., Pandey A. (2006) Biomarker discovery from pancreatic cancer secretome using a differential proteomic approach. Mol. Cell. Proteomics 5, 157–171 [DOI] [PubMed] [Google Scholar]
- 7. Celis J. E. (2004) Proteomic Characterization of the Interstitial Fluid Perfusing the Breast Tumor Microenvironment: A Novel Resource for Biomarker and Therapeutic Target Discovery. Mol. Cell. Proteomics 3, 327–344 [DOI] [PubMed] [Google Scholar]
- 8. Allinen M., Beroukhim R., Cai L., Brennan C., Lahtidomenici J., Huang H., Porter D., Hu M., Chin L., Richardson A. (2004) Molecular characterization of the tumor microenvironment in breast cancer. Cancer Cell 6, 17–32 [DOI] [PubMed] [Google Scholar]
- 9. Lawlor K., Nazarian A., Lacomis L., Tempst P., Villanueva J. (2009) Pathway-based biomarker search by high-throughput proteomics profiling of secretomes. J. Proteome Res. 8, 1489–1503 [DOI] [PubMed] [Google Scholar]
- 10. Mathias R. A., Wang B., Ji H., Kapp E. A., Moritz R. L., Zhu H.-J., Simpson R. J. (2009) Secretome-based proteomic profiling of Ras-transformed MDCK cells reveals extracellular modulators of epithelial-mesenchymal transition. J. Proteome Res. 8, 2827–2837 [DOI] [PubMed] [Google Scholar]
- 11. Nickel W., Rabouille C. (2009) Mechanisms of regulated unconventional protein secretion. Nat. Rev. Mol. Cell Biol. 10, 148–155 [DOI] [PubMed] [Google Scholar]
- 12. Butler G. S., Overall C. M. (2009) Proteomic identification of multitasking proteins in unexpected locations complicates drug targeting. Nat. Rev. Drug Discov. 8, 935–948 [DOI] [PubMed] [Google Scholar]
- 13. Radisky D. C., Stallings-Mann M., Hirai Y., Bissell M. J. (2009) Single proteins might have dual but related functions in intracellular and extracellular microenvironments. Nat. Rev. Mol. Cell Biol. 10, 228–234 [DOI] [PMC free article] [PubMed] [Google Scholar]
- 14. Putz U., Howitt J., Doan A., Goh C.-P., Low L.-H., Silke J., Tan S.-S. (2012) The Tumor Suppressor PTEN Is Exported in Exosomes and Has Phosphatase Activity in Recipient Cells. Sci. Signaling 5, ra70. [DOI] [PubMed] [Google Scholar]
- 15. Piersma S. R., Fiedler U., Span S., Lingnau A., Pham T. V., Hoffmann S., Kubbutat M. H. G., Jimenez C. R. (2010) Workflow Comparison for Label-Free, Quantitative Secretome Proteomics for Cancer Biomarker Discovery: Method Evaluation, Differential Analysis, and Verification in Serum. J. Proteome Res. 9, 1913–1922 [DOI] [PubMed] [Google Scholar]
- 16. Gronborg M. (2002) A Mass Spectrometry-based Proteomic Approach for Identification of Serine/Threonine-phosphorylated Proteins by Enrichment with Phospho-specific Antibodies: Identification of a Novel Protein, Frigg, as a Protein Kinase A Substrate. Mol. Cell. Proteomics 1, 517–527 [DOI] [PubMed] [Google Scholar]
- 17. Wu C.-C., Chien K.-Y., Tsang N.-M., Chang K.-P., Hao S.-P., Tsao C.-H., Chang Y.-S., Yu J.-S. (2005) Cancer cell-secreted proteomes as a basis for searching potential tumor markers: Nasopharyngeal carcinoma as a model. Proteomics 5, 3173–3182 [DOI] [PubMed] [Google Scholar]
- 18. Keller A., Nesvizhskii A. I., Kolker E., Aebersold R. (2002) Empirical Statistical Model To Estimate the Accuracy of Peptide Identifications Made by MS/MS and Database Search. Anal. Chem. 74, 5383–5392 [DOI] [PubMed] [Google Scholar]
- 19. Chambers J. (2008) Software for data analysis: Programming with R, Springer Verlag [Google Scholar]
- 20. Agresti A. (2010) Analysis of Ordinal Categorical Data, John Wiley & Sons Inc [Google Scholar]
- 21. Benjamini Y., Hochberg Y. (1995) Controlling the False Discovery Rate - a Practical and Powerful Approach to Multiple Testing. J. Roy. Stat. Soc. B Met. 57, 289–300 [Google Scholar]
- 22. Braun F., Bertin-Ciftci J., Gallouet A.-S., Millour J., Juin P. (2011) Serum-Nutrient Starvation Induces Cell Death Mediated by Bax and Puma That Is Counteracted by p21 and Unmasked by Bcl-xL Inhibition. PLoS ONE 6, e23577. [DOI] [PMC free article] [PubMed] [Google Scholar]
- 23. Szklarczyk D., Franceschini A., Kuhn M., Simonovic M., Roth A., Minguez P., Doerks T., Stark M., Muller J., Bork P., Jensen L. J., Mering C. V. (2010) The STRING database in 2011: functional interaction networks of proteins, globally integrated and scored. Nucleic Acids Res. 39, D561–D568 [DOI] [PMC free article] [PubMed] [Google Scholar]
- 24. Gardella S., Andrei C., Ferrera D., Lotti L. V., Torrisi M. R., Bianchi M. E., Rubartelli A. (2002) The nuclear protein HMGB1 is secreted by monocytes via a non-classical, vesicle-mediated secretory pathway. EMBO Rep. 3, 995–1001 [DOI] [PMC free article] [PubMed] [Google Scholar]
- 25. Kim S., You S., Hwang D. (2011) Aminoacyl-tRNA synthetases and tumorigenesis: more than housekeeping. 1–11 [DOI] [PubMed] [Google Scholar]
- 26. Faça V. M., Ventura A. P., Fitzgibbon M. P., Pereira-Faça S. R., Pitteri S. J., Green A. E., Ireton R. C., Zhang Q., Wang H., O'briant K. C., Drescher C. W., Schummer M., Mcintosh M. W., Knudsen B. S., Hanash S. M., Imhof A. (2008) Proteomic analysis of ovarian cancer cells reveals dynamic processes of protein secretion and shedding of extra-cellular domains. PLoS ONE 3, e2425. [DOI] [PMC free article] [PubMed] [Google Scholar]
- 27. Misumi Y., Misumi Y., Miki K., Takatsuki A., Tamura G., Ikehara Y. (1986) Novel blockade by brefeldin A of intracellular transport of secretory proteins in cultured rat hepatocytes. J. Biol. Chem. 261, 11398–11403 [PubMed] [Google Scholar]
- 28. Keller M., Ruegg A., Werner S., Beer H. (2008) Active caspase-1 is a regulator of unconventional protein secretion. Cell 132, 818–831 [DOI] [PubMed] [Google Scholar]
- 29. Uhlen M., Oksvold P., Fagerberg L., Lundberg E., Jonasson K., Forsberg M., Zwahlen M., Kampf C., Wester K., Hober S., Wernerus H., Björling L., Ponten F. (2010) Towards a knowledge-based Human Protein Atlas. Nat. Biotech. 28, 1248–1250 [DOI] [PubMed] [Google Scholar]
- 30. Greenberg Y., King M., Kiosses W. B., Ewalt K., Yang X., Schimmel P., Reader J. S., Tzima E. (2007) The novel fragment of tyrosyl tRNA synthetase, mini-TyrRS, is secreted to induce an angiogenic response in endothelial cells. FASEB J. 22, 1597–1605 [DOI] [PubMed] [Google Scholar]
- 31. Park S. G., Kim H. J., Min Y. H., Choi E.-C., Shin Y. K., Park B.-J., Lee S. W., Kim S. (2005) Human lysyl-tRNA synthetase is secreted to trigger proinflammatory response. Proc. Natl. Acad. Sci. U.S.A. 102, 6356–6361 [DOI] [PMC free article] [PubMed] [Google Scholar]
- 32. Rovere-Querini P., Capobianco A., Scaffidi P., Valentinis B., Catalanotti F., Giazzon M., Dumitriu I. E., Müller S., Iannacone M., Traversari C., Bianchi M. E., Manfredi A. A. (2004) HMGB1 is an endogenous immune adjuvant released by necrotic cells. EMBO Rep. 5, 825–830 [DOI] [PMC free article] [PubMed] [Google Scholar]
- 33. Skog J., Würdinger T., van Rijn S., Meijer D. H., Gainche L., Curry W. T., Carter B. S., Krichevsky A. M., Breakefield X. O. (2008) Glioblastoma microvesicles transport RNA and proteins that promote tumour growth and provide diagnostic biomarkers. Nat. Cell. Biol. 10, 1470–1476 [DOI] [PMC free article] [PubMed] [Google Scholar]
- 34. Andreola G. (2002) Induction of Lymphocyte Apoptosis by Tumor Cell Secretion of FasL-bearing Microvesicles. J. Exp. Med. 195, 1303–1316 [DOI] [PMC free article] [PubMed] [Google Scholar]
- 35. Deng Z., Cheng Z., Xiang X., Yan J., Zhuang X., Liu C., Jiang H., Ju S., Zhang L., Grizzle W., Mobley J., Roman J., Miller D., Zhang H.-G. (2012) Tumor cell cross talk with tumor-associated leukocytes leads to induction of tumor exosomal fibronectin and promotes tumor progression. Am. J. Pathol. 180, 390–398 [DOI] [PubMed] [Google Scholar]
- 36. Ciravolo V., Huber V., Ghedini G. C., Venturelli E., Bianchi F., Campiglio M., Morelli D., Villa A., Mina P. D., Menard S., Filipazzi P., Rivoltini L., Tagliabue E., Pupa S. M. (2011) Potential role of HER2-overexpressing exosomes in countering Trastuzumab-based therapy. J. Cell. Physiol, 2, 658–667 [DOI] [PubMed] [Google Scholar]
- 37. Peinado H., Alečković M., Lavotshkin S., Matei I., Costa-Silva B., Moreno-Bueno G., Hergueta-Redondo M., Williams C., García-Santos G., Ghajar C. M., Nitadori-Hoshino A., Hoffman C., Badal K., Garcia B. A., Callahan M. K., Yuan J., Martins V. R., Skog J., Kaplan R. N., Brady M. S., Wolchok J. D., Chapman P. B., Kang Y., Bromberg J., Lyden D. (2012) Melanoma exosomes educate bone marrow progenitor cells toward a pro-metastatic phenotype through MET. Nat. Med. [DOI] [PMC free article] [PubMed] [Google Scholar]
- 38. Mathivanan S., Lim J. W. E., Tauro B. J., Ji H., Moritz R. L., Simpson R. J. (2010) Proteomics Analysis of A33 Immunoaffinity-purified Exosomes Released from the Human Colon Tumor Cell Line LIM1215 Reveals a Tissue-specific Protein Signature. Mol. Cell. Proteomics 9, 197–208 [DOI] [PMC free article] [PubMed] [Google Scholar]
- 39. Welton J. L., Khanna S., Giles P. J., Brennan P., Brewis I. A., Staffurth J., Mason M. D., Clayton A. (2010) Proteomics analysis of bladder cancer exosomes. Mol. Cell. Proteomics 9, 1324–1338 [DOI] [PMC free article] [PubMed] [Google Scholar]
Associated Data
This section collects any data citations, data availability statements, or supplementary materials included in this article.