

Abstract
Protein phosphorylation is instrumental to early signaling events. Studying system-wide phosphorylation in relation to processes under investigation requires a quantitative proteomics approach. In Arabidopsis, auxin application can induce pericycle cell divisions and lateral root formation. Initiation of lateral root formation requires transcriptional reprogramming following auxin-mediated degradation of transcriptional repressors. The immediate early signaling events prior to this derepression are virtually uncharacterized. To identify the signal molecules responding to auxin application, we used a lateral root-inducible system that was previously developed to trigger synchronous division of pericycle cells. To identify and quantify the early signaling events following this induction, we combined 15N-based metabolic labeling and phosphopeptide enrichment and applied a mass spectrometry-based approach. In total, 3068 phosphopeptides were identified from auxin-treated root tissue. This root proteome dataset contains largely phosphopeptides not previously reported and represents one of the largest quantitative phosphoprotein datasets from Arabidopsis to date. Key proteins responding to auxin treatment included the multidrug resistance-like and PIN2 auxin carriers, AUXIN RESPONSE FACTOR2 (ARF2), SUPPRESSOR OF AUXIN RESISTANCE 3 (SAR3), and SORTING NEXIN1 (SNX1). Mutational analysis of serine 16 of SNX1 showed that overexpression of the mutated forms of SNX1 led to retarded growth and reduction of lateral root formation due to the reduced outgrowth of the primordium, showing proof of principle for our approach.
In recent years, immense progress has been made in the global analysis of cellular protein phosphorylation events (1–3). Understanding the relative contribution of protein phosphorylation to the regulation of cellular signaling requires implementation of relative or absolute quantification of protein phosphorylation at the tissue and organism level. The analysis and quantification of phosphorylated proteins are analytically challenging. For instance, phosphorylated peptides are present at substoichiometric levels when compared with nonmodified peptides in digested lysates. The recent development of an array of phosphopeptide enrichment strategies (4) has resulted in an explosion of the number of reported phosphoproteomics datasets from diverse organisms, including plants (2, 6). Most recently, it has been shown that using Ti4+-IMAC1 as an enrichment strategy has an excellent selectivity and efficiency for the enrichment of phosphopeptides (7, 8). A modest number of the reported plant phosphoproteomic datasets also contain quantitative data; however, the majority of these datasets were obtained with cultured cells (9–11). Those cases that report quantitative phosphoproteomic data from seedling or plant tissue rely on post-extraction labeling or label-free quantification. Metabolic labeling with stable isotopes is one of the favored strategies to accurately determine differential protein (phosphorylation) levels (12). Incorporation of stable isotopes in cellular proteins is possible in cultured cells as well as at the organism level and generates the least variation in sample preparation and analysis. Because plants are autotrophic organisms able to synthesize all amino acids from inorganic nitrogen (9), 15N labeling is preferential for metabolic labeling (12). Cell cultures can be grown on media containing 15N as the sole nitrogen source (13). Metabolic labeling was used to study the differentially phosphorylated membrane proteins upon elicitor or cadmium treatment in cell culture (6, 14). The use of hydroponic growth systems has also made it possible to apply 15N stable isotope labeling using 15N-labeled inorganic salts to intact plants (15). More recently, several different 15N-labeling techniques, which include the comparison of partial versus full labeling (16), the automated analysis of uniformly labeled proteins using Mascot peptide identification in conjunction with the trans-proteomic pipeline (17), and a procedure referred to as hydroponic isotope labeling of entire plants (18, 19), were implemented. These metabolic labeling strategies for proteomics generally grow plants in liquid media, which can significantly affect their development.
Exogenous application of auxin to roots has been extensively used to trigger changes in gene expression (20) and root development (21) and provides a relevant model system to test changes in protein phosphorylation in a developmentally defined context. Auxin binding to a receptor SCFTIR1 complex causes derepression of transcription (22–24) by targeting AUX/IAA transcriptional repressors for proteasome-mediated degradation (25). Auxin-induced protein phosphorylation has remained controversial with few verified reports (26).
Applying exogenous auxin to an Arabidopsis root significantly affects lateral root formation. In Arabidopsis, lateral roots are initiated by the local activation of pericycle cells at the xylem poles (27) by auxin-triggered degradation of the transcriptional repressor SOLITARY ROOT (SLR/IAA14) and subsequent derepression of auxin response factors ARF7 and ARF19 (28).
In this study, we made use of the previously described lateral root-inducible system (LRIS) to induce synchronous cell division in the entire pericycle at the xylem poles in Arabidopsis (20, 29–31). We deployed 15N-labeled Arabidopsis seeds germinated and grown on solid 15N medium, allowing us to investigate auxin-induced changes in protein phosphorylation using LRIS. We combined 15N-based metabolic labeling and selective enrichment of phosphopeptides with LRIS samples to obtain quantitative phosphoprotein profiles of events preceding initiation of lateral root formation. From these we identified, among others, phosphorylation sites in sorting nexin1 (SNX1) previously linked to auxin signaling and lateral root formation (32). As a proof of concept for the relevance of our phosphoproteomics approach, we analyzed mutations of the phosphorylated amino acids in SNX1 to assess their relevance and found them to be required for seedling growth, and phosphorylation site mutants affect protein stability and lateral root primordium outgrowth.
MATERIALS AND METHODS
Metabolic Labeling of Arabidopsis
Arabidopsis Col-0 seeds were liquid-sterilized and sown on 0.6% agar in a hydroponic system supplied with single component B5 medium containing [14N[- or [15N[ammonium nitrate and potassium nitrate. Seeds were vernalized for 2 days at 4°C in the darkness and transferred to long day growth conditions (16 h of light/8 h of darkness). 14N- or 15N-labeled seeds were harvested, surface-sterilized, and sown on 3MM Whatman paper strips on modified 1/2GM (Murashige and Skoog basal salt mixture containing either [14N[- or [15N[ammonium or nitrate salts, without vitamins, 1% sucrose, and 0.8% agar) medium. Plated seeds were vernalized at 4°C in the darkness for 2 days. The plates were transferred to light to germinate for 4 days, and the paper strips were transferred to modified ½MS medium containing 10 μm NPA for 3 days. For induction, the paper strips carrying the seedlings with roots were transferred to modified ½MS medium with 10 μm NAA (treatment) or without (control) for 2 h. 14N- and 15N-labeled roots were harvested separately by flash-dipping the paper strips into liquid nitrogen and breaking of the root tissue, which was ground into a fine powder. The extraction buffer (8 m urea, 25 mm NH4HCO3, 1 mm NaF, 1 mm Na4VO3, and 5 mm NaPO4, pH 7.0) was added to the powder to extract the protein. Protein extracts were spun two times for 15 min at 13,000 rpm at 4°C, and soluble protein was quantified with Bradford.
Protein Digestion
Two milligrams of protein were mixed with buffer containing 8 m urea, 400 mm NH4HCO3 to 1.2 ml, and reduced with 5 mm dithiothreitol for 30 min at 50°C and alkylated by addition of 10 mm iodoacetamide. After 30 min of incubation in the dark at room temperature, the first digestion was performed by addition of Lys-C at an enzyme/protein ratio of 1:100 and incubated for 4 h at 37°C. Subsequently, the digest was diluted with water to a final urea concentration of 1 m, and a second digestion with trypsin at an enzyme/protein ratio of 1:50 was performed at 37°C overnight. Finally, the digestion was quenched with 5% formic acid. The resulting digest of protein was desalted using 200-ml Sep-Pak C18 cartridges (Waters Corp.), dried in vacuo, and stored at −20°C.
Strong Cation Exchange Chromatography for Peptide Fractionation and Phosphopeptide Enrichment
Strong cation exchange chromatography and phosphopeptide enrichment are as described before (33) with minor modifications. Affinity material Ti4+-IMAC resin was loaded onto gel-loader tip microcolumns using a C8 plug and an ∼1–2-cm length of material. The enrichment procedures were as follows: 2× 30 μl of Ti4+-IMAC binding buffer (80% acetonitrile, 6% TFA) to Ti4+-IMAC column. Certain SCX fractions were combined and desalted, respectively, resuspended in 40 μl of loading buffer, and loaded on the equilibrated gel-loader tip microcolumn. Columns were sequentially washed with 60 μl of loading buffer, followed by washing using 60 μl of 50% acetonitrile, 0.5% TFA containing 200 mm NaCl and additional washing by 60 μl of 50% acetonitrile, 0.1% TFA to Ti4+-IMAC column, respectively. The bound peptides were eluted by 20 μl of 5% ammonia into 20 v of 10% formic acid and then stored at −20°C for LC-MS/MS analysis.
Mass Spectrometry
The analysis of the peptides was performed on a reversed phase nano-LC-coupled LTQ Orbitrap Classic, Discovery, or XL (Thermo Fisher Scientific). An Agilent 1200 series HPLC system was equipped with a 20-mm ReproSil-Pur 120 C18-AQ (Dr. Maisch, Ammerbuch-Entringen, Germany) trapping column (packed in-house, 100 μm inner diameter, 3-μm particle size) and a 400-mm ReproSil-Pur 120 C18-AQ (Dr. Maisch, Ammerbuch-Entringen, Germany) analytical column (packed in-house, 50 μm inner diameter, 3-μm particle size). As described previously (34), trapping was performed at 5 μl/min solvent C (0.1 m acetic acid in water) for 10 min, and elution was achieved with a gradient of 10–35% (v/v) of solvent D (0.1 m acetic acid in 80:20 acetonitrile/water) in 140 min with a total analysis time of 180 min. The flow rate was passively split from 0.60 ml/min to 100 nl/min when performing the elution. Nanospray was achieved using a distally coated fused silica emitter (360-μm outer diameter, 20-μm inner diameter, 10-μm tip inner diameter; constructed in-house) biased to 1.7 kV. Survey full scan MS spectra were acquired from m/z 350 to m/z 1500 in the Orbitrap with a resolution of 60,000 at m/z 400 after accumulation to a target value of 500,000 in the linear ion trap with a target value of 30,000. The 10 most intense peaks were fragmented in the linear ion trap using collision-induced dissociation.
Data Analysis
All MS/MS spectra were centroided and merged to a single peak list file using MaxQuant (version 1.0.13.13) MaxQuant.org, which was searched using the Mascot search engine (version 2.2.0, Matrix Science, London, UK) containing a total 67,344 entries (which includes contaminants and an equivalent number of decoy sequences) generated from the publicly available Arabidopsis database (The Arabidopsis Information Resource (TAIR9); June 2009; file name, TAIR9_pep_20090619) with carbamidomethylcysteine as a fixed modification. Oxidized methionine and phosphorylation (serine, threonine, and tyrosine) were searched as variable modifications. Searches were done with tryptic specificity allowing two miscleavages and an initial tolerance on mass measurement of 50 ppm in MS mode and 0.6 Da for MS/MS ions and a score cutoff of 20. The resulting .dat files were exported and filtered for a <1% false discovery rate at the peptide level using the in-house developed software Rockerbox (Version 1.1.0) (35). Relative quantification ratios of the identified phosphopeptides and protein were derived by MSQuant MSQuant.sourceforge.net (MSQ2.0b4, 2010-02-25) (36). Proteins were quantified with at least two unique nonphosphopeptides or a single peptide with a score no less than 60. The phosphopeptide ratio was normalized by dividing the ratio of its protein of origin. To determine whether phosphorylation ratios for normalized peptides were significantly different, a p value was generated using significance B, which is part of the MaxQuant package (37). The changes were considered significant at a p value of 0.05 or less.
Data comparison was done as describe before (38). For comparison at the phosphopeptide level, the most recent full dataset with experimental sites was downloaded from PhosPhAt 4.0 (39). Phosphopeptides with ambiguous residues denoted as s, t, etc., were converted to S and T, respectively. In addition, we used supplemental Table S1 from Lan et al. (50) for phosphopeptide comparison. Modifications other than nonambiguous phosphorylation were ignored resulting in a reduction from the original 879 phosphopeptides to 556 peptides. We used Pep2Pro “TAIR10 wos” dataset (40) for comparison at the protein level.
A scaffold file containing all annotated spectra alongside confidence levels at the peptide and protein level can be accessed at the publicly available repository Tranche using the following hash code: http://cptac.tranche.proteomecommons.org/RppitjZezgEgP9QpIzd9UaeC3Vkn9Wyv/Jf/YuK6PAym9hSq9n7pIeFgjU9DEqWNWVEZQQJqV7nOfcDTHTr2rFOHO1sAAAAAAAACWQ== (Pass Phrase: snx1).
Plant Materials and Constructs
Seeds were germinated on plates containing MS medium (0.5× Murashige and Skoog salt mixture, 1% sucrose, and 0.5 g/liter MES, pH 5.8) and 0.8% agar and later transferred to soil. Plants were grown under long day conditions of 16 h of light and 8 h of dark. Sequence of SNX1 cDNA was amplified from Col-0 cDNA using the primer combinations listed in supplemental Table 6. The PCR fragment was cloned into pGEM®-T Easy (Promega) and sequenced. The mutation reaction was carried out as described below, which included 25 ng of purified plasmid as template, 2 mmol/liter overlapping mutagenesis primers, 1× buffer, 5 mmol/liter Mg2+, 2 mmol/liter dNTPs mixture, 1 μl of Pfu DNA polymerase (2.5 units/μl) and water to a final volume of 50 μl. The amplification reactions began with an initial denaturation step for 3 min at 95°C, followed by 16 cycles of denaturation temperature of 95°C for 30 s, annealing temperature of 55°C for 1 min, and extension temperature of 68°C for 5 min, and finished with final extension for 10 min. One μl of DpnI (10 units/μl) restriction enzyme was added, and reaction was incubated at 37°C for 1 h to digest the parental supercoiled dsDNA. One μl of DpnI-treated DNA was transformed to supercompetent cells according to the protocol. The mutation sites were confirmed by sequencing. The primer sequences for site-directed mutagenesis were also listed in supplemental Table 6. These constructs were generated in pGreenII plasmids, transferred to agrobacterium strain C58, and used to generate transgenic plants by floral dipping.
Estradiol Inductions
For induction studies, we made use of a modified novel two-component system,2 using a pG1090 promoter to express the estradiol-binding transcription factor XVE (41). The SNX1-coding sequence was inserted downstream of the LexA operator −46 minimal 35S promoter (41) and fused to GFP. pG1090::XVE;SNX1:GFP seedlings were germinated on plates containing MS medium and 25 μm estradiol dissolved in DMSO. Three days after germination, the seedlings were either transferred to fresh MS medium supplemented with 25 μm estradiol (Sigma) or harvested for protein extraction.
Growth Phenotype Observation
The T3 homozygous seeds were vapor phase-sterilized for 3–4 h. After washing five times with sterilized water, the seeds were sowed individually on ½GM medium plus 25 μm estradiol. After sowing, the plates were stored at 4°C in the dark for 3–4 days vertically. Plates were transferred to long day growth conditions to germinate vertically. Three days after germination, the seedlings were transferred to fresh medium; the primary root growth was recorded on days 3, 6, and 9 and measured by ImageJ (National Institutes of Health, Bethesda). Pictures were taken on days 6 and 9 to keep track of the lateral root. The lateral root and adventitious roots were counted using Photoshop (Adobe Systems Inc, San Jose, CA).
RESULTS AND DISCUSSION
Modification of the LRIS for Proteomics
Auxin-induced divisions in xylem pole pericycle (XPP) are associated with expression of auxin-responsive synthetic promoter DR5 as well as PLETHORA gene expression (42). DR5 expression precedes the initial division by several hours, whereas PLT3 and PLT7 expressions are only switched on when asymmetric divisions are initiated in the daughter cells that will go on to become lateral root initial cells.3 We used pPLT3::GUS and pPLT3::eCFP marker lines to observe early divisions of XPP cells and lateral root formation (supplemental Fig. 1, a and b). The LRIS as described by Beeckman and co-workers (20, 29) uses polar auxin transport inhibitor NPA during the first 3 days post-germination (dpg) to prevent the initiation of lateral root primordia. Germination on NPA leads to agravitropic root growth, hampering root harvesting at a scale required for proteomics samples (data not shown). To avoid agravitropic growth during the first days, seeds were germinated and grown on medium without NPA. Within 72 h after germination, seedlings were transferred to medium containing NPA for an additional 72 h of NPA treatment and subsequently transferred to medium without NAA (mock) or medium with 10 μm NAA. No pPLT3::GUS expression was detected in the pericycle of the new root tissue after mock treatment (supplemental Fig. 1e); however, 10 μm NAA synchronously induced glucuronidase expression (supplemental Fig. 1, c and f). With similar NPA pretreatment and 20 h of NAA treatment, pPLT3::eCFP expression and cell division was specific for the pericycle layer along the distal differentiation zone (supplemental Fig. 1, d and g). Transfer to NPA efficiently inhibited new formation of lateral root primordia. Subsequent exogenous application of 10 μm NAA was then used to induce divisions of XPP cells with similar synchrony as reported previously (20).
Metabolic Labeling of Arabidopsis Root Tissue
Metabolic incorporation of stable isotopes at the whole organism level is preferential to post-extraction labeling if small variations in protein or protein phosphorylation levels have to be accurately determined. We used seeds from hydroponically grown plants fertilized exclusively with 15N- or 14N-labeled salts to obtain stable isotope-labeled seeds. The 15N-labeled seeds were then germinated and grown on ½MS medium containing 15N-labeled salts as the sole nitrogen source to obtain root tissue with a high 15N-stable isotope incorporation rate. The incorporation of 15N in root samples was analyzed. Unmodified ½MS medium containing 15N generated an incorporation level of 97% (data not shown) suggesting a source of contamination with 14N. When seedlings were grown on 15N ½MS medium lacking vitamins, the incorporation rate increased to 99% (see supplemental Fig. 2b for an example spectrum). Seedling growth on ½MS medium with or without vitamins was compared up to 7 dpg and shown to be equivalent (supplemental Fig. 2a). The use of 15N containing ½MS medium lacking vitamins resulted in a sufficient level of incorporation to perform the quantitative proteomics screens.
Workflow of Reciprocal Labeling Experiments
To identify auxin-induced differentially phosphorylated proteins in LRIS, two reciprocal biological replicas were performed (Fig. 1). In the first biological replica, following the NPA treatment, the 15N-labeled root sample was used as control, and the 14N-labeled sample was NAA-treated. In the inversely labeled biological replica, the 14N-labeled sample was used as control, and the 15N-labeled sample was treated with NAA (see “Materials and Methods”). We used several different phospho-antibodies, including antibodies raised against phosphorylated threonine (α-Thr(P)) and tyrosine (α-Tyr(P)) as well as against the phosphorylated activation loop of MAPKs (α-p42/44 ERK, Cell Signaling Technology) in an attempt to detect early changes in protein phosphorylation upon auxin treatment; however, no obvious change induced by NAA specifically could be observed at the time points we tested (data not shown). The range of time points tested were 3, 5, 10, 20, 30, 60, and 120 min after addition of auxin or auxin analogues. Therefore, we chose a time point that is the same as the earliest transcriptome analysis (30). Mock and NAA-treated root tissue were harvested at 2 h post-transfer, and proteins were extracted, pooled at a 1:1 ratio, and digested. Trypsinized peptides were enriched by the use of low pH SCX (33, 43, 44) to enrich the phosphopeptides in the early fractions followed by Ti4+-IMAC for further enrichment of later fractions (6, 7, 45, 46). These fractions were analyzed by LC-MS-MS to identify the proteome and enriched phosphoproteome (Fig. 1). The phosphopeptides and nonmodified peptides were selected and quantified using MSQuant (36) and selected pairs were manually checked. Quantified ratios were extracted using StatQuant (47).
Fig. 1.

Workflow of reciprocal labeling experiments. Reciprocally labeled NAA or mock-treated roots are harvested. Extracted proteins are mixed, digested, and fractionated. Phosphopeptides are enriched by SCX and Ti4+-IMAC and subsequently analyzed by LC-MS-MS. Mascot and MSQuant are used for peptide identification and quantification, respectively.
Quantification of Proteins
In two experiments, 22,435 nonphosphorylated peptides were identified and quantified, which were derived from 3266 proteins (supplemental Table 1). Among the nonphosphoproteins, 1817 proteins overlapped in the two experiments. We compared our root proteome dataset to the Pep2Pro database, which is the most comprehensive plant proteome database available that contains tissue-specific information (40). Out of the 3266 proteins identified in our dataset, 3180 were also present in the Pep2pro database. From this overlap, there were 106 proteins that were only identified in root samples in the Pep2Pro database (supplemental Table 5). The vast majority of these proteins were identified by multiple spectra in Pep2Pro. Out of all quantified proteins, eight proteins had a ratio of >4 compared with the control. These included known auxin early responsive proteins such as two indole-3-acetic acid amido synthetase GH3 proteins (AT4G37390 ratio 44.3 and AT2G23170 ratio 33.7) (48) and a calcium ion-binding protein Touch 3 (AT2G41100 ratio 5.4) (supplemental Table 1) (49). The most prominent down-regulated protein in both experiments was a dormancy/auxin-associated family protein AT2G33830 that showed a 2-fold change. The up-regulation of GH3 and Touch3 and down-regulation of dormancy/auxin-associated protein are consistent with the data from the transcript analysis using LRIS (30), providing validity to our proteomics experiments. Furthermore, our data show that the vast majority of the identified proteins did not change in abundance in response to 2 h of auxin treatment.
Quantification of Phosphopeptides and Normalization by Its Protein of Origin
In total, 3068 phosphopeptides were quantified in two reciprocal biological replicas (supplemental Table 2). The first replica contained a total of 1756 quantified phosphopeptides, and the second replica contained 2319 quantified phosphopeptides, with an overlap of 57% (1007 peptides, supplemental Table 2). The two combined datasets represent one of the largest available Arabidopsis quantitative phosphoproteomic datasets to date (10, 39). We compared our phosphopeptides to all experimental phosphopeptides in the PhosPhAt 4.0 database (39). Between our dataset and the PhosPhAt database, 1147 phosphopeptides overlapped (supplemental Table 5 and supplemental Fig. 8). In addition, we also compared our dataset with a root phosphopeptide dataset recently published and not included in PhosPhAt database (50). The supplementary data file with all phosphopeptides from Lan et al. (50) contained 556 unique phosphopeptides and showed an overlap of 166 phosphopeptides with our dataset (supplemental Table 5 and supplemental Fig. 8). Only 120 phosphopeptides were present in all three datasets, showing that more than half of our root-derived phosphopeptides were not reported before.
The changes in abundance of these peptides could indicate both changes in levels of the respective protein as well as differential phosphorylation. In two experiments, 980 and 982 phosphopeptides were normalized against their originating protein (Fig. 2a and supplemental Table 3). After normalization, 31 and 37 phosphopeptides were found to be more than 2-fold differentially phosphorylated in the respective replicas (supplemental Table 3). Among the overlapping phosphopeptides, 330 could be normalized in both replicas (Fig. 2a and supplemental Table 4). Aided by MaxQuant significance B analysis, we selected peptides significantly and differentially phosphorylated in both biological replicas. To be included in the final set of significantly differential phosphopeptide, ratios for both biological replicas had to show change in the same direction. Out of the combined sets, the average ratio of 20 phosphopeptides was observed to be significantly differentially phosphorylated after 2 h of auxin induction in both experiments (Table I).
Fig. 2.

Filtering of phosphoproteomic data and performing normalization of phosphopeptides against their respective protein levels. a, Venn diagram indicates overlap in phosphopeptide and nonmodified protein populations for both biological replicas. The intersection corresponds to phosphopeptides whose protein of origin is also detected by peptides in a nonmodified form. Middle, Venn diagram shows overlap of phosphopeptides within these intersections between the two labeling experiments. b, phosphopeptides observed in both experiments normalized by nonmodified protein level. S-Curve depicts average ratio (across both experiments). Ratios of these 330 peptides are ranked from low to high. See Table I and supplemental Table 4 for list of phosphoproteins.
Table I. Identified differentially regulated phosphopeptides normalized by proteins in both experiments.
Peptides sequences are listed in peptide ID; capital letters in the peptide sequence column indicate amino acids; lowercase p indicates phosphorylation of the serine, threonine, or tyrosine residue that follows, and (ox) indicates oxidation of the methionine that follows. The average of auxin to control ratio, standard deviation (STD), and p value are listed for each differentially regulated peptide. The AG code and description of the proteins are listed.
| Peptide ID | Ratio | STD | p value | Protein | Description |
|---|---|---|---|---|---|
| VTSESDFMpTEpYVVTR | 2.689177 | 0.892041 | 5.68541E-09 | AT2G43790.1 | MAPK 6 |
| TVAAVAGSPGpTPTTPGSAR | 1.739921 | 0.026916 | 0.001266819 | AT2G33830.1 | Dormancy/auxin-associated family protein |
| TVAAVAGSPGTPpTTPGSAR | 1.715228 | 0.027397 | 0.001701282 | AT2G33830.1 | Dormancy/auxin-associated family protein |
| SASSPpSQAVSQSSSQSK | 1.61825 | 0.110709 | 0.005269285 | AT5G42950.1 | GYF domain-containing protein |
| AATApSpSEASEGPVMGLINK | 1.610572 | 0.242289 | 0.005750693 | AT1G27090.1 | Glycine-rich protein |
| VPEAQITNpSATPTTpTPR | 1.58007 | 0.054565 | 0.008111699 | AT4G39680.1 | SAP domain-containing protein |
| SDpSGINGVDFTEK | 1.524053 | 0.148322 | 0.015030633 | AT5G40390.1 | SIP1 (seed imbibition 1-like) |
| QLpSLDQFQNESR | 1.520887 | 0.17187 | 0.015554228 | AT4G03080.1 | Elch repeat-containing serine/threonine phosphoesterase family protein |
| VGIPNQPQPSQPPpSPIPANGSR | 1.510716 | 0.21614 | 0.017354727 | AT5G18230.1 | Transcription regulator NOT2/NOT3/NOT5 family protein |
| TTATNTGGTpTTPAITTTAAK | 1.466798 | 0.160624 | 0.027610849 | AT4G36750.1 | Quinone reductase family protein |
| NISGSMQpSPR | 1.423583 | 0.081446 | 0.04296724 | AT5G06140.1 | SNX1, ATSNX1 | SNX1 (SORTING NEXIN 1) |
| SPTVVTVQPpSSPR | 1.421118 | 0.012852 | 0.044043963 | AT1G11360.1 | Universal stress protein |
| QVLQGPSATVNpSPR | 1.420461 | 0.082142 | 0.04433552 | AT3G60240.2 | EIF4G (EUKARYOTIC TRANSLATION INITIATION FACTOR 4G) |
| (ox)MApSIDVHLR | 0.745373 | 0.009821 | 0.040745486 | AT1G53310.1 | ATPPC1 | ATPPC1 (PHOSPHOENOLPYRUVATE CARBOXYLASE 1) |
| VDpSSGDVCGATFK | 0.737103 | 0.103317 | 0.033995214 | AT5G43830.1 | Unknown protein |
| EASDGSTLpSPDSASK | 0.736016 | 0.048346 | 0.033178149 | AT4G27060.1 | TOR1, SPR2, CN | TOR1 (TORTIFOLIA 1); microtubule binding |
| AFFDpSADWALGK | 0.718891 | 0.064460 | 0.022248212 | AT1G69510.1 | FUNCTIONS IN: molecular_function unknown |
| STpTPTPIPNLMPPSR | 0.69543 | 0.236039 | 0.012202556 | AT3G48860.1 | Unknown protein |
| NVETNTPEHVpSQTETSAK | 0.663993 | 0.047132 | 0.004906113 | AT2G35050.1 | Protein kinase family protein |
| VApTPVPEPK | 0.628052 | 0.23889 | 0.001460951 | AT4G28300.1 | Hydroxyproline-rich glycoprotein family protein |
Auxin-induced Differentially Phosphorylated Proteins
In our dataset, we can identify several proteins known to be involved in auxin signaling as differentially phosphorylated, and some of these were only observed in one biological replica (supplemental Table 2). These include two ABCB/PGP P-glycoproteins, MDR1 and MDR4 and a PIN-FORMED (PIN) family protein, PIN2 (51). MDR proteins are members of the ancient ATP-binding cassette protein superfamily (53). The roles of auxin transport of these two proteins in lateral root development have been investigated (54, 55). It has been shown that impaired rootward auxin transport due to mutation of the MDR1 gene and impaired shootward auxin transport in MDR4 mutations (55). Mutation of the MDR1 also caused 21% of nascent lateral roots to arrest their growth and the remainder to elongate 50% more slowly than the wild type (54). The phosphorylation of the two MDR proteins was observed before in response to stimuli other than the auxin itself (6, 56–59). The differential phosphorylation upon auxin treatment could indicate that the function of these two auxin carriers is modulated upon auxin perception.
The auxin efflux protein PIN2 has been proposed to be involved in root gravitropism (60) and lateral root formation (61). Recently, it has been shown that phosphorylation of the middle serine in three conserved TPRXS(N/S) motifs within the PIN central hydrophilic loop invoked recruitment of PINs into the shootward recycling (62–64). Surprisingly, we observed one phosphorylated peptide of PIN2 that was down-regulated upon auxin treatment (supplemental Table 2). Whether this novel phospho-site also plays a role in direct PIN localization remains as an open question.
Phosphorylation of an auxin-responsive factor ARF2 was also up-regulated in one replica (supplemental Table 2). ARF2 acts as a repressor in auxin signaling and is detected in the vascular tissue and the initiation sites of lateral roots (65). ARF2 was shown to regulate senescence and floral organ abscission, and ARF2 links auxin signaling, cell division, and the size of seeds and other organs (66). More recently, it was shown that miR390 targets ARF2, -3 and -4 during lateral root growth (67). It was also reported previously that phosphorylation leads to loss of ARF2 DNA binding and repression activities (68). Auxin does not influence ARF2 protein abundance (69), indicating that de-repression of ARF2 is different from proteasome-mediated degradation of AUX/IAA (70). It is possible that disassociation from DNA and loss of repression of ARF2 are regulated by phosphorylation upon auxin treatment.
Some proteins are shown to be up-regulated in both replicates (supplemental Table 2), such as ribosomal protein S6 (RPS6). In animals, the analyses of mutants lacking ribosomal protein S6 kinase have indicated that RPS6 phosphorylation is required for reentry of quiescent cells into the cell cycle through promotion of translation of mRNAs that possess a 5′-terminal polypyrimidine track. These mRNAs predominantly encode components of the translational apparatus that are required for cell growth and proliferation (71, 72). In plants, the phosphorylation of RPS6 is developmentally programmed and regulated by temperature, oxygen availability, and other growth conditions (59). The stimulation of RPS6 phosphorylation upon transfer of cultured Arabidopsis cells to fresh medium containing auxin and kinetin was inhibited by pretreatment of cells with anti-auxin or phosphatidylinositol 3-kinase drugs (73). Recently, it was shown that rps6 mutants had a short primary root, and the slow root growth was due to a reduced meristem activity (74). The initiation of lateral root primordia and auxin-induced XPP division in the LRIS requires reentry into the cell division of differentiated pericycle cells. Therefore, the phosphorylation of RPS6 protein induced upon auxin treatment is consistent with the functional importance of these phospho-sites. Further experiments are needed to address whether the regulation of S6 phosphorylation by auxin affects translation of mRNA-related growth and proliferation or influences global change of mRNA in plants.
Beside the up-regulated phosphoproteins, phosphorylation of some proteins was down-regulated upon auxin treatment (supplemental Table 2), including suppressor of auxin resistance 3 (SAR3). SAR3 encodes a putative nucleoporin of the NUP107-120 subcomplex (75). In a related human study, it is believed that phosphorylation regulated the breakdown of the nuclear envelope at mitosis and the disassembly of the nuclear pore complex into different subcomplexes. In Arabidopsis, it has been suggested that defects in this complex restore partial auxin sensitivity to auxin-resistant 1 (axr1) mutants by affecting the translocation of the Aux/IAA17 proteins into the nucleus. The loss function of SAR3 results in a severe growth phenotype, including short primary root and lower lateral root density (76). The observed reduction in phosphorylation of the SAR3 protein could indicate that in Arabidopsis phosphorylation of SAR3 might also be involved in breaking down the nuclear envelope.
Proteins with significant differential phosphorylation in response to auxin are shown in Table I. Only two of these proteins have previously been linked to auxin signaling. One of these is mitogen-activated protein kinase MPK6, which comes out as differentially double-phosphorylated (2.69 ± 0.89, Table I). This MAPK functions in several stress responses in Arabidopsis (77–79). Induction of phosphorylation of MPK by auxin has been reported before (80) but remains controversial. We tested differential phosphorylation after induction with p-chlorophenoxy-isobutric acid (PCIB) and 1-napthoxyacetic acid (1-NOA) auxin analogues, which are biologically inactive, instead of the active NAA. MPK6 was transiently activated under all four conditions, including the mock treatment, although activation by NAA at 1 h post-induction was notably higher when compared with the mock at 1 h post-induction (supplemental Fig. 3). However, at least one inactive auxin analogue, 1-NOA, induced activation of MPK6 to the level observed for NAA (supplemental Fig. 3). Hence, auxin induction of MPK6 phosphorylation is likely caused by off-target effects induced by auxin analogues. Interestingly, we also found one B4 group MPKKK (81) was down-regulated (0.66 ± 0.04, Table I). Whether this change is linked to the increase of phosphorylation of MPK6 and is related to auxin signaling needs further investigation.
Functional Analysis of Phosphoprotein SNX1
Another protein whose phosphorylation status was enhanced in response to auxin (Table I) was sorting nexin1 (SNX1, ratio 1.42 ± 0.08). Because SNX1 was previously described to be involved in lateral root development (5, 32) but not described previously as a phosphorylated protein, we chose this phosphorylation site as a target for a proof-of-principle analysis for our method to detect biologically meaningful changes in phosphorylation. Amino acid substitutions were made for serine 16 of SNX1 to test the role this phosphorylated serine plays in lateral root development. Serine 16 was mutated to glutamic acid to mimic phosphorylation or to alanine to mimic dephosphorylation.
The cDNAs of SNX1 and mutated versions SNX1S16A or SNX1S16E were fused with GFP and expressed under the control of the estradiol-inducible XVE construct (41) in the Arabidopsis Col-0 background. For each construct, six nonsegregating lines were analyzed for primary root growth and lateral root density. Overexpression of SNX1-GFP had a mild but significant impact on primary root growth and lateral root density as compared with Col-0 (supplemental Fig. 4, a and b). For six dpg, five out of six lines had slightly shorter primary roots and increased lateral root densities (supplemental Fig. 4, a and b). However, this effect decreased by day 9, and one line showed a shorter primary root, and two lines showed lower lateral root density (supplemental Fig. 4, a and b). In contrast to the minor effect of SNX1 overexpression, SNX1S16A and SNX1S16E overexpression showed a much more pronounced effect on primary root growth and lateral root development. Two out of six lines overexpressing SNX1S16A showed a significant suppression of growth, with a shorter primary root, smaller cotyledons and leaves, and low lateral root densities at 6 and 9 dpg (Fig. 3, a–c and supplemental Fig. 4, c and d). In lines overexpressing SNX1S16E, the phenotypes were even stronger; all six lines tested showed significant reduction of primary root growth at 6 and 9 dpg, and four of these lines showed very severe reduction in lateral root density (Fig. 3, a–c, and supplemental Fig. 4, e and f). Without sucrose, a proportion of snx1-1 and snx1-2 seedlings arrest growth (52). The induction of SNX1S16E-GFP also caused growth arrest on medium without sucrose (Fig. 3d and data not shown). On medium without estradiol, seedlings transformed either with SNX1-GFP or SNX1S16E-GFP grew similarly (supplemental Fig. 5). Out of four lines with strong inhibition phenotype overexpressing SNX1S16E (Fig. 3), three lines showed high (E5, E6, and NE4) and one line showed intermediate expression levels (NE2) (Fig. 4). The two SNX1S16A overexpression lines showing the strongest inhibition phenotype also had intermediate (NA1) and high expression levels (NA4) (Fig. 4, compare with Fig. 3). The intermediate SNX1S16A-GFP NA1 line displayed reduced growth without inducer, even though the inducer could enhance the growth phenotype (data not shown). Confocal laser scanning microscopy analysis of the localization of SNX1-GFP and mutant protein indicated that WT and mutant proteins localized similarly in the meristematic cells (supplemental Fig. 6 and data not shown). In some lines with high overexpression of SNX1S16E, we observed accumulation at the periphery of the cell (supplemental Fig. 6). These data indicate that mutation of serine 16 may cause mislocalization of the protein. This might indicate that the overexpression of SNX1S16E either causes accumulation of a stabilized SNX1 protein or a failure in trafficking of the protein to its proper location. Reduced lateral root numbers can be caused by initiation or emergence defects (27). At 6 dpg, differential interference contrast microscopy showed that, as compared with wild type seedlings, SNX1 lines, which all had similar expression level, had similar lateral root primordia density and emerged lateral root density (Figs. 5a and 4). In contrast, the two SNX1S16A lines NA1 and NA4, which had similar expression level (NA1) or higher expression level compared with control lines, had reduced lateral root numbers but similar lateral root primordia numbers (Figs. 5a and 4). Two SNX1S16E lines E5 and NE2 displayed similar defects, and the E6 line had significant influence on primordia, which either had a similar expression level of the control line (NE2) or a high expression level (E5 and E6, Figs. 5a and 4). Over the main root length, the number of primordia remained constant, so that the lack of emergence of lateral root primordia seems to be the primary defect. Differential interference contrast microscopy corroborates the presence of normal stage II primordia in all lines (Fig. 5b). However, phosphomutant lines arrested aberrantly structured primordia after stage IV (Fig. 5b). In conclusion, SNX1 Ser-16 phosphorylation site mutants affect primordium outgrowth.
Fig. 3.
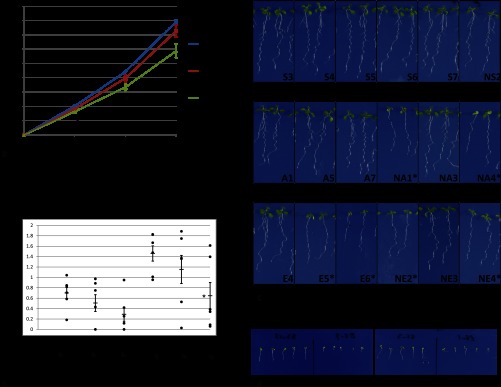
Inhibition of primary root growth and lateral root of SNX1 mutation. a, growth of primary roots at days 3, 6, and 9; averages of six independent lines continuously expressing SNX1-GFP, SNX1S16A-GFP, or SNX1S16D-GFP are shown; error bars depict S.E. Primary root of SNX1S16E-GFP shows significant differences from SNX1-GFP growth in all the time points tested, marked with asterisk (p < 0.05, Student's t test). b, average lateral root numbers are shown as a rectangle; numbers of individual lines are shown as black dots, and error bars depict S.E. SNX1S16E-GFP shows significant difference from SNX1-GFP at day 9 as marked with asterisk (p < 0.05). c, two representative seedlings from each line at day 9 are shown; lines with severe reduction of growth and low density of lateral roots are marked with asterisk. d, 3-day seedlings of two SNX1S16E-GFP lines showed growth arrest on ½GM without sucrose.
Fig. 4.

SNX1-GFP and mutant expression level. Western blot with 3-dpg seedling expression level was detected by anti-GFP antibody; Coomassie Brilliant Blue staining is shown as the loading control. Lines with severe lateral root inhibition phenotype in Fig. 3 are marked with asterisk.
Fig. 5.

Influence of lateral root patterning of SNX1 phosphorylation mutant. a, average of primordial densities (n >5, blue bars) and emerged lateral root densities (n >5, red bars) of wild type Col-0, SNX1-GFP, SNX1S16A-GFP, and SNX1S16E-GFP on 6 dpg; error bars represent S.E. Significant differences of SNX1-GFP, SNX1S16A-GFP, and SNX1S16E-GFP to Col-0 are marked with asterisks (*, 0.01 < p < 0.05; **, 0.001 < p < 0.01; ***, p < 0.001). b, representative primordia in 6-day-old seedlings of Col-0, SNX1-GFP, SNX1S16A-GFP, and SNX1S16E-GFP lines at stage II (top panel) or stage IV (bottom panel).
Taken together, our data indicate that overexpression of SNX1S16E or SNX1S16A causes a developmental growth phenotype. It has been shown previously that SNX1 regulates auxin efflux carrier PIN2 degradation (52), and pin mutants display lateral root phenotypes (61). It also has been shown that PIN2 and SNX1 co-localized during gravity stimulus (32) so one possibility is that SNX1 phosphorylation might influence auxin flux through PIN proteins. The fact that both mutations from Ser to Glu and Ser to Ala have a general negative influence on growth and root development when overexpressed suggests that serine 16 plays an important role in the regulation of SNX1 but does not illuminate the role for phosphorylation at that residue. In addition to serine at position 16, we also detected nondifferential phosphorylation at serine 19 in one replica (ratio 1.17 in supplemental Table 3b). Mutations of this serine 19 to glutamate or alanine were also investigated. Overexpression of some of those lines showed a similar suppressive phenotype on seedling growth, primary root growth, and lateral root formation as did overexpression of the double mutation of SNX1S16A/S19A and SNX1S16D/S19D (supplemental Fig. 7 and data not shown). Despite the similar phenotypes caused by phosphomimic and loss of phosphorylation potential, which do not yet allow us to pinpoint the exact biological role of the detected site, our data reveal that novel SNX1 phosphorylation sites detected by our proteomics approach have functions in growth control in the entire plant, thus validating our screen for new phosphorylation sites.
Supplementary Material
Footnotes
* This work was supported in part by the PRIME-XS Project, European Union 7th Framework Program Grant 62067, The Netherlands Proteomics Centre, embedded in the Netherlands Genomics Initiative, and Netherlands Organization for Scientific Research VIDI Grant 700.10.429.
 This article contains supplemental material.
2 A. P. Mähonën et al., manuscript in preparation.
3 H. Hofhuis and B. Scheres, unpublished data.
1 The abbreviations used are:
- Ti4+-IMAC
- immobilized titanium ion affinity chromatography
- LRIS
- lateral root-inducible system
- SCX
- strong cation exchange chromatography
- PLT
- PLETHORA AP2 class putative transcription factor
- NPA
- N-1-naphthylphthalamic acid
- NAA
- 1-naphthalene acetic acid
- MS medium
- Murashige and Skoog medium
- Col-0
- Columbia ecotype
- IAA
- indole-3-acetic acid
- ARF
- Auxin Response Factor
- MDR
- multidrug resistance-like
- PIN
- PIN formed
- SAR
- Suppressor of Auxin Resistance
- RPS6
- ribosomal protein S6
- MPK
- mitogen-activated protein kinase
- SNX1
- sorting nexin1
- XPP
- xylem pole pericycle
- dpg
- days post-germination.
REFERENCES
- 1. Lemeer S., Heck A. J. (2009) The phosphoproteomics data explosion. Curr. Opin. Chem. Biol. 13, 414–420 [DOI] [PubMed] [Google Scholar]
- 2. Grimsrud P. A., Swaney D. L., Wenger C. D., Beauchene N. A., Coon J. J. (2010) Phosphoproteomics for the masses. ACS Chem. Biol. 5, 105–119 [DOI] [PMC free article] [PubMed] [Google Scholar]
- 3. Del Rosario A. M., White F. M. (2010) Quantifying oncogenic phosphotyrosine signaling networks through systems biology. Curr. Opin. Genet. Dev. 20, 23–30 [DOI] [PMC free article] [PubMed] [Google Scholar]
- 4. Thingholm T. E., Larsen M. R. (2009) The use of titanium dioxide micro-columns to selectively isolate phosphopeptides from proteolytic digests. Methods Mol. Biol. 527, 57–66 [DOI] [PubMed] [Google Scholar]
- 5. Jaillais Y., Santambrogio M., Rozier F., Fobis-Loisy I., Miège C., Gaude T. (2007) The retromer protein VPS29 links cell polarity and organ initiation in plants. Cell 130, 1057–1070 [DOI] [PubMed] [Google Scholar]
- 6. Benschop J. J., Mohammed S., O'Flaherty M., Heck A. J., Slijper M., Menke F. L. (2007) Quantitative phosphoproteomics of early elicitor signaling in Arabidopsis. Mol. Cell. Proteomics 6, 1198–1214 [DOI] [PubMed] [Google Scholar]
- 7. Zhou H., Low T. Y., Hennrich M. L., van der Toorn H., Schwend T., Zou H., Mohammed S., Heck A. J. (2011) Enhancing the identification of phosphopeptides from putative basophilic kinase substrates using Ti(IV)-based IMAC enrichment. Mol. Cell. Proteomics 10, M110 006452. [DOI] [PMC free article] [PubMed] [Google Scholar]
- 8. Zhou H., Ye M., Dong J., Han G., Jiang X., Wu R., Zou H. (2008) Specific phosphopeptide enrichment with immobilized titanium ion affinity chromatography adsorbent for phosphoproteome analysis. J. Proteome Res. 7, 3957–3967 [DOI] [PubMed] [Google Scholar]
- 9. Schulze W. X., Usadel B. (2010) Quantitation in mass-spectrometry-based proteomics. Annu. Rev. Plant Biol. 61, 491–516 [DOI] [PubMed] [Google Scholar]
- 10. Mithoe S. C., Menke F. L. (2011) Phosphoproteomics perspective on plant signal transduction and tyrosine phosphorylation. Phytochemistry 72, 997–1006 [DOI] [PubMed] [Google Scholar]
- 11. Kersten B., Agrawal G. K., Durek P., Neigenfind J., Schulze W., Walther D., Rakwal R. (2009) Plant phosphoproteomics: an update. Proteomics 9, 964–988 [DOI] [PubMed] [Google Scholar]
- 12. Gouw J. W., Krijgsveld J., Heck A. J. (2010) Quantitative proteomics by metabolic labeling of model organisms. Mol. Cell. Proteomics 9, 11–24 [DOI] [PMC free article] [PubMed] [Google Scholar]
- 13. Engelsberger W. R., Erban A., Kopka J., Schulze W. X. (2006) Metabolic labeling of plant cell cultures with K(15)NO3 as a tool for quantitative analysis of proteins and metabolites. Plant Methods 2, 14. [DOI] [PMC free article] [PubMed] [Google Scholar]
- 14. Lanquar V., Kuhn L., Lelièvre F., Khafif M., Espagne C., Bruley C., Barbier-Brygoo H., Garin J., Thomine S. (2007) 15N-Metabolic labeling for comparative plasma membrane proteomics in Arabidopsis cells. Proteomics 7, 750–754 [DOI] [PubMed] [Google Scholar]
- 15. Nelson C. J., Huttlin E. L., Hegeman A. D., Harms A. C., Sussman M. R. (2007) Implications of 15N-metabolic labeling for automated peptide identification in Arabidopsis thaliana. Proteomics 7, 1279–1292 [DOI] [PubMed] [Google Scholar]
- 16. Huttlin E. L., Hegeman A. D., Harms A. C., Sussman M. R. (2007) Comparison of full versus partial metabolic labeling for quantitative proteomics analysis in Arabidopsis thaliana. Mol. Cell. Proteomics 6, 860–881 [DOI] [PubMed] [Google Scholar]
- 17. Palmblad M., Bindschedler L. V., Cramer R. (2007) Quantitative proteomics using uniform 15N-labeling, MASCOT, and the trans-proteomic pipeline. Proteomics 7, 3462–3469 [DOI] [PubMed] [Google Scholar]
- 18. Bindschedler L. V., Palmblad M., Cramer R. (2008) Hydroponic isotope labelling of entire plants (HILEP) for quantitative plant proteomics; an oxidative stress case study. Phytochemistry 69, 1962–1972 [DOI] [PubMed] [Google Scholar]
- 19. Kline K. G., Barrett-Wilt G. A., Sussman M. R. (2010) In planta changes in protein phosphorylation induced by the plant hormone abscisic acid. Proc. Natl. Acad. Sci. U.S.A. 107, 15986–15991 [DOI] [PMC free article] [PubMed] [Google Scholar]
- 20. Himanen K., Boucheron E., Vanneste S., de Almeida Engler J., Inzé D., Beeckman T. (2002) Auxin-mediated cell cycle activation during early lateral root initiation. Plant Cell 14, 2339–2351 [DOI] [PMC free article] [PubMed] [Google Scholar]
- 21. Sabatini S., Beis D., Wolkenfelt H., Murfett J., Guilfoyle T., Malamy J., Benfey P., Leyser O., Bechtold N., Weisbeek P., Scheres B. (1999) An auxin-dependent distal organizer of pattern and polarity in the Arabidopsis root. Cell 99, 463–472 [DOI] [PubMed] [Google Scholar]
- 22. Kepinski S., Leyser O. (2005) The Arabidopsis F-box protein TIR1 is an auxin receptor. Nature 435, 446–451 [DOI] [PubMed] [Google Scholar]
- 23. Dharmasiri N., Dharmasiri S., Estelle M. (2005) The F-box protein TIR1 is an auxin receptor. Nature 435, 441–445 [DOI] [PubMed] [Google Scholar]
- 24. Teale W. D., Paponov I. A., Palme K. (2006) Auxin in action: signalling, transport, and the control of plant growth and development. Nat. Rev. Mol. Cell Biol. 7, 847–859 [DOI] [PubMed] [Google Scholar]
- 25. Kepinski S., Leyser O. (2004) Auxin-induced SCFTIR1-Aux/IAA interaction involves stable modification of the SCFTIR1 complex. Proc. Natl. Acad. Sci. U.S.A. 101, 12381–12386 [DOI] [PMC free article] [PubMed] [Google Scholar]
- 26. Welch D., Hassan H., Blilou I., Immink R., Heidstra R., Scheres B. (2007) Arabidopsis JACKDAW and MAGPIE zinc finger proteins delimit asymmetric cell division and stabilize tissue boundaries by restricting SHORT-ROOT action. Genes Dev. 21, 2196–2204 [DOI] [PMC free article] [PubMed] [Google Scholar]
- 27. Péret B., De Rybel B., Casimiro I., Benková E., Swarup R., Laplaze L., Beeckman T., Bennett M. J. (2009) Arabidopsis lateral root development: an emerging story. Trends Plant Sci. 14, 399–408 [DOI] [PubMed] [Google Scholar]
- 28. De Rybel B., Vassileva V., Parizot B., Demeulenaere M., Grunewald W., Audenaert D., Van Campenhout J., Overvoorde P., Jansen L., Vanneste S., Möller B., Wilson M., Holman T., Van Isterdael G., Brunoud G., Vuylsteke M., Vernoux T., De Veylder L., Inzé D., Weijers D., Bennett M. J., Beeckman T. (2010) A novel aux/IAA28 signaling cascade activates GATA23-dependent specification of lateral root founder cell identity. Curr. Biol. 20, 1697–1706 [DOI] [PubMed] [Google Scholar]
- 29. Casimiro I., Marchant A., Bhalerao R. P., Beeckman T., Dhooge S., Swarup R., Graham N., Inzé D., Sandberg G., Casero P. J., Bennett M. (2001) Auxin transport promotes Arabidopsis lateral root initiation. Plant Cell 13, 843–852 [DOI] [PMC free article] [PubMed] [Google Scholar]
- 30. Vanneste S., De Rybel B., Beemster G. T., Ljung K., De Smet I., Van Isterdael G., Naudts M., Iida R., Gruissem W., Tasaka M., Inzé D., Fukaki H., Beeckman T. (2005) Cell cycle progression in the pericycle is not sufficient for SOLITARY ROOT/IAA14-mediated lateral root initiation in Arabidopsis thaliana. Plant Cell 17, 3035–3050 [DOI] [PMC free article] [PubMed] [Google Scholar]
- 31. De Smet I., Vassileva V., De Rybel B., Levesque M. P., Grunewald W., Van Damme D., Van Noorden G., Naudts M., Van Isterdael G., De Clercq R., Wang J. Y., Meuli N., Vanneste S., Friml J., Hilson P., Jürgens G., Ingram G. C., Inzé D., Benfey P. N., Beeckman T. (2008) Receptor-like kinase ACR4 restricts formative cell divisions in the Arabidopsis root. Science 322, 594–597 [DOI] [PubMed] [Google Scholar]
- 32. Jaillais Y., Fobis-Loisy I., Miège C., Rollin C., Gaude T. (2006) AtSNX1 defines an endosome for auxin-carrier trafficking in Arabidopsis. Nature 443, 106–109 [DOI] [PubMed] [Google Scholar]
- 33. Gauci S., Helbig A. O., Slijper M., Krijgsveld J., Heck A. J., Mohammed S. (2009) Lys-N and trypsin cover complementary parts of the phosphoproteome in a refined SCX-based approach. Anal. Chem. 81, 4493–4501 [DOI] [PubMed] [Google Scholar]
- 34. Raijmakers R., Berkers C. R., de Jong A., Ovaa H., Heck A. J., Mohammed S. (2008) Automated online sequential isotope labeling for protein quantitation applied to proteasome tissue-specific diversity. Mol. Cell. Proteomics 7, 1755–1762 [DOI] [PMC free article] [PubMed] [Google Scholar]
- 35. van den Toorn H. W., Muñoz J., Mohammed S., Raijmakers R., Heck A. J., van Breukelen B. (2011) RockerBox: analysis and filtering of massive proteomics search results. J. Proteome Res. 10, 1420–1424 [DOI] [PubMed] [Google Scholar]
- 36. Mortensen P., Gouw J. W., Olsen J. V., Ong S. E., Rigbolt K. T., Bunkenborg J., Cox J., Foster L. J., Heck A. J., Blagoev B., Andersen J. S., Mann M. (2010) MSQuant, an open source platform for mass spectrometry-based quantitative proteomics. J. Proteome Res. 9, 393–403 [DOI] [PubMed] [Google Scholar]
- 37. Cox J., Mann M. (2008) MaxQuant enables high peptide identification rates, individualized p.p.b.-range mass accuracies and proteome-wide protein quantification. Nat. Biotechnol. 26, 1367–1372 [DOI] [PubMed] [Google Scholar]
- 38. Mithoe S. C., Boersema P. J., Berke L., Snel B., Heck A. J., Menke F. L. (2012) Targeted quantitative phosphoproteomics approach for the detection of phosphotyrosine signaling in plants. J. Proteome Res. 11, 438–448 [DOI] [PubMed] [Google Scholar]
- 39. Durek P., Schmidt R., Heazlewood J. L., Jones A., MacLean D., Nagel A., Kersten B., Schulze W. X. (2010) PhosPhAt: the Arabidopsis thaliana phosphorylation site database. An update. Nucleic Acids Res. 38, D828–D834 [DOI] [PMC free article] [PubMed] [Google Scholar]
- 40. Baerenfaller K., Hirsch-Hoffmann M., Svozil J., Hull R., Russenberger D., Bischof S., Lu Q., Gruissem W., Baginsky S. (2011) pep2pro: a new tool for comprehensive proteome data analysis to reveal information about organ-specific proteomes in Arabidopsis thaliana. Integr. Biol. 3, 225–237 [DOI] [PubMed] [Google Scholar]
- 41. Zuo J., Niu Q. W., Chua N. H. (2000) Technical advance: An estrogen receptor-based transactivator XVE mediates highly inducible gene expression in transgenic plants. Plant J. 24, 265–273 [DOI] [PubMed] [Google Scholar]
- 42. Parizot B., De Rybel B., Beeckman T. (2010) VisuaLRTC: a new view on lateral root initiation by combining specific transcriptome datasets. Plant Physiol. 153, 34–40 [DOI] [PMC free article] [PubMed] [Google Scholar]
- 43. Villén J., Gygi S. P. (2008) The SCX/IMAC enrichment approach for global phosphorylation analysis by mass spectrometry. Nat. Protoc. 3, 1630–1638 [DOI] [PMC free article] [PubMed] [Google Scholar]
- 44. Mohammed S., Heck A. J. (2011) Strong cation exchange (SCX)-based analytical methods for the targeted analysis of protein post-translational modifications. Curr. Opin. Biotechnol., 22(1), 9–16 [DOI] [PubMed] [Google Scholar]
- 45. Olsen J. V., Blagoev B., Gnad F., Macek B., Kumar C., Mortensen P., Mann M. (2006) Global, in vivo, and site-specific phosphorylation dynamics in signaling networks. Cell 127, 635–648 [DOI] [PubMed] [Google Scholar]
- 46. Pinkse M. W., Mohammed S., Gouw J. W., van Breukelen B., Vos H. R., Heck A. J. (2008) Highly robust, automated, and sensitive online TiO2-based phosphoproteomics applied to study endogenous phosphorylation in Drosophila melanogaster. J. Proteome Res. 7, 687–697 [DOI] [PubMed] [Google Scholar]
- 47. van Breukelen B., van den Toorn H. W., Drugan M. M., Heck A. J. (2009) StatQuant: a post-quantification analysis toolbox for improving quantitative mass spectrometry. Bioinformatics 25, 1472–1473 [DOI] [PubMed] [Google Scholar]
- 48. Staswick P. E., Serban B., Rowe M., Tiryaki I., Maldonado M. T., Maldonado M. C., Suza W. (2005) Characterization of an Arabidopsis enzyme family that conjugates amino acids to indole-3-acetic acid. Plant Cell 17, 616–627 [DOI] [PMC free article] [PubMed] [Google Scholar]
- 49. Antosiewicz D. M., Polisensky D. H., Braam J. (1995) Cellular localization of the Ca2+ binding TCH3 protein of Arabidopsis. Plant J. 8, 623–636 [DOI] [PubMed] [Google Scholar]
- 50. Lan P., Li W., Wen T. N., Schmidt W. (2012) Quantitative phosphoproteome profiling of iron-deficient Arabidopsis roots. Plant Physiol. 159, 403–417 [DOI] [PMC free article] [PubMed] [Google Scholar]
- 51. Friml J. (2010) Subcellular trafficking of PIN auxin efflux carriers in auxin transport. Eur. J. Cell Biol. 89, 231–235 [DOI] [PubMed] [Google Scholar]
- 52. Kleine-Vehn J., Leitner J., Zwiewka M., Sauer M., Abas L., Luschnig C., Friml J. (2008) Differential degradation of PIN2 auxin efflux carrier by retromer-dependent vacuolar targeting. Proc. Natl. Acad. Sci. U.S.A. 105, 17812–17817 [DOI] [PMC free article] [PubMed] [Google Scholar]
- 53. Titapiwatanakun B., Murphy A. S. (2009) Post-transcriptional regulation of auxin transport proteins: cellular trafficking, protein phosphorylation, protein maturation, ubiquitination, and membrane composition. J. Exp. Bot. 60, 1093–1107 [DOI] [PubMed] [Google Scholar]
- 54. Wu G., Lewis D. R., Spalding E. P. (2007) Mutations in Arabidopsis multidrug resistance-like ABC transporters separate the roles of acropetal and basipetal auxin transport in lateral root development. Plant Cell 19, 1826–1837 [DOI] [PMC free article] [PubMed] [Google Scholar]
- 55. Lewis D. R., Miller N. D., Splitt B. L., Wu G., Spalding E. P. (2007) Separating the roles of acropetal and basipetal auxin transport on gravitropism with mutations in two Arabidopsis multidrug resistance-like ABC transporter genes. Plant Cell 19, 1838–1850 [DOI] [PMC free article] [PubMed] [Google Scholar]
- 56. Reiland S., Messerli G., Baerenfaller K., Gerrits B., Endler A., Grossmann J., Gruissem W., Baginsky S. (2009) Large-scale Arabidopsis phosphoproteome profiling reveals novel chloroplast kinase substrates and phosphorylation networks. Plant Physiol. 150, 889–903 [DOI] [PMC free article] [PubMed] [Google Scholar]
- 57. Nühse T. S., Stensballe A., Jensen O. N., Peck S. C. (2004) Phosphoproteomics of the Arabidopsis plasma membrane and a new phosphorylation site database. Plant Cell 16, 2394–2405 [DOI] [PMC free article] [PubMed] [Google Scholar]
- 58. Nühse T. S., Bottrill A. R., Jones A. M., Peck S. C. (2007) Quantitative phosphoproteomic analysis of plasma membrane proteins reveals regulatory mechanisms of plant innate immune responses. Plant J. 51, 931–940 [DOI] [PMC free article] [PubMed] [Google Scholar]
- 59. Chang I. F., Szick-Miranda K., Pan S., Bailey-Serres J. (2005) Proteomic characterization of evolutionarily conserved and variable proteins of Arabidopsis cytosolic ribosomes. Plant Physiol. 137, 848–862 [DOI] [PMC free article] [PubMed] [Google Scholar]
- 60. Müller A., Guan C., Gälweiler L., Tänzler P., Huijser P., Marchant A., Parry G., Bennett M., Wisman E., Palme K. (1998) AtPIN2 defines a locus of Arabidopsis for root gravitropism control. EMBO J. 17, 6903–6911 [DOI] [PMC free article] [PubMed] [Google Scholar]
- 61. Laskowski M., Grieneisen V. A., Hofhuis H., Hove C. A., Hogeweg P., Marée A. F., Scheres B. (2008) Root system architecture from coupling cell shape to auxin transport. PLoS Biol. 6, e307. [DOI] [PMC free article] [PubMed] [Google Scholar]
- 62. Dhonukshe P., Huang F., Galvan-Ampudia C. S., Mähönen A. P., Kleine-Vehn J., Xu J., Quint A., Prasad K., Friml J., Scheres B., Offringa R. (2010) Plasma membrane-bound AGC3 kinases phosphorylate PIN auxin carriers at TPRXS(N/S) motifs to direct apical PIN recycling. Development 137, 3245–3255 [DOI] [PubMed] [Google Scholar]
- 63. Huang F., Zago M. K., Abas L., van Marion A., Galván-Ampudia C. S., Offringa R. (2010) Phosphorylation of conserved PIN motifs directs Arabidopsis PIN1 polarity and auxin transport. Plant Cell 22, 1129–1142 [DOI] [PMC free article] [PubMed] [Google Scholar]
- 64. Zhang J., Nodzynski T., Pencík A., Rolcík J., Friml J. (2010) PIN phosphorylation is sufficient to mediate PIN polarity and direct auxin transport. Proc. Natl. Acad. Sci. U.S.A. 107, 918–922 [DOI] [PMC free article] [PubMed] [Google Scholar]
- 65. Okushima Y., Mitina I., Quach H. L., Theologis A. (2005) AUXIN RESPONSE FACTOR 2 (ARF2): a pleiotropic developmental regulator. Plant J. 43, 29–46 [DOI] [PubMed] [Google Scholar]
- 66. Schruff M. C., Spielman M., Tiwari S., Adams S., Fenby N., Scott R. J. (2006) The AUXIN RESPONSE FACTOR 2 gene of Arabidopsis links auxin signalling, cell division, and the size of seeds and other organs. Development 133, 251–261 [DOI] [PubMed] [Google Scholar]
- 67. Marin E., Jouannet V., Herz A., Lokerse A. S., Weijers D., Vaucheret H., Nussaume L., Crespi M. D., Maizel A. (2010) miR390, Arabidopsis TAS3 tasiRNAs, and their AUXIN RESPONSE FACTOR targets define an autoregulatory network quantitatively regulating lateral root growth. Plant Cell 22, 1104–1117 [DOI] [PMC free article] [PubMed] [Google Scholar]
- 68. Vert G., Walcher C. L., Chory J., Nemhauser J. L. (2008) Integration of auxin and brassinosteroid pathways by Auxin Response Factor 2. Proc. Natl. Acad. Sci. U.S.A. 105, 9829–9834 [DOI] [PMC free article] [PubMed] [Google Scholar]
- 69. Li H., Johnson P., Stepanova A., Alonso J. M., Ecker J. R. (2004) Convergence of signaling pathways in the control of differential cell growth in Arabidopsis. Dev. Cell 7, 193–204 [DOI] [PubMed] [Google Scholar]
- 70. Dharmasiri S., Estelle M. (2002) The role of regulated protein degradation in auxin response. Plant Mol. Biol. 49, 401–409 [PubMed] [Google Scholar]
- 71. Jefferies H. B., Reinhard C., Kozma S. C., Thomas G. (1994) Rapamycin selectively represses translation of the “polypyrimidine tract” mRNA family. Proc. Natl. Acad. Sci. U.S.A. 91, 4441–4445 [DOI] [PMC free article] [PubMed] [Google Scholar]
- 72. Holland E. C. (2004) Regulation of translation and cancer. Cell Cycle 3, 452–455 [PubMed] [Google Scholar]
- 73. Turck F., Zilbermann F., Kozma S. C., Thomas G., Nagy F. (2004) Phytohormones participate in an S6 kinase signal transduction pathway in Arabidopsis. Plant Physiol. 134, 1527–1535 [DOI] [PMC free article] [PubMed] [Google Scholar]
- 74. Creff A., Sormani R., Desnos T. (2010) The two Arabidopsis RPS6 genes, encoding for cytoplasmic ribosomal proteins S6, are functionally equivalent. Plant Mol. Biol. 73, 533–546 [DOI] [PubMed] [Google Scholar]
- 75. Zhang Y., Li X. (2005) A putative nucleoporin 96 is required for both basal defense and constitutive resistance responses mediated by suppressor of npr1-1, constitutive 1. Plant Cell 17, 1306–1316 [DOI] [PMC free article] [PubMed] [Google Scholar]
- 76. Parry G., Ward S., Cernac A., Dharmasiri S., Estelle M. (2006) The Arabidopsis SUPPRESSOR OF AUXIN RESISTANCE proteins are nucleoporins with an important role in hormone signaling and development. Plant Cell 18, 1590–1603 [DOI] [PMC free article] [PubMed] [Google Scholar]
- 77. Asai T., Tena G., Plotnikova J., Willmann M. R., Chiu W. L., Gomez-Gomez L., Boller T., Ausubel F. M., Sheen J. (2002) MAP kinase signalling cascade in Arabidopsis innate immunity. Nature 415, 977–983 [DOI] [PubMed] [Google Scholar]
- 78. Menke F. L., van Pelt J. A., Pieterse C. M., Klessig D. F. (2004) Silencing of the mitogen-activated protein kinase MPK6 compromises disease resistance in Arabidopsis. Plant Cell 16, 897–907 [DOI] [PMC free article] [PubMed] [Google Scholar]
- 79. Rodriguez M. C., Petersen M., Mundy J. (2010) Mitogen-activated protein kinase signaling in plants. Annu. Rev. Plant Biol. 61, 621–649 [DOI] [PubMed] [Google Scholar]
- 80. Mockaitis K., Howell S. H. (2000) Auxin induces mitogenic activated protein kinase (MAPK) activation in roots of Arabidopsis seedlings. Plant J. 24, 785–796 [DOI] [PubMed] [Google Scholar]
- 81. MAPK Group (2002) Mitogen-activated protein kinase cascades in plants: a new nomenclature. Trends Plant Sci. 7, 301–308 [DOI] [PubMed] [Google Scholar]
Associated Data
This section collects any data citations, data availability statements, or supplementary materials included in this article.