

Abstract
Argonaute2 (Ago2) is an established component of the microRNA-induced silencing complex. Similar to miR-375 loss-of-function studies, inhibition of Ago2 in the pancreatic β-cell resulted in enhanced insulin release underlining the relationship between these two genes. Moreover, as the most abundant microRNA in pancreatic endocrine cells, miR-375 was also observed to be enriched in Ago2-associated complexes. Both Ago2 and miR-375 regulate the pancreatic β-cell secretome, and by using quantitative mass spectrometry, we identified the enhanced release of a set of proteins or secretion “signatures ” in response to a glucose stimulus using the murine β-cell line MIN6. In addition, the loss of Ago2 resulted in the increased expression of miR-375 target genes, including gephyrin and ywhaz. These targets positively contribute to exocytosis indicating they may mediate the functional role of both miR-375 and Ago proteins in the pancreatic β-cell by influencing the secretory pathway. This study specifically addresses the role of Ago2 in the systemic release of proteins from β-cells and highlights the contribution of the microRNA pathway to the function of this cell type.
The four mammalian Argonaute proteins mediate the microRNA pathway in mammalian cells by recruiting the noncoding RNAs to interact with their target mRNAs (1, 2). Whereas 60% of all mRNAs are predicted to be targets of microRNAs, the function of individual Argonaute proteins in this process is largely uncharacterized (3). Interestingly, only total loss of Argonaute2 (Ago2) expression results in embryonic lethality, although genetic deletion of the other family members does not appear to influence embryonic development in the mouse (4). In addition, Ago2 has been shown to constitute a rate-limiting determinant in RNAi efficacy (5). Although the role of the Argonaute family has not been elucidated in the pancreatic β-cell, miR-375, the most abundant microRNA in the pancreatic islet, has been shown to regulate both the growth and function of the β-cell (6, 7).
Within the endocrine pancreas, several cell types (α, β, δ, and pancreatic polypeptide) release hormones into the circulation to regulate a broad spectrum of physiologic pathways (8). The pancreatic β-cell is the only source of insulin in the body and continuously responds to both glucose and electrical stimuli by releasing proteins into the blood (9). Processing of the proinsulin molecule occurs during assembly of the secretory granule when insulin is crystallized leading to the formation of mature dense-core granules (8). Several reports suggest the number of proteins in the insulin secretory granules to range between 50 and 150 as identified using mass spectrometry (10–12). The dense granules are transported and stored to comprise a readily releasable pool and, upon stimulation, fuse to the plasma membrane and constitute first-phase insulin release (13).
In this study, we address the regulatory role of Ago2 in the secretion pathway of the pancreatic β-cell. Proteins exocytosed from the murine insulinoma cell line MIN6 in response to glucose into the extracellular environment were quantified using a stable isotope labeling with amino acids in cell culture (SILAC)1-based approach (14, 15). Comparison of the proteins detected in the supernatant after induction by high glucose with those inhibited after loss of glucokinase expression includes a set of secreted β-cell proteins or secretion “signature” This subset includes the most established proteins in the insulin secretory granule as follows: insulin1 and -2; carboxypeptidase E, and the family of chromogranin and secretogranin proteins (8, 16). Moreover, siRNA-mediated knockdown of Ago2 resulted in increased secretion of this set of proteins in response to glucose, suggesting a prominent role for this gene and the microRNA pathway in regulating the β-cell secretome. In addition, immunoprecipitation of Ago2 showed enriched isolation of miR-375 indicating this specific member of the Argonaute family is essential for recruiting this microRNA to its target genes.
Taken together, this study establishes through the use of a pancreatic β-cell model the signature set of proteins released in response to glucose. In addition to the major constituents present in the insulin granule, the diversity in the identified proteins suggests the β-cell is a source of signaling factors that potentially influence a wide range of physiologic processes. Furthermore, we identify Ago2 as a primary mediator of miR-375 function indicating together these two genes play a major role in directing the secretory machinery in β-cells and in facilitating glucose homeostasis and metabolism.
EXPERIMENTAL PROCEDURES
Cell Culture, Subcellular Fractionation, Ribonucleoprotein Immunoprecipitation, and Antibodies
MIN6 cells were cultured in DMEM (Invitrogen) containing 4.5 g/liter glucose supplemented with 15% v/v heat-inactivated FCS, 50 μm β-mercaptoethanol, 50 mg/ml penicillin, and 100 mg/ml streptomycin. Insulin release was performed as described previously (7). Ribonucleoprotein immunoprecipitation experiments using Ago1 and Ago2 antibodies were performed as described previously (1, 17). For subcellular fractionation, cells were scraped into PBS, pelleted (300 × g, 5 min at 4 °C), and resuspended (0.3 m sucrose, 4 mm HEPES, pH 7.4, 0.5 mm EGTA). The homogenate was spun (3,000 × g, 10 min at 4 °C), and the postnuclear supernatant was loaded onto an eight-step sucrose gradient (HEPES buffered 0.2 to 2.0 m sucrose) and spun (55,000 × g, 2 h at 4 °C) using an MLS50 rotor (Beckman Coulter) as described previously (18). Antibodies for immunoprecipitation and Western blotting were used as follows: Gephyrin (BD Biosciences 610584); Ywhaz (Abcam ab61129); Rasd1 (Millipore AB15794); Grp78 (Assay Designs StressGen SPA-826); N-ethylmaleimide-sensitive factor (BD Biosciences 612272); Rab3A (Abcam ab3335); Ago2 (for immunoprecipitation) (Wako 018-22021); Ago2 (for Western blotting) (C34C6); Ago1 (MBL RN028PW); Dicer (Bethyl A301-936A); HuD/Elavl4 (Santa Cruz Biotechnology sc-48421); γ-tubulin (Sigma-Aldrich T6557), and β-actin (Sigma-Aldrich A2066).
Animals
Mice were maintained in a 12-h light/dark cycle with ad libitum access to regular chow in accordance to Landesamt für Gesundheit und Soziales (Lageso). All experimental procedures were approved under protocols G 0357/10, O 0405/09, and T 0436/08.
Small RNA Deep Sequencing
Small RNA sequencing libraries were prepared using Illumina small RNA library preparation kits. Small RNA fractions with a size range of 10–40 nucleotides were separated using FlashPAGE Fractionator (Ambion) according to the manufacturer's instructions. The small RNA fractions were ligated sequentially at the 3′ and 5′ ends with synthetic RNA adapters, reverse-transcribed, and amplified using Illumina sequencing primers. Amplified libraries were purified by PAGE according to the expected product size. Libraries were sequenced for 50 cycles (Illumina Hi-seq 2000), and the 3′ adapter sequences were removed using a custom Perl script. Reads of a length between 17 and 30 nucleotides were retained and mapped to known mouse pre-microRNA sequences deposited in the miRBase (19) without allowing any mismatch using soap1 and soap.short (20), respectively.
Gene Expression Analysis
All siRNAs and cholesterol-conjugated microRNA inhibitors (Riboxx GmbH (Radebeul, Germany)) were transfected into MIN6 cells with the Amaxa electroporation kit V (Lonza) and Lipofectamine 2000 (Invitrogen), respectively. Gene expression studies were analyzed 48 h after transfection, and total RNA was isolated with TRIzol, and cDNA was reverse-transcribed using a RevertAid First Strand cDNA synthesis kit (Fermentas). Quantitative real time PCR (qPCR) for small RNAs was performed using ABI microRNA assays and was normalized to U6 snRNA expression (Applied Biosystems) as described previously (21). Relative quantification by RT-PCR of Argonaute genes was determined from cDNA derived from MIN6 cells using gene-specific primers. Normalization was calculated with standard curves established with Ago1–4 cDNA constructs. Gene-specific primers were used with FastStart SYBR Green PCR Master Mix (Roche Applied Science) and are available upon request.
SILAC Labeling and Transfections
For SILAC labeling, MIN6 cells were grown in high glucose DMEM (PAA Laboratories GmbH, Pasching, Austria) supplemented with 15% dialyzed FCS (Sigma-Aldrich), 4 mm glutamine (PAA Laboratories GmbH, Pasching, Austria), 100 units/ml penicillin, 50 μm β-mercaptoethanol, 100 μg/ml streptomycin (Invitrogen), 48 μg/ml Lys-C6H14N2O2 (Lys-0) and 28 μg/ml Arg-C6H14N4O2 (Arg-0) (Sigma-Aldrich), or 48 μg/ml Lys-13C6 H1415N2O2 (Lys-8) and 28 μg/ml Arg-13C6H1415N4O2 (Arg-10) (Sigma Isotec). Eight passages in “heavy DMEM ” were conducted to achieve a high degree of incorporation of the heavy isotopes into proteins (95.12 ± 4.3% labeling efficiency). For secretion experiments, SILAC-labeled MIN6 cells were washed six times before incubating for 1 h in modified Krebs-Ringer buffer containing either low (2.8 mm) or high (25 mm) glucose, as described previously (7). Supernatants of light and heavy MIN6 cell cultures were combined and concentrated with Amicon Ultra-15 centrifugal filter units with a 3-kDa cutoff (EMD Millipore Corp.). Proteins were precipitated and dissolved in 6 m urea, 2 m thiourea. Proteins were reduced and alkylated. Lysyl endopeptidase (LysC) (Wako, Osaka, Japan) and trypsin (Promega, Madison, WI) were used for in-solution digestion. Stop and go extraction (STAGE) tips containing C18 empore disks (3M, Minneapolis, MN) were used to purify and store peptide extracts (22).
LC-MS/MS
LC-MS/MS analysis was performed as described previously (23). Briefly, peptide mixtures were separated by reversed phase chromatography using the EASY-nLC system (Thermo Fisher, Waltham, MA) on in-house manufactured 20-cm fritless silica microcolumns with an inner diameter of 75 μm. Columns were packed with ReproSil-Pur C18-AQ 3-μm resin (Dr. Maisch GmbH, Ammerbuch, Germany). Peptides were separated on a 8–60% acetonitrile gradient (182 min) with 0.5% formic acid at a flow rate of 200 nl/min. Eluting peptides were directly ionized by electrospray ionization and transferred into an LTQ-Orbitrap-Velos or Q-Exactive mass spectrometer (Thermo Fisher, Waltham, MA). Q-Exactive measurements were performed using a “sensitive” acquisition method as described previously (24). In short, one full scan (m/z = 300–1,700; R = 70,000; target value = 3 × 10⁶; maximum injection time = 120 ms) was followed by 10 MS/MS scans (charge >1; R = 35,000; target value = 5 × 10⁵; isolation window = 4 m/z; maximum injection time = 120 ms). Dynamic exclusion for selected precursor ions was 30 s.
Processing of MS Data
MaxQuant software package (version 1.2.2.5) with default settings was used to identify and quantify proteins (25). In brief, SILAC duplets were quantified using the following settings: heavy label Lys-8, Arg-10; maximum of three labeled amino acids per peptide; top 10 MS/MS peaks per 100 Da. Carbamidomethylation of cysteine was selected as fixed modification; oxidation of methionine and acetylation of the protein N terminus were used as variable modifications. Trypsin was selected as protease (full specificity) with a maximum of two missed cleavages. Mass tolerance of precursor ions was set to 6 ppm and for fragment ions to 20 ppm. MS/MS spectra were searched using the Andromeda search engine against an IPI mouse database (release 3.84), which totaled 60,012 proteins in addition to 248 common contaminants (26). All protein sequences were also reversed to generate a target-decoy database. A minimum of six amino acids per identified peptide and at least one peptide per protein group was required. False discovery rate was set to 1% at both the peptide and protein levels. Protein ratios were calculated from the median of all normalized peptide ratios using only unique peptides or peptides assigned to the protein group with the highest number of peptides (razor peptides). Only protein groups with at least three SILAC counts were considered for further analysis. The data associated with this study may be downloaded from the ProteomeCommons.org Tranche network using the following hash: http://cptac.tranche.proteomecommons.org/.
Bgen4cngG5NvlPcKObF59By9BhSkmp7fwYLA1r1KKhvejSDn5Baoe+Do+XMgLUNxACDXNJdy.
Bgen4cngG5NvlPcKObF59By9BhSkmp7fwYLA1r1KKhvejSDn5Baoe+Do+RGnG5M5wHfu9wZr.
Bgen4cngG5NvlPcKObF59By9BhSkmp7fwYLA1r1KKhvejSDn5Baoe+Do+Yh9YAAAAAAAAKlQ.
Bgen4cngG5NvlPcKObF59By9BhSkmp7fwYLA1r1KKhvejSDn5Baoe+Do+==rudnicketal.html.
Statistical Analysis
All results are expressed as means ± S.E. Comparisons between data sets with two groups were evaluated using an unpaired Student's t test. Analysis of variance was performed for comparisons of three or more groups. A p value of less than or equal to 0.05 was considered statistically significant. Cluster analysis of gene ontology (GO) terms was performed using the DAVID Bioinformatics Database (DAVID Bioinformatics Resources, National Institutes of Health, NCI-Frederick, MD).
RESULTS
Argonaute2 Regulates Insulin Release from the Pancreatic β-Cell
To date, the functional role of the Argonaute proteins in the pancreatic β-cell has not been described. qPCR for the four identified members of the Argonaute family showed Ago2 to be the most abundant as described in other tissues (Fig. 1A) (1). Moreover, siRNA-mediated knockdown of Ago2 in MIN6 cells resulted in a mild but significant 1.2–1.4-fold increase of Ago1, Ago3, and Ago4 mRNA levels (Fig. 1B). In contrast, knockdown of Ago1 had no effect on the expression of other family members (Fig. 1C). Similar to previous loss of function studies of miR-375 in MIN6 cells, siRNA-mediated knockdown of Ago2 in MIN6 cells resulted in increased glucose-stimulated insulin release (Fig. 1D and supplemental Fig. 1A) (7). The effects on insulin secretion after inhibition of either Ago2 or miR-375 are very comparable and may be either a reflection of the predominant expression of these genes in this cell type or indicative of a functional association between these two molecules. Small RNA sequencing profiles of both MIN6 cells and pancreatic islets isolated from 10-week-old wild-type C57BL/6 mice showed that miR-375 is the microRNA with the highest read counts in both tissues (Fig. 1E and supplemental Table 1). Interestingly, loss of Ago1 and Ago2 expression incurred a decrease in miR-375 levels supporting previous results that the stability of microRNAs is dependent on Argonaute proteins (Fig. 1F) (1).
Fig. 1.

Argonaute2 associates with miR-375 to regulate pancreatic β-cell secretion. A, relative quantification of Ago genes by qRT-PCR. B and C, qRT-PCR analysis of Ago genes after siRNA-mediated knockdown of Ago2 and Ago1 in MIN6 cells (n = 3). D, measurement of glucose-stimulated insulin release in MIN6 cells after both siRNA-mediated knockdown of Ago2 and inhibition of miR-375 compared with scrambled controls (n = 3). E, comparison of small RNA deep sequencing analysis of total RNA isolated from the MIN6 cell line and isolated pancreatic islets of 10-week-old C57BL/6 mice. F, qRT-PCR analysis of miR-375 after siRNA-mediated knockdown of Ago1 and Ago2 in MIN6 cells (n = 3). G, detection of Argonaute proteins after immunoprecipitation (IP) with α-Ago1 and α-Ago2 antibodies and quantification of miR-375 by qRT-PCR after isolation of total RNA from Ago1- and Ago2-associated complexes. Ctrl, control. Results are presented as mean ± S.E. *, p < 0.05; **, p < 0.01; and ***, p < 0.001. AU is arbitrary units.
To determine the relative association of miR-375 with Ago1 and Ago2, qRT-PCR was performed after immunoprecipitation of the Ago1 and Ago2 proteins as described previously (1). Although Ago1 and Ago2 were detectable following pulldown compared with IgG control, an increased amount of Ago1 was observed following knockdown of Ago2 (Fig. 1G). Moreover, immunoprecipitation of Ago2 revealed an enriched level of miR-375 compared with the pulldowns of Ago1. These results show an increased abundance of miR-375 to be associated with Ago2 and not Ago1 and support the similarity in the effects on insulin secretion after inhibition of either miR-375 or Ago2.
Quantitative Analysis of the Pancreatic β-Cell Secretome
To evaluate the regulatory role of Ago2 in the secretory pathway, we used the MIN6 cell line as a glucose-responsive model system for the study of β-cell function (27). To accurately quantify proteins released in response to glucose, we employed a SILAC-based strategy (Fig. 2A). Light SILAC-labeled MIN6 cells were incubated with low glucose (2.8 mm, low Glc), whereas heavy cells were treated with high glucose (25 mm, high Glc). Supernatants from differentially labeled samples were combined, concentrated, digested, and analyzed by high resolution shotgun proteomics. As an additional control, experiments were also performed with swapped SILAC labels (a reversed experiment). As expected, log2 fold changes of proteins quantified in both experiments show a strong anti-correlation (Fig. 2B). On average, 500 proteins were quantified in the supernatants of both experiments. However, only a small subset of these proteins was detected to robustly change in response to glucose, i.e. it had a high ratio in the forward and a low ratio in the reverse experiment (log2 fold change >0.5 and log2 fold change less than −0.5, respectively). To validate if these changes in the secretome are specifically induced by the response of cells to glucose, we used siRNAs to knock down the glucose sensor glucokinase (si-Gck) (Fig. 2C). Of the proteins that were found to be secreted in the high/low glucose experiments, 48 proteins were also identified to be regulated by glucokinase (log2 fold change less than −0.5) validating that the observed changes in the β-cell secretome are glucose-dependent (Table I and Fig. 2, C and D). An analysis of these 48 robustly quantified proteins in the β-cell secretome revealed specific enrichment for specific categories of Gene Ontology (GO) cellular compartments, including secretory granule (p = 3.77E-8), cytoplasmic membrane-bounded vesicle (p = 4.23E-5), and extracellular region (p = 1.18E-14), including both insulin paralogs in mouse (Ins1 and Ins2). These 48 proteins constituted the basis of the secretome signature in subsequent analyses. Proteins quantified in only two of the three secretome samples were included as an additional resource of potential components of the MIN6 secretome (Table II).
Fig. 2.

Establishment of glucose-induced secretome analysis in MIN6 cells. A, workflow for labeling of MIN6 cells with heavy isotope-containing amino acids. MIN6 cells were metabolically labeled with “light” C6H14N2O2 l-lysine and C6H14N4O2 l-arginine (L) or “heavy” 13C6H1415N2O2 l-lysine and 13C6H1415N4O2 l-arginine (H). Differentially treated cells are mixed, concentrated, and analyzed by LC-MS/MS. Pairs of identical peptides with different stable isotope compositions can be distinguished in the mass spectrometer based on their mass difference (8 Da for lysine-containing peptides and 10 Da for arginine-containing peptides). Consistently, the ratio of peak intensities of H versus L peptides reflects differences in protein abundance. B, supernatants of heavy labeled cells treated with 25 mm glucose and of light labeled cells treated with 2.8 mm glucose were combined and analyzed by LC-MS/MS. In addition, a label swap experiment was performed. In total, 498 proteins were quantified. Regulated signature proteins are colored in red (log2 fold change >0.5 and log2 fold change less than −0.5, n = 48). Among these proteins, insulin-1 and insulin-2 were identified. C, LC-MS/MS analysis of mixed supernatants of glucokinase (Gck) siRNA knockdown (heavy) and siRNA control cells (light) after 25 mm glucose treatment. In total, 796 proteins were quantified. Regulated proteins (log2 fold change less than −0.5, n = 95) are colored in red. D, Venn diagram showing the number of proteins overlapping from the high glucose/low glucose experiments and from the glucokinase knockdown experiment. Gene ontology (GO) analysis of cellular compartments was performed on the 48 proteins (= secretome signature) shared in all three experiments using DAVID. Benjamini Hochberg corrected p values are shown. All proteins from the Venn diagram are listed in Table I.
Table I. List of “secretion signature” factors in response to 25 mm glucose incubation of MIN6 cells.
| Protein names | Uniprot | Gene names | Ratio normalized high glucose/low glucose | Ratio normalized low glucose/high glucose | Ratio normalized after si-Gck/si-ctrl | No. of peptides |
|---|---|---|---|---|---|---|
| C-flanking peptide of NPY | P57774 | Npy | 4.52 | −2.10 | −1.26 | 5 |
| Insulin-1 | P01325 | Ins1 | 4.27 | −1.29 | −1.45 | 5 |
| IGF-II | E9QLW5 | Igf2 | 4.18 | −2.75 | −1.47 | 7 |
| Carboxypeptidase E | Q00493 | Cpe | 4.07 | −2.35 | −1.18 | 43 |
| Chromogranin-B | P16014 | Chgb | 3.99 | −2.18 | −1.32 | 54 |
| Preprodynorphin | O35852 | mCG_9904 | 3.98 | −2.51 | −1.20 | 14 |
| Chromogranin-C | Q03517 | Chgc | 3.98 | −2.28 | −1.31 | 53 |
| VGF nerve growth factor inducible | Q0VGU4 | mCG_18019 | 3.96 | −2.46 | −1.30 | 39 |
| Neuronal pentraxin receptor | Q3UH37 | Nptxr | 3.95 | −1.96 | −1.23 | 17 |
| Protein-tyrosine phosphatase, receptor type, N polypeptide 2 | A3KN68 | Ptprn2 | 3.90 | −2.55 | −1.13 | 31 |
| Furin homolog | P63239 | Att-1 | 3.84 | −2.20 | −1.20 | 38 |
| Secretogranin III | P47867 | Scg3 | 3.82 | −2.46 | −1.12 | 44 |
| KEX2-like endoprotease 2 | P21661 | Nec2 | 3.78 | −2.08 | −1.05 | 31 |
| C-terminal peptide | P12961 | Scg5 | 3.77 | −2.18 | −1.19 | 10 |
| Neuronal pentraxin I | Q62443 | Nptx1 | 3.73 | −1.99 | −0.76 | 18 |
| Receptor-type tyrosine-protein phosphatase-like N | E9Q746 | Ptprn | 3.70 | −2.44 | −1.22 | 16 |
| Ribonuclease 4 | Q5UCA9 | Rnase4 | 3.63 | −1.85 | −1.48 | 7 |
| DnaJ (Hsp40) homolog, subfamily B, member 9 | Q5D0C3 | Dnajb9 | 3.63 | −1.88 | −1.33 | 10 |
| Protein OS-9 | Q8K2C7–1 | Os9 | 3.51 | −1.77 | −1.44 | 17 |
| Big LEN | Q9QXV0 | Pcsk1n | 3.51 | −3.01 | −1.07 | 13 |
| Lysyl oxidase homolog 2 | P58022-1 | Loxl2 | 3.31 | −1.99 | −1.12 | 29 |
| Peptidyl-α-hydroxyglycine α-amidating lyase | E9QL07 | Pam | 3.31 | −2.37 | −1.31 | 35 |
| Neuronal pentraxin II | O70340 | Nptx2 | 3.26 | −1.73 | −0.84 | 19 |
| Spock1 protein | B2RXY1 | Spock1 | 3.22 | −2.25 | −1.43 | 11 |
| Angiogenin | P21570 | Ang | 3.11 | −1.80 | −1.19 | 7 |
| Cystatin-3 | P21460 | Cst3 | 3.09 | −1.16 | −1.19 | 8 |
| Insulin-2 | P01326 | Ins2 | 2.97 | −1.12 | −1.27 | 7 |
| Bone morphogenetic protein 1 | Q6NZM2 | Bmp1 | 2.94 | −2.64 | −1.40 | 13 |
| SPARC/osteonectin, CWCV, and Kazal-like domains proteoglycan 2 | Q9ER58 | Spock2 | 2.85 | −0.52 | −0.85 | 11 |
| Brain-specific receptor-like protein A | Q4V9Z5–2 | Sez6l2 | 2.79 | −0.70 | −1.29 | 25 |
| Glicentin | P55095 | Gcg | 2.69 | −1.60 | −1.12 | 14 |
| Vitamin D-binding protein | P21614 | Gc | 2.59 | −1.33 | −1.46 | 18 |
| E-selectin ligand 1 | Q61543 | Esl1 | 2.54 | −0.75 | −1.06 | 41 |
| Golgi membrane protein 1 | Q91XA2 | Golm1 | 2.38 | −1.45 | −1.83 | 7 |
| Putative uncharacterized protein Golim4 | D3YVW2 | Golim4 | 2.35 | −0.97 | −1.79 | 12 |
| Pappa2 protein | E9PZ87 | Pappa2 | 2.30 | −1.66 | −1.27 | 50 |
| Prosaposin | Q3UE29 | Psap | 2.30 | −1.68 | −0.61 | 18 |
| 45-kDa calcium-binding protein | Q61112–1 | Cab45 | 2.16 | −0.78 | −1.16 | 22 |
| Ribosomal protein L1 | Q3U561 | Rpl10a | 1.83 | −1.48 | −0.61 | 13 |
| Fetuin-B | Q9QXC1 | Fetub | 1.77 | −2.13 | −0.84 | 14 |
| Chondroitin sulfatase | Q571E4 | Galns | 1.47 | −0.68 | −0.96 | 24 |
| Acid ceramidase | Q9WV54 | Asah | 1.15 | −0.52 | −0.82 | 17 |
| ABPP | P12023–1 | App | 1.01 | −0.77 | −0.85 | 22 |
| Fam3c protein | Q6NSU0 | D6Wsu176e | 0.91 | −1.13 | −0.93 | 9 |
| α-N-Acetylglucosaminidase (Sanfilippo disease IIIB) | A2BFA6 | Naglu | 0.88 | −1.02 | −1.11 | 21 |
| Amylin | P12968 | Iapp | 0.81 | −2.25 | −1.92 | 4 |
| γ-Glutamyl hydrolase | B1AWC1 | Ggh | 0.71 | −0.86 | −0.81 | 11 |
| β-Hexosaminidase subunit β | P20060 | Hexb | 0.53 | −0.55 | −0.74 | 22 |
Table II.
List of factors that were detected in two experiments in response to 25 mm glucose incubation of MIN6 cells
| Protein names | Uniprot | Gene names | Ratio normalized high glucose/low glucose | Ratio normalized low glucose/high glucose | Ratio normalized after si-Gck/si-ctrl | No. of peptides |
|---|---|---|---|---|---|---|
| C-reactive protein | E9PZ20 | Crp | 3.31 | −0.72 | 9 | |
| Transthyretin | P07309 | Ttr | 2.42 | −0.98 | 13 | |
| Ptprz1 protein | B2RXS8 | Ptprz1 | 2.26 | −1.49 | 16 | |
| Cathepsin L1 | P06797 | Ctsl | 2.15 | −1.09 | 7 | |
| 4632419I22Rik protein | Q6NXM5 | 4632419I22Rik | 2.15 | −1.08 | 9 | |
| Protein C7-1 | Q9R1Q9 | Atp6ap1 | 2.09 | −0.99 | 6 | |
| HEPACAM family member 2 | Q4VAH7 | Hepacam2 | 2.01 | −1.15 | 7 | |
| CALNUC | Q02819 | Nuc | 1.61 | −0.93 | 37 | |
| Cathepsin Z | Q9WUU7 | Ctsz | 1.48 | −0.61 | 13 | |
| Palmitoyl-protein hydrolase 1 | O88531 | Ppt | 1.41 | −0.72 | 11 | |
| Cyp-C-associated protein | Q07797 | Cycap | 1.32 | -0.84 | 16 | |
| Neuronal cell adhesion molecule | Q810U4–3 | Kiaa0343 | 1.31 | −1.83 | 37 | |
| β-Hexosaminidase subunit α | P29416 | Hexa | 1.16 | −0.82 | 22 | |
| Cathepsin A | Q9D2D1 | Ctsa | 1.07 | −0.72 | 20 | |
| Hematopoietic lineage switch 2 | Q9WVJ3–1 | Hls2 | 0.78 | −0.58 | 14 | |
| Neural cell adhesion molecule 1 | P13595–1 | Ncam | 0.73 | −1.10 | 19 | |
| Mannosidase 2, αB1 | Q3TB95 | Man2b1 | 0.66 | −0.56 | 31 | |
| Hypoxia up-regulated protein 1 | Q9JKR6 | Grp170 | 0.55 | −0.95 | 44 | |
| Ectonucleotide pyrophosphatase/ phosphodiesterase family member 5 | Q9EQG7 | Enpp5 | −1.19 | −0.64 | 15 | |
| Insulin-like growth factor 2 receptor | Q07113 | Igf2r | −0.78 | −1.14 | 21 |
Ago2 Is a Regulator of the Pancreatic β-Cell Secretome
To address the regulatory role of Ago2, we analyzed glucose-induced secretion after siRNA-mediated knockdown of Ago2 in MIN6 cells using the same proteomic approach. We observed that inhibition of Ago2 (si-Ago2) resulted in a significant enhancement of secretion of dozens of proteins compared with a scrambled control (si-Ctrl) (Fig. 3A). Importantly, knockdown of Ago2 induced hypersecretion of the same proteins that were also secreted in response to high glucose (Fig. 3B). Hence, Ago2 may function as a master regulator of the glucose-induced β-cell secretome. Next, to test if Ago2 regulates secretion via miR-375, we analyzed the glucose-induced secretome after inhibition of this microRNA by transfecting cholesterol-conjugated 2′-O-methylated antisense oligonucleotides (Cnt-375) compared with control oligonucleotides (Cnt-Ctrl) (Fig. 3C and supplemental Fig. 1, A and B). Although the variability was greater than in the Ago2 knockdown experiment, we also found that miR-375 inhibition reproducibly induced hypersecretion of dozens of proteins. Importantly, we observed a strong correlation of changes in the secretome after both Ago2 and miR-375 inhibition, highlighting the functional overlap between these molecules with respect to regulating secretion in these cells (Fig. 3D).
Fig. 3.

Argonaute2 regulates the pancreatic β-cell secretome. A, comparison of quantitative analysis of proteins present in supernatant of MIN6 cells after incubation in 25 mm glucose. One experiment quantified proteins after siRNA-mediated knockdown of Ago2 in MIN6 (labeled in heavy SILAC media) compared with control (labeled in light SILAC media). A converse experiment was performed with knockdown of Ago2 using light labeled cells (label swap experiment). B, comparison of quantitative analysis of proteins present in supernatant after siRNA-mediated knockdown of Ago2 in MIN6 cells after incubation in 25 mm glucose with an experiment measuring proteins present in the supernatant of MIN6 cells after incubation in 25 mm glucose (Hi Glc) versus 2.8 mm glucose (Lo Glc). C, secretome experiment exhibiting comparison of quantitative analysis of proteins present in supernatant of MIN6 cells after inhibition of miR-375 and incubation in 25 mm glucose (labeled in heavy SILAC media) and the corresponding label swap experiment. D, comparison of quantitative analysis of proteins present in supernatant of MIN6 cells after inhibition of miR-375 and incubation in 25 mm glucose versus experiment after siRNA-mediated knockdown of Ago2. Proteins colored in red are defined as the secretome signature.
Argonaute2 Mediates the Effect of miR-375 on Target Gene Expression
To validate whether Ago2 indeed mediates the effect of miR-375 in pancreatic β-cells, we next measured expression of validated miR-375 targets after inhibition of Ago2 by qRT-PCR. Several validated targets of miR-375, including Elavl4/HuD, Gphn, and Rasd1, were all measured to be up-regulated after Ago2 knockdown indicating that steady state mRNA levels of these genes are dependent on this specific member of the Argonaute family (Fig. 4A) (6). Both Pictar and TargetScan algorithms identified a conserved seed sequence of miR-375 in the 3′UTR of Ywhaz, and real time PCR showed an increase in expression after inhibition of the microRNA (Fig. 4B) (28, 29). Regulation of Elavl4/HuD, Gephyrin, Ywhaz, and Rasd1 was also confirmed by Western blotting after both knockdown (si-Ago2) and overexpression (Ago2OE) of Ago2 (Fig. 4, C and D). Moreover, expression of Gephyrin and Ywhaz was unchanged after knockdown of Ago1, indicating this member of the Argonaute family plays a lesser role in mediating regulation of these targets by miR-375 (Fig. 4E). However, Rasd1 was observed increased after knockdown of both Ago1 and Ago2 by Western blotting indicating its regulation by miR-375 may be mediated by multiple Argonaute proteins (Fig. 4E). Finally, we observed that inhibition of Ago1 resulted in a decrease of Elavl4/HuD expression suggesting perhaps other Ago family members mediate its regulation in the absence of Ago1. These results show that the targeting of many genes by miR-375 is more dependent upon Ago2 than other Ago proteins and can explain the functional overlap in regulating insulin secretion.
Fig. 4.
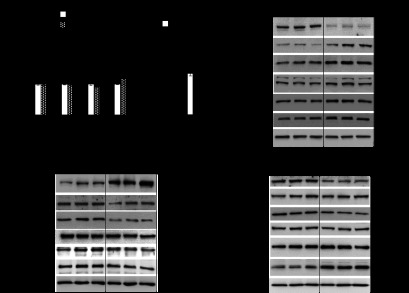
Loss of Argonaute2 increases expression of miR-375 targets. Argonaute2 and miR-375 cooperate in the regulation of β-cell secretion. A, qRT-PCR analysis of miR-375 target genes after siRNA-mediated knockdown of Ago1 and Ago2 in MIN6 cells (n = 4). B, qRT-PCR analysis of Ywhaz after inhibition of miR-375 in MIN6 cells (n = 4). C, Western blotting analysis of Ago2, Ago1, Elavl4/HuD, Gephyrin, Ywhaz, and Rasd1 after siRNA-mediated knockdown of Ago2 compared with scrambled control. D, Western blotting analysis of Ago2, Ago1, Elavl4/HuD, Gephyrin, Ywhaz, and Rasd1 after overexpression of Ago2 (Ago2OE) compared with transfection control. E, Western blotting analysis of Ago1, Ago2, Elavl4/HuD, Gephyrin, Ywhaz, and Rasd1 after siRNA-mediated knockdown of Ago1 compared with scrambled control. fold ch, fold change. Results are presented as mean ± S.E. *, p < 0.05; **, p < 0.01; and ***, p < 0.001. AU is arbitrary units.
Target Genes of miR-375 Contribute to Insulin Release from the Pancreatic β-Cell
To determine which of the identified targets of miR-375 contribute to its role in secretion, we utilized siRNA-mediated knockdown in MIN6 cells to test their effect on insulin release. Previous studies by our group have shown that seven genes are targets of miR-375, including Myotrophin, Gephyrin, HuD/Elavl4, Aifm1, Rasd1, Eef1e1, and Cadm1 (6, 7). Inhibition of Gephyrin, Ywhaz, Aifm1, and Mtpn all resulted in lower insulin levels in response to 25 mm glucose compared with transfected control cells (Fig. 5A and supplemental Fig. 2, A and B). These results would suggest that these four genes play an important role because loss of either Ago2 and miR-375 expression resulted in enhanced secretion.
Fig. 5.

Targets of miR-375 regulate insulin release. A, measurement of glucose-stimulated insulin release in MIN6 cells after siRNA-mediated knockdown of glucokinase, gephyrin, and ywhaz compared with scrambled controls (n = 4). B, quantification of immunoreactive insulin after subcellular fractionation of MIN6 cell extracts by sucrose gradient ultracentrifugation. Western blotting was performed to identify Gephyrin, Ywhaz, and specific membrane components Rab3, N-ethylmaleimide-sensitive factor, and Grp78. C, comparison of quantitative analysis of proteins with (2) an experiment measuring the proteins present in the supernatant after siRNA-mediated knockdown of gephyrin in MIN6 cells after incubation in 25 mm glucose with an experiment measuring proteins present in the supernatant of MIN6 cells after incubation in 25 mm glucose (high Glc) versus 2.8 mm glucose (low Glc). Proteins colored in red are defined as the secretome signature.
In addition, in light of the robust regulation of Gephyrin and Ywhaz after knockdown of Ago2, we then addressed whether these proteins may localize with proteins present in insulin secretory granules. We performed subcellular fractionation using a sucrose gradient with MIN6 cell extracts to understand which compartments within the β-cell these proteins occupy. Immunoblotting for Gephyrin and Ywhaz showed these proteins are all present in regions distinct from insulin secretory granule-containing fractions as identified by radioimmunoassay (Fig. 5B). Moreover, the fractions enriched for these granules overlapped with peaks in expression for Rab3A and N-ethylmaleimide-sensitive factor and was in contrasting comparison with the endoplasmic reticulum marker Grp78 (Fig. 5B). In light of these results, we therefore investigated if miR-375-mediated repression of gephyrin might control the β-cell secretome. To this end, we quantified the impact of gephyrin knockdown on the glucose-stimulated secretome (Fig. 5C). We observed that loss of Gephyrin reduced secretion of dozens of proteins (including the secretome signature) that are hypersecreted after inhibition of miR-375. Thus, Gephyrin and miR-375 have opposing effects on glucose-mediated secretion and reinforce the notion that gephyrin is a functional target of this microRNA. Finally, secretome profiles after high glucose treatment (Fig. 2B) or loss of miR-375 expression (supplemental Fig. 1B) did not show enrichment of miR-375 seed-containing genes among the proteins identified (supplemental Fig. 1, D and E, respectively). Therefore, instead of targeting individual secreted proteins, miR-375 appears to globally regulate secretion from the β-cell. Specifically, miR-375 may target genes that have a regulatory function for glucose-stimulated secretion.
DISCUSSION
The precise release of insulin from the pancreatic β-cell requires the coordinated effort of numerous pathways to maintain physiologic levels of glucose in the blood (30, 31). MicroRNAs have been shown to contribute a significant regulatory role to the growth and function of the pancreatic β-cell, the sole source of insulin and many other factors to the systemic circulation (32). Central to microRNA function is the Argonaute family of proteins; however, the extent to which individual members contribute to the activity of specific microRNA is largely uncharacterized (2). miR-375, the highest expressed microRNA in both MIN6 cells and pancreatic islets, has been previously shown to regulate exocytosis from β-cells as well as growth of the endocrine pancreas (6, 7). In this study, we show that loss of Ago2 expression in the β-cell also results in increased release of insulin underlining an important functional role for the microRNA pathway in this cell type.
As miR-375 constitutes the largest percentage of the total pool of microRNAs in pancreatic islet cells, this observation may explain several similarities between loss of Ago2 and miR-375 models. As observed in other tissues, Ago2 was measured to be the most abundant of all Ago family members in MIN6 cells, and immunodepletion of Ago2 precipitated higher levels of miR-375 (1, 33). Together these molecules may constitute a large proportion of microRNA-induced silencing complexes, and therefore the effects on insulin release are similar in magnitude.
Additionally, inhibition of miR-7, a microRNA shown to influence endocrine differentiation, results in enhanced secretion of the signature proteins indicating several microRNAs may contribute to this process in the β-cell (supplemental Fig. 3, A–C) (34). However, loss of Dicer expression resulted in decreased insulin release, but this effect disappeared after normalization with decreased cellular insulin content consistent with previous studies showing Dicer maintained insulin mRNA expression (supplemental Fig. 4, A–C and supplemental Table 2) (35). Furthermore, although Dicer knockdown decreased the overall microRNA expression profile, it is hypothesized to perform several functions in addition to its role in microRNA processing such as the maintenance of heterochromatin structure (36). Therefore, it is unclear whether these results are due directly to the loss of Dicer itself or to the overall microRNA expression. Together, these observations show that several microRNAs may regulate the secretory pathway. However, loss of Dicer and overall microRNA expression negatively impacts secretion by decreasing insulin mRNA expression due to essential functions of these genes inherent to this cell type.
Our results showing miR-375 target genes to be up-regulated after inhibition of Ago2 further underlines the functional association between these two genes. The absence of any effect after loss of Ago1 on insulin release may reflect an important functional difference in the role of miR-375 and Ago2 in the pancreatic β-cell. Although miR-375 does associate with Ago1, these results may simply reflect the relative abundance of Ago1 and the amount of miR-375 present in Ago1-associated complexes. In addition, the identification of gephyrin and ywhaz as both regulators of insulin release and likely direct targets of miR-375 brings to light a functional association between these specific genes. Although both occupy compartments independent of insulin secretory granules, previous studies on Gephyrin have described its association with glycine receptors within the secretion pathway of post-synaptic compartments, and it is hypothesized to contribute to the dynamics of protein localization within synaptic assemblies (37). Moreover, Gephyrin was shown to facilitate the transport of glycine receptors along the microtubules en route to the plasma membrane (38). Meanwhile, Ywhaz (14-3-3ζ) was shown to interact with Limk1 and cofilin to regulate actin dynamics, a process contributing to exocytosis (39). Of note, recent studies on Elavl4/HuD describe its role in regulating translation of the insulin mRNA, and transgenic overexpression in mice resulted in impaired insulin release (40). Furthermore, inhibition of Rasd1 was shown to result in increased insulin release in MIN6 cells (41). Taken together, these results indicate targets of miR-375 can either positively or negatively influence secretion, and therefore only after the identification of all targets can we reach an understanding of the complexity of its role in the β-cell.
Our observations showing overall enhanced secretion in response to glucose after inhibiting either Ago2 or miR-375 may suggest the microRNA pathway functions to prevent the excessive release of proteins into the blood. We showed an enhancement of insulin release after loss of Ago2 expression, and alterations in the expression of actin and microtubule-associated proteins Gephyrin and Ywhaz may suggest a role for the microRNA pathway in maintaining the precise timing of recruitment, docking, or fusion of the insulin secretory granules. As insulin release is modulated according to changes in stimuli, microRNAs may function as a strict regulatory mechanism over excessive insulin release to ensure normal glucose homeostasis.
Importantly, many of the proteins identified within the proteomic analysis are known components of the insulin granule and constitute the basis for the secretome signature. As expected, Insulin1 and -2, the products of the two insulin genes present in both mouse and rat, were detected in the supernatants in response to glucose (42). In addition, it was also expected that the majority of proteins in the chromogranin and secretogranin family would be identified (12, 43). Interestingly, VGF was also detected and was recently described to promote pancreatic β-cell survival and function during the onset of diabetes (44). Therefore, the identification of the pancreatic β-cell secretome presents a great deal of potential in uncovering novel signaling mechanisms initiated by the endocrine pancreas. Whereas many of the proteins have been studied in other cell types, such as vitamin D-binding protein, Angiogenin, and Bmp1, numerous additional factors, including members of the pentraxin family of proteins (Nptx1, Nptx2, Ntpxr, and Crp), Sez6l2, and Spock1 and -2 require further characterization in β-cells (12, 45). Nptx1 was identified as a secreted factor from neural cells and may promote the uptake of synaptic macromolecules; however, whether it performs a similar role in the endocrine pancreas remains to be determined (46). Moreover, glucose toxicity was shown to increase expression of Nptx1 in rat pancreatic INS1E cells, and it may mediate apoptosis in an Akt-dependent manner (47).
It should be noted that our set of secretome signature proteins is based on stringent selection criteria. Because of this stringent filtering and the limited dynamic range of our proteomic approach, the true number of proteins secreted in a glucose-dependent manner is expected to be higher. For example, many differentially secreted proteins in the Ago2 and miR-375 inhibition experiments were also differentially secreted in response to glucose. However, because these proteins did not fulfill our stringent selection criteria (quantification in both glucose stimulation and the si-Gck experiment, cut-offs: >0.5 log2 fold change or less than −0.5 log2 fold change), we did not include them in the signature set and therefore appear in “black.” Nevertheless, these proteins may have biologic significance relevant to inhibition of the components of the microRNA pathway. In the future, novel methods like selective enrichment of newly synthesized proteins will help to further characterize the β-cell secretome (48).
In light of the diversity of the proteins identified in the secretome, it is possible that many of the factors are only relevant in a phase of development rather than during an entire life span to regulate a specific physiologic process. In addition, some proteins may only function on a local level within the islet as opposed to entering the systemic circulation. Finally, it also remains to be determined whether these proteins constitute autocrine or paracrine factors to neighboring endocrine, neural, or endothelial cells and contribute to islet physiology or glucose homeostasis (49). In summary, these observations provide insight into the function of Argonaute proteins and the microRNA pathway in the β-cell and may indicate that it is by design necessary to safeguard the primary functional role of this cell type, hormone release.
Supplementary Material
Acknowledgments
We thank F. Spagnoli, P. Selenko, K. Schmidt-Ott, A. Maul, B. Schroeder, T. Willnow, M. Gotthardt, M. Andrade, and M. Bader for helpful discussions and assistance in the conduct of this work. We also thank G. Meister for providing Argonaute overexpression constructs and Paolo Meda for generously providing low passage MIN6 cells. Author Contributions: S.G.T., M.D.S., H.W., T.R., A.P., C.B., and X.Y. all researched data. W.C. and M.S. designed experiments and reviewed and edited the manuscript. M.N.P. designed the experiments, researched data, wrote the manuscript, and is the guarantor of this work and, as such, had full access to all the data in the study and takes responsibility for the integrity of the data and the accuracy of the analysis.
Footnotes
 This article contains supplemental material.
1 The abbreviations used are:
- SILAC
- stable isotope labeling with amino acids in cell culture
- qPCR
- quantitative real time PCR.
REFERENCES
- 1. Wang D., Zhang Z., O'Loughlin E., Lee T., Houel S., O'Carroll D., Tarakhovsky A., Ahn N. G., Yi R. (2012) Quantitative functions of Argonaute proteins in mammalian development. Genes Dev. 26, 693–704 [DOI] [PMC free article] [PubMed] [Google Scholar]
- 2. Höck J., Meister G. (2008) The Argonaute protein family. Genome Biol. 9, 210. [DOI] [PMC free article] [PubMed] [Google Scholar]
- 3. Leung A. K., Sharp P. A. (2010) MicroRNA functions in stress responses. Mol. Cell 40, 205–215 [DOI] [PMC free article] [PubMed] [Google Scholar]
- 4. Liu J., Carmell M. A., Rivas F. V., Marsden C. G., Thomson J. M., Song J.-J., Hammond S. M., Joshua-Tor L., Hannon G. J. (2004) Argonaute2 is the catalytic engine of mammalian RNAi. Science 305, 1437–1441 [DOI] [PubMed] [Google Scholar]
- 5. Grimm D., Wang L., Lee J. S., Schürmann N., Gu S., Börner K., Storm T. A., Kay M. A. (2010) Argonaute proteins are key determinants of RNAi efficacy, toxicity, and persistence in the adult mouse liver. J. Clin. Invest. 120, 3106–3119 [DOI] [PMC free article] [PubMed] [Google Scholar]
- 6. Poy M. N., Hausser J., Trajkovski M., Braun M., Collins S., Rorsman P., Zavolan M., Stoffel M. (2009) miR-375 maintains normal pancreatic alpha- and beta-cell mass. Proc. Natl. Acad. Sci. U.S.A. 106, 5813–5818 [DOI] [PMC free article] [PubMed] [Google Scholar]
- 7. Poy M. N., Eliasson L., Krutzfeldt J., Kuwajima S., Ma X., Macdonald P. E., Pfeffer S., Tuschl T., Rajewsky N., Rorsman P., Stoffel M. (2004) A pancreatic islet-specific microRNA regulates insulin secretion. Nature 432, 226–230 [DOI] [PubMed] [Google Scholar]
- 8. Suckale J., Solimena M. (2010) The insulin secretory granule as a signaling hub. Trends Endocrinol. Metab. 21, 599–609 [DOI] [PubMed] [Google Scholar]
- 9. Howell S. L. (1984) The mechanism of insulin secretion. Diabetologia 26, 319–327 [DOI] [PubMed] [Google Scholar]
- 10. Hickey A. J., Bradley J. W., Skea G. L., Middleditch M. J., Buchanan C. M., Phillips A. R., Cooper G. J. (2009) Proteins associated with immunopurified granules from a model pancreatic islet beta-cell system: proteomic snapshot of an endocrine secretory granule. J. Proteome Res. 8, 178–186 [DOI] [PubMed] [Google Scholar]
- 11. Brunner Y., Couté Y., Iezzi M., Foti M., Fukuda M., Hochstrasser D. F, Wollheim C. B., Sanchez J. C. (2007) Proteomics analysis of insulin secretory granules. Mol. Cell. Proteomics 6, 1007–1017 [DOI] [PubMed] [Google Scholar]
- 12. Schvartz D., Brunner Y., Couté Y., Foti M., Wollheim C. B., Sanchez J.-C. (2012) Improved characterization of the insulin secretory granule proteomes. J. Proteomics, 75(15), 4620–431 [DOI] [PubMed] [Google Scholar]
- 13. Hou J. C., Min L., Pessin J. E. (2009) Insulin Granule Biogenesis, Trafficking, and Exocytosis. Insulin and IGFs, pp. 473–506, Academic Press, Elsevier, New York: [DOI] [PMC free article] [PubMed] [Google Scholar]
- 14. Ong S.-E., Blagoev B., Kratchmarova I., Kristensen D. B., Steen H., Pandey A., Mann M. (2002) Stable isotope labeling by amino acids in cell culture, SILAC, as a simple and accurate approach to expression proteomics. Mol. Cell. Proteomics 1, 376–386 [DOI] [PubMed] [Google Scholar]
- 15. Grønborg M., Kristiansen T. Z., Iwahori A., Chang R., Reddy R., Sato N., Molina H., Jensen O. N., Hruban R. H., Goggins M. G., Maitra A., Pandey A. (2006) Biomarker discovery from pancreatic cancer secretome using a differential proteomic approach. Mol. Cell. Proteomics 5, 157–171 [DOI] [PubMed] [Google Scholar]
- 16. Bartolomucci A., Possenti R., Mahata S. K., Fischer-Colbrie R., Loh Y. P., Salton S. R. (2011) The extended granin family: structure, function, and biomedical implications. Endocr. Rev. 32, 755–797 [DOI] [PMC free article] [PubMed] [Google Scholar]
- 17. Keene J. D., Komisarow J. M., Friedersdorf M. B. (2006) RIP-Chip: the isolation and identification of mRNAs, microRNAs, and protein components of ribonucleoprotein complexes from cell extracts. Nat. Protoc. 1, 302–307 [DOI] [PubMed] [Google Scholar]
- 18. Noushmehr H., D'Amico E., Farilla L., Hui H., Wawrowsky K. A., Mlynarski W., Doria A., Abumrad N. A., Perfetti R. (2005) Fatty acid translocase (FAT/CD36) is localized on insulin-containing granules in human pancreatic beta-cells and mediates fatty acid effects on insulin secretion. Diabetes 54, 472–481 [DOI] [PubMed] [Google Scholar]
- 19. Kozomara A., Griffiths-Jones S. (2011) miRBase: integrating microRNA annotation and deep-sequencing data. Nucleic Acids Res. 39, D152–D157 [DOI] [PMC free article] [PubMed] [Google Scholar]
- 20. Li R., Li Y., Kristiansen K., Wang J. (2008) SOAP: short oligonucleotide alignment program. Bioinformatics 24, 713–714 [DOI] [PubMed] [Google Scholar]
- 21. Schmittgen T. D., Lee E. J., Jiang J., Sarkar A., Yang L., Elton T. S., Chen C. (2008) Real-time PCR quantification of precursor and mature microRNA. Methods 44, 31–38 [DOI] [PMC free article] [PubMed] [Google Scholar]
- 22. Rappsilber J., Ishihama Y., Mann M. (2003) Stop and go extraction tips for matrix-assisted laser desorption/ionization, nanoelectrospray, and LC/MS sample pretreatment in proteomics. Anal. Chem. 75, 663–670 [DOI] [PubMed] [Google Scholar]
- 23. Sury M. D., Chen J.-X., Selbach M. (2010) The SILAC fly allows for accurate protein quantification in vivo. Mol. Cell. Proteomics 9, 2173–2183 [DOI] [PMC free article] [PubMed] [Google Scholar]
- 24. Kelstrup C. D., Young C., Lavallee R., Nielsen M. L., Olsen J. V. (2012) Optimized fast and sensitive acquisition methods for shotgun proteomics on a quadrupole orbitrap mass spectrometer. J. Proteome Res., in press [DOI] [PubMed] [Google Scholar]
- 25. Cox J., Matic I., Hilger M., Nagaraj N., Selbach M., Olsen J. V., Mann M. (2009) A practical guide to the MaxQuant computational platform for SILAC-based quantitative proteomics. Nat. Protoc. 4, 698–705 [DOI] [PubMed] [Google Scholar]
- 26. Cox J., Neuhauser N., Michalski A., Scheltema R. A., Olsen J. V., Mann M. (2011) Andromeda: a peptide search engine integrated into the MaxQuant environment. J. Proteome Res. 10, 1794–1805 [DOI] [PubMed] [Google Scholar]
- 27. Ishihara H., Asano T., Tsukuda K., Katagiri H., Inukai K., Anai M., Kikuchi M., Yazaki Y., Miyazaki J. I., Oka Y. (1993) Pancreatic beta cell line MIN6 exhibits characteristics of glucose metabolism and glucose-stimulated insulin secretion similar to those of normal islets. Diabetologia 36, 1139–1145 [DOI] [PubMed] [Google Scholar]
- 28. Krek A., Grün D., Poy M. N., Wolf R., Rosenberg L., Epstein E. J., MacMenamin P., da Piedade I., Gunsalus K. C., Stoffel M., Rajewsky N. (2005) Combinatorial microRNA target predictions. Nat. Genet. 37, 495–500 [DOI] [PubMed] [Google Scholar]
- 29. Friedman R. C., Farh K. K., Burge C. B., Bartel D. P. (2009) Most mammalian mRNAs are conserved targets of microRNAs. Genome Res. 19, 92–105 [DOI] [PMC free article] [PubMed] [Google Scholar]
- 30. Saltiel A. R., Kahn C. R. (2001) Insulin signalling and the regulation of glucose and lipid metabolism. Nature 414, 799–806 [DOI] [PubMed] [Google Scholar]
- 31. Muoio D. M., Newgard C. B. (2008) Mechanisms of disease: molecular and metabolic mechanisms of insulin resistance and beta-cell failure in type 2 diabetes. Nat. Rev. Mol. Cell Biol. 9, 193–205 [DOI] [PubMed] [Google Scholar]
- 32. Walker M. D. (2008) Role of microRNA in pancreatic β-cells. Diabetes 57, 2567–2568 [DOI] [PMC free article] [PubMed] [Google Scholar]
- 33. Dueck A., Ziegler C., Eichner A., Berezikov E., Meister G. (2012) MicroRNAs associated with the different human Argonaute proteins. Nucleic Acids Res., 40(19):9850–9862 [DOI] [PMC free article] [PubMed] [Google Scholar]
- 34. Kredo-Russo S., Mandelbaum A. D., Ness A., Alon I., Lennox K. A., Behlke M. A., Hornstein E. (2012) Pancreas-enriched miRNA refines endocrine cell differentiation. Development 139, 3021–3031 [DOI] [PubMed] [Google Scholar]
- 35. Melkman-Zehavi T., Oren R., Kredo-Russo S., Shapira T., Mandelbaum A. D., Rivkin N., Nir T., Lennox K. A., Behlke M. A., Dor Y., Hornstein E. (2011) miRNAs control insulin content in pancreatic β-cells via down-regulation of transcriptional repressors. EMBO J. 30, 835–845 [DOI] [PMC free article] [PubMed] [Google Scholar]
- 36. Kanellopoulou C., Muljo S. A., Kung A. L., Ganesan S., Drapkin R., Jenuwein T., Livingston D. M., Rajewsky K. (2005) Dicer-deficient mouse embryonic stem cells are defective in differentiation and centromeric silencing. Genes Dev. 19, 489–501 [DOI] [PMC free article] [PubMed] [Google Scholar]
- 37. Charrier C., Machado P., Tweedie-Cullen R. Y., Rutishauser D., Mansuy I. M., Triller A. (2010) A cross-talk between β1 and β3 integrins controls glycine receptor and gephyrin trafficking at synapses. Nat. Neurosci. 13, 1388–1395 [DOI] [PubMed] [Google Scholar]
- 38. Hanus C., Vannier C., Triller A. (2004) Intracellular association of glycine receptor with gephyrin increases its plasma membrane accumulation rate. J. Neurosci. 24, 1119–1128 [DOI] [PMC free article] [PubMed] [Google Scholar]
- 39. Birkenfeld J., Betz H., Roth D. (2003) Identification of cofilin and LIM-domain-containing protein kinase 1 as novel interaction partners of 14-3-3ζ. Biochem. J. 369, 45–54 [DOI] [PMC free article] [PubMed] [Google Scholar]
- 40. Lee E. K., Kim W., Tominaga K., Martindale J. L., Yang X., Subaran S. S., Carlson O. D., Mercken E. M., Kulkarni R. N., Akamatsu W., Okano H., Perrone-Bizzozero N. I., de Cabo R., Egan J. M., Gorospe M. (2012) RNA-binding protein HuD controls insulin translation. Mol. Cell 45, 826–835 [DOI] [PMC free article] [PubMed] [Google Scholar]
- 41. Lellis-Santos C., Sakamoto L. H., Bromati C. R., Nogueira T. C., Leite A. R., Yamanaka T. S., Kinote A., Anhê G. F., Bordin S. (2012) The regulation of Rasd1 expression by glucocorticoids and prolactin controls peripartum maternal insulin secretion. Endocrinology 153, 3668–3678 [DOI] [PubMed] [Google Scholar]
- 42. Duvillié B., Cordonnier N., Deltour L., Dandoy-Dron F., Itier J. M., Monthioux E., Jami J., Joshi R. L., Bucchini D. (1997) Phenotypic alterations in insulin-deficient mutant mice. Proc. Natl. Acad. Sci. U.S.A. 94, 5137–5140 [DOI] [PMC free article] [PubMed] [Google Scholar]
- 43. Waanders L. F., Chwalek K., Monetti M., Kumar C., Lammert E., Mann M. (2009) Quantitative proteomic analysis of single pancreatic islets. Proc. Natl. Acad. Sci. U.S.A. 106, 18902–18907 [DOI] [PMC free article] [PubMed] [Google Scholar]
- 44. Stephens S. B., Schisler J. C., Hohmeier H. E., An J., Sun A. Y., Pitt G. S., Newgard C. B. (2012) A VGF-derived peptide attenuates development of type 2 diabetes via enhancement of islet β-cell survival and function. Cell Metab. 16, 33–43 [DOI] [PMC free article] [PubMed] [Google Scholar]
- 45. Goodman A. R., Cardozo T., Abagyan R., Altmeyer A., Wisniewski H. G., Vilcek J. (1996) Long pentraxins: an emerging group of proteins with diverse functions. Cytokine Growth Factor Rev. 7, 191–202 [DOI] [PubMed] [Google Scholar]
- 46. Schlimgen A. K., Helms J. A., Vogel H., Perin M. S. (1995) Neuronal pentraxin, a secreted protein with homology to acute phase proteins of the immune system. Neuron 14, 519–526 [DOI] [PubMed] [Google Scholar]
- 47. Schvartz D., Couté Y., Brunner Y., Wollheim C. B., Sanchez J.-C. (2012) Modulation of neuronal pentraxin 1 expression in rat pancreatic β-cells submitted to chronic glucotoxic stress. Mol. Cell. Proteomics 11, 244–254 [DOI] [PMC free article] [PubMed] [Google Scholar]
- 48. Eichelbaum K., Winter M., Diaz M. B., Herzig S., Krijgsveld J. (2012) Selective enrichment of newly synthesized proteins for quantitative secretome analysis. Nat. Biotechnol. 30, 984–990 [DOI] [PubMed] [Google Scholar]
- 49. Leibiger I. B., Leibiger B., Berggren P.-O. (2008) Insulin signaling in the pancreatic beta-cell. Annu. Rev. Nutr. 28, 233–251 [DOI] [PubMed] [Google Scholar]
Associated Data
This section collects any data citations, data availability statements, or supplementary materials included in this article.