

Background: Aminoacyl-tRNA (aa-tRNA) enters the ribosome in a ternary complex with the G-protein elongation factor Tu (EF-Tu) and GTP.
Results: EF-Tu·GTP·aa-tRNA ternary complex formation and decay rates are accelerated in the presence of the nucleotide exchange factor elongation factor Ts (EF-Ts).
Conclusion: EF-Ts directly facilitates the formation and disassociation of ternary complex.
Significance: This system demonstrates a novel function of EF-Ts.
Keywords: G-proteins, Guanine Nucleotide Exchange Factor (GEF), Protein Synthesis, Transfer RNA (tRNA), Translation Regulation, Elongation Factor Ts, Elongation Factor Tu, Ternary Complex
Abstract
Aminoacyl-tRNA enters the translating ribosome in a ternary complex with elongation factor Tu (EF-Tu) and GTP. Here, we describe bulk steady state and pre-steady state fluorescence methods that enabled us to quantitatively explore the kinetic features of Escherichia coli ternary complex formation and decay. The data obtained suggest that both processes are controlled by a nucleotide-dependent, rate-determining conformational change in EF-Tu. Unexpectedly, we found that this conformational change is accelerated by elongation factor Ts (EF-Ts), the guanosine nucleotide exchange factor for EF-Tu. Notably, EF-Ts attenuates the affinity of EF-Tu for GTP and destabilizes ternary complex in the presence of non-hydrolyzable GTP analogs. These results suggest that EF-Ts serves an unanticipated role in the cell of actively regulating the abundance and stability of ternary complex in a manner that contributes to rapid and faithful protein synthesis.
Introduction
GTP-hydrolyzing proteins (GTPases)2 play a central role in a vast array of biological systems (1–4). In bacteria, the three-domain GTPase elongation factor (EF) Tu, a member of the TRAFAC (translation factors) class of G-proteins (2, 73), chaperones the entry of aa-tRNA into the messenger RNA (mRNA)-programmed ribosome during the process of protein synthesis (5–8). This multistep and highly conserved process is a critical determinant of the mechanism of translational fidelity (9) and is exquisitely regulated by EF-Tu-catalyzed GTP hydrolysis while bound to the ribosome.
Efforts to understand how EF-Tu facilitates the process of aa-tRNA selection have depended critically on high resolution structural information of active (EF-Tu·GTP) and inactive (EF-Tu·GDP) forms of EF-Tu. Toward this goal, atomic resolution structures of EF-Tu bound within its “ternary complex” with GTP and aa-tRNA and bound to GDP have been solved (10–15). This work revealed that EF-Tu·GTP and EF-Tu·GDP exhibit markedly distinct conformations characterized by “compact” and “extended” configurations, respectively. Related investigations showing that only EF-Tu·GTP binds aa-tRNA with high affinity (approximately nanomolar) suggested that the capacity of EF-Tu to achieve its activated, compact form is a critical determinant of high affinity aa-tRNA binding (16–20).
In its compact configuration, the three domains of EF-Tu (D1, D2, and D3) closely interact with each other and with the tRNA acceptor stem (see Fig. 1, A and B) (10, 21). The high affinity nature of the EF-Tu/GTP/aa-tRNA interaction is further buttressed by the formation of an amino acid binding pocket at the interface of domains 1 (also referred to as the G domain) and 2 of the protein (20, 22). There, histidine 66 (His-66) within domain 1 stacks on the aminoacyl side chain linked to the 3′-hydroxyl group of the terminal adenosine residue (A76) of tRNA (20). In EF-Tu·GDP, domain 1 is distal to domains 2 and 3 (10), rationalizing why this form of the protein does not bind aa-tRNA (16, 17, 19). These findings suggest that compact and extended conformations of EF-Tu define active and inactive states of the G-protein, respectively, and that the active EF-Tu fold is somehow dependent on the terminal phosphate of GTP.
FIGURE 1.

Ternary complex structure and steady state measurements of ternary complex formation. A, structure of ternary complex stabilized by the antibiotic kirromycin (Protein Data Bank code 1OB2). E. coli EF-Tu (blue) bound to GDPNP (carbon atoms in gray, nitrogen in blue, oxygen in red, and phosphorous atoms in orange) is complexed with Saccharomyces cerevisiae Phe-tRNAPhe (wheat). Domains of EF-Tu are represented as D1, D2, and D3. For simplicity, kirromycin is not shown. B, specific functional elements are highlighted: switch 1 (S1) is in red, switch 2 (S2) is in orange, His-66 is in green, and the Phe amino acid is in purple. C, the affinity of EF-Tu for aminoacyl-tRNA was determined by titrating EF-Tu (open diamonds) or EF-Tu·EF-Ts (closed squares) into a solution of Cy3-labeled Phe-tRNAPhe and 10 μm GTP. An identical titration of EF-Tu was performed either with deacylated tRNAPhe (circles) or in the absence of GTP (blue squares). D, the apparent nucleotide affinity was measured by titrating GTP into a cuvette containing Phe-tRNAPhe (Cy3-acp3U47) and EF-Tu (open diamonds) or EF-Tu·EF-Ts (closed diamonds). Identical titration experiments of GDPNP with EF-Tu (open triangles) and EF-Tu·EF-Ts (closed triangles) and GTPγS with EF-Tu (open squares) or EF-Tu·EF-Ts (closed squares) are shown. Error bars represent the S.E. of three separate experiments. Estimates of the apparent KD were obtained by fitting the titration data as described under “Experimental Procedures.” Data points were splined for clarity.
High resolution structures of ternary complex bound to the ribosome have revealed that GTP hydrolysis leads directly to conformational changes within the GTP binding pocket (15). This region includes the so-called switch-1 (S1), switch-2 (S2), and P loop motifs that are conserved in all G-proteins (2). The S1 element is structurally linked to the amino acid binding pocket and engages the triphosphate moiety of the GTP nucleotide via a bridging magnesium ion (Mg2+) (see Fig. 1B). The S1 element becomes disordered following GTP hydrolysis on the ribosome (15) and adopts an alternative β hairpin conformation in the EF-Tu·GDP structure (14). Collectively, these findings suggest that structural transitions within S1 likely contribute to the transition between GTP- and GDP-bound conformations of the protein and the aa-tRNA selection mechanism.
Ensemble, steady state measurements of ternary complex (16, 17, 19, 23–27) together with estimated intracellular concentrations of EF-Tu, aa-tRNA (approximately tens of micromolar), and GTP (approximately millimolar) suggest that most (>90%) aa-tRNA is complexed with EF-Tu in actively growing bacteria (24, 28). However, the steady state concentration of ternary complex is strongly dependent on numerous biochemical processes, including the rates of ribosome-catalyzed protein synthesis, amino acid availability, and the relative intracellular concentrations of GTP and GDP. The concentration of ternary complex is also dependent on the activity of EF-Ts, the guanosine nucleotide exchange factor (GEF) for EF-Tu that is required to convert EF-Tu·GDP released from the ribosome into an EF-Tu·GTP form that is again competent for aa-tRNA binding. Notably, EF-Ts is also present at micromolar concentrations in the cell (29–31). EF-Tu has an ∼60-fold higher affinity for GDP over GTP and a slow rate of spontaneous nucleotide exchange (28). Correspondingly, EF-Ts activity is essential for cellular growth (32, 33) as it regulates ternary complex abundance in the cell and consequently the rates of protein synthesis.
The importance of normal EF-Tu functions to cellular growth is highlighted by the prevalence of chemically distinct antibiotics that alter EF-Tu activities (34–37). Thiostrepton-class peptide antibiotics bind to the large ribosomal subunit GTPase-activating center to disrupt ternary complex binding to the A site (38). GE2270A class thiazolyl peptide antibiotics bind directly to EF-Tu at the domain 1/2 interface to prevent its interaction with aa-tRNA (36). Kirromycin binds at the domain 1/3 interface of EF-Tu to stall ternary complex on actively translating ribosomes (9, 39–42) immediately after GTP hydrolysis by preventing conformational changes in EF-Tu required for its release from aa-tRNA. Thus, the dynamics of ternary complex formation and stability are critical for cellular viability. However, pre-steady state kinetic information regarding the rates of ternary complex formation and decay is currently lacking.
To assess dynamic aspects of the Escherichia coli EF-Tu·GTP·aa-tRNA ternary complex, here we describe a pre-steady state, fluorescence-based approach that reports on binding between EF-Tu and aa-tRNA. We used this signal to investigate rate-determining conformational changes that control the high affinity interactions of EF-Tu with aa-tRNA. Remarkably, these investigations revealed that the dynamics of ternary complex formation and decay are markedly increased in the presence of EF-Ts. We conclude that EF-Ts directly interacts with EF-Tu while bound to aa-tRNA to regulate its affinity for GTP and aa-tRNA ligands. We speculate that EF-Ts regulates the stability and turnover of ternary complex by catalyzing rate-limiting conformational processes in the nucleotide binding pocket of EF-Tu that are responsible for aa-tRNA binding and release.
EXPERIMENTAL PROCEDURES
Purification of Elongation Factors
His6-EF-Tu (tufA) and -EF-Ts (tsf) were expressed recombinantly in E. coli and purified by nickel-nitrilotriacetic acid affinity chromatography in the absence of magnesium as described previously (43). After cleavage, protein factors were further purified using Superdex 75 gel filtration chromatography equilibrated in buffer A (50 mm Tris-HCl, pH 7.5, 100 mm NH4Cl, 10 mm MgCl2, 0.5 mm EDTA, 50 mm KCl, 1 mm DTT). EF-Tu·EF-Ts complexes were formed by adding EF-Tu and EF-Ts (1:1.1) in buffer A and incubating at 23 °C for 15 min. The EF-Tu·EF-Ts complex was then isolated from unbound protein using Superdex 75 gel filtration chromatography equilibrated in buffer A. All factors were stored in buffer B (10 mm Tris-OAc, pH 7, 50 mm KCl, 1 mm DTT, 50% (v/v) glycerol) at −80 °C until further use. Kirromycin was purchased from Sigma, resuspended in 100% DMSO to 1 mm, and stored at −80 °C until further use.
Purification and Labeling of E. coli tRNAPhe
Wild-type E. coli tRNAPhe was purified from an RNase-deficient bacterial strain (MRE600) (44). Native tRNAPhe molecules were site-specifically labeled with the small molecule organic fluorophore Cy3 via the naturally occurring modified nucleotide acp3U present at position 47 (43, 45). tRNA molecules labeled in this fashion have been shown previously to retain wild-type activities in both aminoacylation and translation reactions (43, 46). Purified tRNAPhe was aminoacylated by mixing 7.5 pmol of labeled tRNAPhe with 6 pmol of phenylalanyl-tRNA synthetase and 10 nmol of phenylalanine amino acid in a volume of 10 μl in buffer C (50 mm Tris-HCl, pH 8, 20 mm KCl, 100 mm NH4Cl, 1 mm DTT, 2.5 mm ATP, 0.5 mm EDTA, 10 mm MgCl2). The sample was then incubated at 37 °C for 10 min. Aminoacylated tRNA was used immediately without storage.
Nucleotide Purification
Guanosine triphosphate (GTP), guanosine diphosphate (GDP), GDPNP, and GTPγS were purchased from Sigma and further purified on a Tricorn Mono Q 5/50 GL ion exchange column. mant-GTP was purchased from Jena Biosciences.
Fluorometer Experiments
All fluorescence measurements were performed using a Photon Technology International fluorescence meter with a 532-nm high pass filter (LP03–532RS-25 RazorEdge by Semrock) on the emission side. All samples were analyzed in a 3-ml quartz cuvette with constant mixing at 23 °C in buffer D (50 mm Hepes, pH 7, 20 mm KCl, 100 mm NH4Cl, 1 mm DTT, 0.5 mm EDTA, 2.5 mm MgCl2) with either 10 μm GTP or 400 nm EF-Tu or EF-Tu·EF-Ts. Steady state measurements were made by manually adding EF-Tu or EF-Tu·EF-Ts to a solution of Phe-tRNAPhe (Cy3-acp3U47) while exciting at 532 nm and monitoring 565 nm (Cy3) (see Fig. 1C). The dissociation constant, KD, was determined by fitting the fluorescence data obtained to Equation 1 (16).
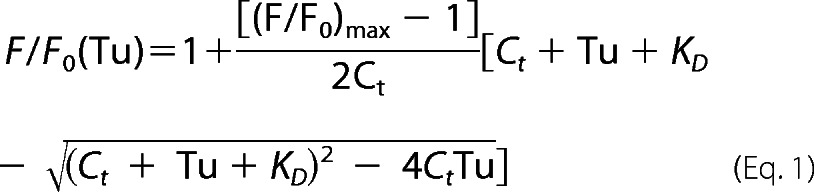 |
where F is the total fluorescence intensity, Fo is the initial fluorescence intensity, Ct is the total aa-tRNA concentration, and Tu is the total EF-Tu concentration. Identical titration experiments and fitting procedures (see Fig. 1D) were performed to provide a qualitative comparison between data sets. These nucleotide titration experiments yield “apparent” KD values.
Pre-steady state measurements were made by manually adding saturating protein factor (400 nm EF-Tu or EF-Tu·EF-Ts) to 5 nm Phe-tRNAPhe (Cy3-acp3U47) and 10 32 μM GTP and monitoring fluorescence changes over time. Apparent rates, kapp, were determined by fitting data to a single exponential function (47).
Rapid Stopped-flow Experiments
All experiments were performed at 23 °C in buffer D using an SX20 stopped-flow spectrometer from Applied Photophysics with a 550-nm long pass filter (OG550 by Schott). One injector port was loaded with protein factor preincubated with 2 mm GTP, whereas the other injector port was loaded with 400 nm Phe-tRNAPhe (Cy3-acp3U47). Concentrations reported in the main text are final concentrations after mixing.
Ternary Complex Isolation by Gel Filtration Chromatography
Ternary complex was formed by adding EF-Tu or previously formed EF-Tu·EF-Ts complex to Phe-tRNAPhe (4:1) in buffer D with 10 μm GTP and incubating for 15 min at 37 °C. Samples were purified using a Superdex 75 gel filtration column on an ÄKTA Purifier pre-equilibrated with buffer D either in the absence or presence of GTP or GDPNP (10 μm).
GTP Exchange Essay
Experiments were performed at room temperature in buffer D under conditions >10-fold above the KD for ternary complex formation to ensure that all EF-Tu present in the reaction is bound to tRNA (400 nm Phe-tRNAPhe, 5 nm Phe-tRNAPhe (Cy3-acp3U47), 400 nm EF-Tu or EF-Tu·EF-Ts, 10 μm mant-GTP). Complex formation was monitored by tracking the fluorescence of the Cy3 and mant fluorophore over time. Measurements of Cy3 and mant fluorescence were made by switching detection modes from 532-nm excitation/565-nm emission to 280-nm excitation/440-nm emission, respectively (28). The mant fluorescence signal was processed using the Savitzky-Golay method in OriginLab8 with a window of nine points (48).
RESULTS
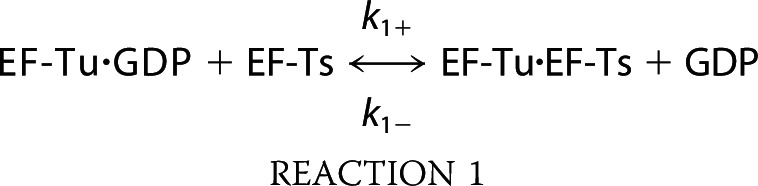
The process of ternary complex formation minimally proceeds through the following sequence of biochemical steps (49, 50).
 |
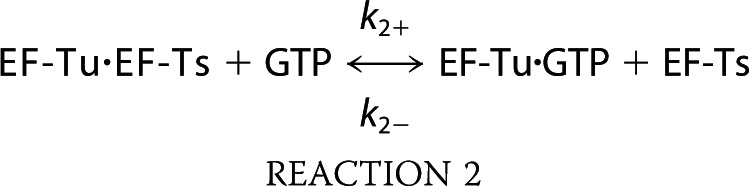 |
Here, Reactions 1 and 2 define the GEF activities of EF-Ts where EF-Ts functions to displace GDP from EF-Tu and facilitate the association of EF-Tu with GTP (18, 28, 51, 52). In this minimal reaction scheme, the EF-Tu·GDP·EF-Ts complex implicit in Reaction 1 exists only transiently (k− = 125 s−1) (28). Likewise, the EF-Tu·GTP·EF-Ts species implicit in Reaction 2 is also transient in nature (k− = 60 s−1) (28). The rates of ternary complex formation and dissociation (Reaction 3 in this reaction scheme) have been largely inferred from an array of steady state investigations (16, 17, 19, 23, 25, 26). Direct pre-steady state information, however, is currently lacking. In particular, little is presently known about how this reaction proceeds in the presence of EF-Ts as it natively occurs in the cell.
Steady State Measurements of Ternary Complex Formation
Following procedures analogous to those previously described using Phe-tRNAPhe fluorescently labeled at the 4-thiouridine residue at position 8 (s4U8) (16), we first attempted to determine the apparent affinity of EF-Tu for Cy3-acp3U47-labeled Phe-tRNAPhe using a steady state approach. Here, the fluorescence intensity of the Cy3 fluorophore linked to tRNA was tracked as a function of EF-Tu concentration. Titrations were performed by addition of either EF-Tu·GTP where EF-Tu was preincubated with 10 μm GTP or an EF-Tu·EF-Ts complex to a reaction mixture containing 5 nm Phe-tRNAPhe (Cy3-acp3U47) and 10 μm GTP at room temperature (23 °C).
Under these experimental conditions, both measurements resulted in an EF-Tu-dependent increase in Cy3 fluorescence intensity that plateaued at ∼30% above base line (Fig. 1C). Such changes are speculated to arise from an environment-specific increase in Cy3 quantum yield upon ternary complex formation, stemming from reductions in solvent-mediated, non-radiative relaxation pathways and/or cis-trans isomerization rates (53, 54). Consistent with previous studies (16) and the determinants of ternary complex formation as outlined in Reaction 3, the observed increase in Cy3 fluorescence intensity was strictly dependent upon the presence of GTP as well as the acylation of tRNAPhe with the Phe amino acid (Fig. 1C). The apparent equilibrium dissociation constant for the ternary complex interaction was estimated by fitting the raw data to the reaction scheme derived for relative fluorescence measurements (see “Experimental Procedures”). In agreement with previously described steady state measurements of this type, a high affinity interaction was observed both in the absence (KD ∼47 ± 3.1 nm) and presence of EF-Ts (KD ∼12.6 ± 1.1 nm) (Table 1) (16, 17, 19, 20, 23, 55, 56). These findings suggest that the observed changes in Cy3 fluorophore intensity specifically report on a GTP-dependent interaction of EF-Tu with the acylated acceptor stem of Phe-tRNAPhe. They also suggest that EF-Ts substantially increases the apparent affinity of this interaction.
TABLE 1.
Equilibrium dissociation constant of ternary complex
The ternary complex was formed by titrating either factor or nucleotide in the absence or presence of EF-Ts.
| Dissociation constant KD |
||
|---|---|---|
| EF-Ts(−) | EF-Ts(+) | |
| nm | ||
| Factor | 47 ± 3.1 | 12.6 ± 1.1 |
| GTP | 195 ± 25 | 685 ± 35 |
| GDPNP | 7000 ± 100 | 9270 ± 105 |
| GDPγS | 240 ± 18 | 490 ± 41 |
The observed disparity between EF-Tu and EF-Tu·EF-Ts affinities for aa-tRNA could not be explained by differences in EF-Tu activities (Fig. 2). Activity was determined by titrating either EF-Tu or EF-Tu·EF-Ts into a solution of 400 nm Phe-tRNAPhe (Cy3-acp3U47) and 10 μM GTP. For 100% active reagents, a linear increase in signal is expected followed by a sharp inflection at a protein concentration equal to the concentration of Phe-tRNAPhe present in the reaction (57). In our experiments, such an inflection was observed at ∼500 nm factor, indicating that EF-Tu is ∼80% active both in the absence and presence of EF-Ts.
FIGURE 2.
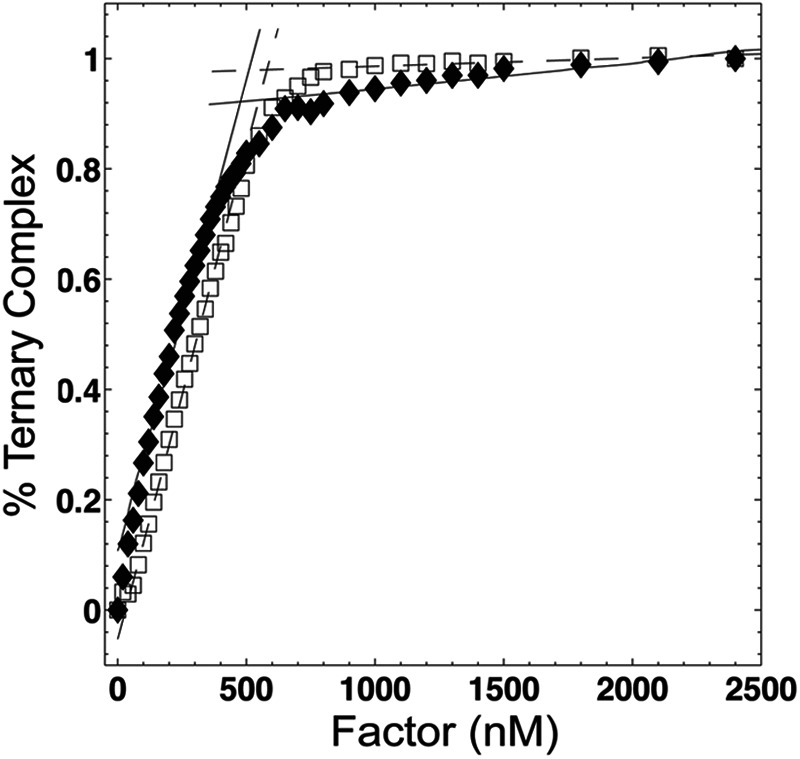
EF-Tu is highly active in both the absence and presence of EF-Ts. The fraction of active EF-Tu molecules present in our protein preparation was determined by titrating EF-Tu (open squares) or EF-Tu·EF-Ts (closed diamonds) into a solution of 400 nm Phe-tRNAPhe (Cy3-acp3U47) in the presence of 10 μm GTP. Linear fits of the initial and final 10 data points of these two experiments intercept at 517 and 496 nm for EF-Tu and EF-Tu·EF-Ts, respectively, indicating that EF-Tu is ∼80% active in the absence and presence of EF-Ts.
Analogous steady state measurements were next conducted to assess the nucleotide dependence of ternary complex formation. To do so, experiments were performed by titrating GTP into a solution of 5 nm Phe-tRNAPhe (Cy3-acp3U47) in the presence of saturating concentrations of either nucleotide-free EF-Tu or EF-Tu·EF-Ts complex both at 500 nm (>10-fold above their apparent KD). For both systems, an ∼30% increase in Cy3 fluorescence intensity was observed at elevated GTP concentrations (Fig. 1D). For the experiments with EF-Tu alone, fitting procedures (see “Experimental Procedures”) revealed an apparent affinity of KD ∼195 ± 12 nm, whereas experiments performed with EF-Tu·EF-Ts revealed that the apparent affinity was ∼3.5-fold weaker (KD ∼685 ± 35 nm) (Fig. 1D). These data suggest that additional complexities exist in the ternary complex formation reaction beyond those delineated by Reaction 3. Such findings could be explained if ternary complex is in a dynamic equilibrium and EF-Ts alters this exchange process by specifically modulating the affinity of the nucleotide for EF-Tu.
This model predicts that the ternary complex formation and thus the observed fluorescence intensity change will be sensitive to the precise nature of the EF-Tu/GTP interaction. To examine this hypothesis, identical experiments were repeated with non-hydrolyzable GTP analogs GDPNP and GTPγS. As anticipated by the model, the extent of ternary complex formation was significantly lower in the presence of non-hydrolyzable GTP analogs (Fig. 1D and Table 1). For each analog, this trend was exacerbated in the presence of EF-Ts. These findings suggest that the observed fluorescence change reports on conformational events in the system that are sensitive to chemical and/or structural features of the γ-phosphate constituent of the nucleotide. Inspection of the ternary complex structure (Fig. 1, A and B) suggests that such conformational changes likely entail the formation of contacts between the S1 helix and the γ-phosphate of GTP.
Pre-Steady State Measurements of Ternary Complex Formation
To obtain a deeper understanding of the kinetic parameters underpinning Reaction 3, we performed pre-steady state measurements to monitor ternary complex formation in real time. Data were obtained by rapidly adding saturating (400 nm final) concentrations of EF-Tu or EF-Tu·EF-Ts complex to a solution of 5 nm Phe-tRNAPhe (Cy3-acp3U47) and 10 μm GTP. Consistent with our steady state measurements, the addition of EF-Tu resulted in a ∼30% increase in Cy3 fluorescence intensity that reached steady state within seconds (Fig. 3A) and remained stable over several hours (data not shown). Fitting the time course of the fluorescence intensity change to an equation for pre-steady state reactions of this kind (see “Experimental Procedures”) revealed an apparent association rate, kapp,1, of 0.38 s−1 for EF-Tu and 0.5 s−1 for the EF-Tu·EF-Ts complex (Fig. 3B). The factor concentration-dependence of kapp,1 revealed that the maximum rates of ternary complex formation for both systems at 10 μm GTP saturated at approximately similar levels: ∼0.5 s−1 for EF-Tu and 0.55 s−1 for the EF-Tu·EF-Ts complex.
FIGURE 3.

Pre-steady state measurements of ternary complex formation and dissociation: dependence on factor concentration. A, the time-dependent response in fluorescence intensity observed upon addition of saturating amounts (400 nm) of either EF-Tu (blue) or EF-Tu·EF-Ts (black) to Cy3-labeled Phe-tRNAPhe (5 nm) and GTP (10 μm) or EF-Tu·EF-Ts in the absence of GTP (gray). Fitting the data (see “Experimental Procedures”) provided a quantitative measure of the apparent rate of ternary complex formation, kapp,1. A focused plot of the formation process is also shown (inset). B, measurements of kapp,1 as a function of either EF-Tu (open diamonds) or EF-Tu·EF-Ts (closed squares). The inset shows the linear fits of early factor titration data points. C, the time-dependent response in fluorescence intensity observed upon addition of saturating amounts of GDP (100 μm) to ternary complex preformed as described in A with either EF-Tu (blue) or EF-Tu·EF-Ts (black). Identical experiments were performed using ADP (100 μm) (gray). D, fitting to a single exponential function provided a quantitative measure of the off-rate of ternary complex formation, kapp,2, as a function of either EF-Tu (open diamonds) or EF-Tu·EF-Ts (closed squares) as described in C. E, similar disassociation experiments were performed at varying GTP concentrations. Addition of saturating GDP to ternary complex preformed with an excess of EF-Tu (open diamonds) or EF-Tu·EF-Ts (closed squares) and 5 nm Phe-tRNAPhe in the presence of GTP (50 nm–500 μm). Apparent decay rates, kapp,2, were estimated by fitting to a single exponential function. F, GDP (100 μm) was delivered to ternary complex preformed with EF-Tu·EF-Ts in the absence (black) or presence (tan) of kirromycin. The rate of GDP mediated dissociation in the absence of kirromycin (kapp,2 = 0.28 s−1) was found to be 14 times faster than in the presence of kirromycin (kapp,2 = 0.02 s−1). Error bars represent the S.E. from three independent experiments.
Further insights into the on- and off-rate kinetics underpinning ternary complex formation and dissociation reactions were obtained by inspecting how kapp,1 changed at low factor concentrations where the concentration-dependence is linear. The on-rate of the ternary complex formation, determined by setting the slope of kapp,1 to kon/(1 + koff/kapp,∞) (47), revealed that the on-rate in the presence of 10 μm GTP is ∼1.2 ± 0.07 and 1.7 ± 0.1 μm−1 s−1 for EF-Tu and the EF-Tu·EF-Ts complex, respectively (Fig. 3B, inset, and Table 2), in close agreement with published values (17). A preliminary estimate of the factor off-rates, defined by the y intercept, revealed that EF-Tu dissociates slowly from aa-tRNA (on the order of 0.05 s−1). These values are in good agreement with both our own (Table 1) and previous affinity measurements (20).
TABLE 2.
Summary of kinetic parameters of ternary complex
Kinetic descriptors of ternary complex were determined from the apparent rates of ternary complex formation at 10 μm GTP.
To directly examine the dissociation kinetics of ternary complex, pre-steady state measurements were performed in which a 10-fold molar excess of GDP (100 μm) was added to ternary complex preformed with 10 μm GTP and a 400 nm concentration of either EF-Tu or EF-Tu·EF-Ts. In line with the notion that EF-Tu binds tightly to aa-tRNA, the addition of GDP to the preformed ternary complex caused a slow decrease in Cy3 fluorescence, returning the system to base-line intensity at a rate, kapp,2, of ∼0.015 s−1 (Fig. 3C). This rate was independent of factor (Fig. 3D) and GTP concentrations (Fig. 3E) and consistent with our off-rate estimates (Fig. 3B).
Identical experiments performed with 400 nm EF-Tu·EF-Ts showed a similar overall reduction in fluorescence intensity upon GDP addition but at an ∼20-fold faster decay rate (kapp,2 ∼0.3 s−1) (Fig. 3C). Notably, the apparent rate of GDP-induced ternary complex dissociation, kapp2, increased linearly as a function of EF-Tu·EF-Ts concentration from ∼0.03 s−1, extrapolated to 0 nm EF-Ts, up to ∼0.5 s−1 at the highest concentration tested (1 μm) (Fig. 3D). The accelerated rate of GDP-induced ternary complex dissociation in the presence of EF-Ts was observed to be independent of GTP concentration (Fig. 3E). Although the concentration of free EF-Ts (not bound to EF-Tu) in these experiments is difficult to estimate, it is anticipated to be substantially lower than EF-Tu·EF-Ts concentration given the known KD of the EF-Tu/EF-Ts interaction (3 nm) (28). We conclude that EF-Ts plays a direct role in ternary complex dissociation in the presence of GDP and that the recognition process occurs at a rate that is likely to significantly exceed 1.5 μm−1 s−1 (determined from the slope of the line shown in Fig. 3D, inset).
To examine the physical basis of the observed dissociation reaction coordinate, identical experiments were performed in the presence of kirromycin, an antibiotic that directly binds EF-Tu at the interface between domains 1 and 3 (21). As anticipated from its known propensity to prevent EF-Tu dissociation from aa-tRNA (39–41), in the presence of kirromycin, ternary complex was observed to be strongly resistant to GDP-induced dissociation even in the presence of EF-Ts (Fig. 3F). This finding is consistent with a model in which the dissociation of EF-Tu from aa-tRNA proceeds via rearrangements at the interface between domains 1 and 3 of EF-Tu.
To address the physiological relevance of these findings, we performed pre-steady state measurements of ternary complex formation at near cellular concentrations of protein factors (0.2–15 μm), aa-tRNA (0.2 μm), and GTP (1 mm) using stopped-flow instrumentation. Here, EF-Tu and EF-Tu·EF-Ts were preincubated with GTP. As shown previously (Fig. 3), the signal obtained was strictly dependent on the aminoacyl moiety of Phe-tRNAPhe and GTP (data not shown). At these concentrations, the apparent rate of ternary complex formation for EF-Tu alone plateaued at a rate of ∼20 s−1 (Fig. 4), whereas in the presence of EF-Ts, the rate of ternary complex formation increased to ∼85 s−1. These distinct asymptotic values suggest that EF-Ts accelerates the rate-determining step of ternary complex formation by directly facilitating the process of EF-Tu·GTP loading onto Phe-tRNAPhe. Under these conditions, ternary complex dissociation was also observed to be accelerated by the presence of EF-Ts (Fig. 3D). These findings suggest that our findings are relevant to ternary complex dynamics as they occur in the cell.
FIGURE 4.
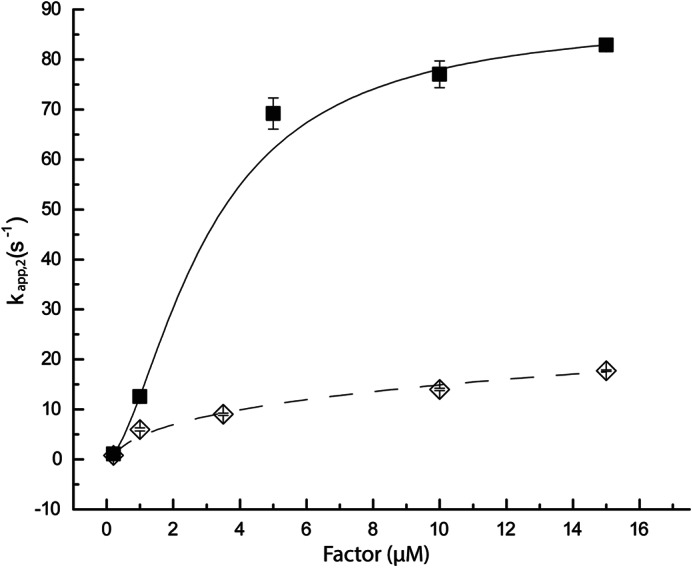
EF-Ts accelerates the rate-determining step in EF-Tu binding to aa-tRNA. Ternary complex was formed by rapid mixing of 200 nm Phe-tRNAPhe (Cy3-acp3U47) with EF-Tu or EF-Tu·EF-Ts preincubated in the presence of 1 mm GTP. Time courses of complex formation were fit to a single exponential function, and apparent rates were plotted as a function of EF-Tu (open diamonds) or EF-Tu·EF-Ts (closed squares) concentration. Under these conditions, the apparent rate of complex formation observed asymptotically approached ∼20 s−1 for EF-Tu and ∼85 s−1 for EF-Tu·EF-Ts. Error bars represent the S.E.
Physical Isolation of the Dynamic Ternary Complex
To directly test the hypothesis that ternary complex formation and decay are in dynamic equilibrium, we set out to examine its stability by gel filtration chromatography. Here, a strong prediction of the dynamic equilibrium model is that ternary complex will dissociate when efficiently separated from GTP. For these experiments, a single solution of ternary complex was prepared using saturating concentrations of GTP, EF-Tu (or EF-Tu·EF-Ts), and Phe-tRNAPhe (Cy3-acp3U47) (10, 12, and 3 μm, respectively). Portions of this reaction were subjected to gel filtration experiments first in the absence and then in the presence of GTP in the running buffer while monitoring the elution time of Cy3-labeled Phe-tRNAPhe by UV absorbance at 550 nm (see “Experimental Procedures”). Both in the absence and presence of EF-Ts, detection of the Cy3-labeled Phe-tRNAPhe ternary complex, eluting at the predicted molecular mass of ∼75,000 Da, was maximized when GTP was included in the running buffer (Fig. 5). Consistent with the highly active nature of the components used in our investigations, >90% of Cy3-labeled Phe-tRNAPhe was found in a ternary complex under these conditions. When GTP was not included in the mobile phase, the amount of tRNA detected in ternary complex was significantly reduced in the absence of EF-Ts and completely abolished in the presence of EF-Ts. Analogous experiments conducted with 10 μm GDPNP in the mobile phase showed only ∼5% of the total tRNA in ternary complex (Fig. 5). These findings provide compelling evidence in support of the dynamic nature of ternary complex. They also support a model in which ternary complex dissociation proceeds through sequential conformational events in EF-Tu that first enable GTP dissociation and then aa-tRNA release.
FIGURE 5.

Physical isolation of ternary complex. Ternary complex formed in the presence of saturating concentrations of EF-Tu (circles) or EF-Tu·EF-Ts (diamonds), Cy3-labeled Phe-tRNAPhe, and GTP (see “Experimental Procedures”) was fractionated over a Superdex 75 gel filtration column in the presence (black) or absence (red) of GTP (10 μm) in the running buffer. Absorbance was recorded at 550 and 260 nm to specifically track the elution times of “unbound” and ternary complex-bound Cy3-labeled Phe-tRNAPhe as indicated. This was repeated with GDPNP in the reaction and running buffer (blue triangles).
Direct Evidence That EF-Ts Facilitates Ternary Complex Dynamics
Our previous data indicate that EF-Ts accelerates the disassembly of ternary complex upon GDP addition. To differentiate between a model where EF-Ts only breaks down ternary complex in response to GDP addition or where EF-Ts is continually facilitating ternary complex formation and decay, we set out to directly monitor the nucleotide exchange process on EF-Tu using the fluorescent GTP analog (10 μm) mant-GTP under conditions where ternary complex appears to be stable for extended periods (as seen in Fig. 3A). To ensure that the majority of EF-Tu is bound to aa-tRNA at steady state, ternary complex was formed at component concentrations >10-fold the apparent KD (400 nm EF-Tu or EF-Tu·EF-Ts, 400 nm Phe-tRNAPhe, 5 nm Phe-tRNAPhe (Cy3-acp3U47) (Fig. 2 and see “Experimental Procedures”). This experimental setup allowed us to monitor ternary complex formation by two distinct spectroscopic means in the same experiment: a change in Cy3 fluorescence intensity (Figs. 1, 3, and 4) and FRET between tryptophan 184 in EF-Tu and the mant moiety of the mant-GTP nucleotide (28). As expected for a reaction in which the mant-GTP nucleotide binds to EF-Tu, addition of the EF-Tu·EF-Ts complex to Phe-tRNAPhe and mant-GTP resulted in a rapid increase in mant-GTP fluorescence intensity (Fig. 6, region II). Consistent with ternary complex formation, Cy3 fluorescence intensity also increased during this reaction.
FIGURE 6.

EF-Ts directly facilitates ternary complex turnover. Region I, the relative fluorescence intensities of Cy3 (green; right axis) and mant (black; left axis) obtained from a solution containing 400 nm Phe-tRNAPhe (unlabeled), 5 nm Phe-tRNAPhe (Cy3-acp3U47), and 10 μm mant-GTP in the absence of factor. Region II, the increase in mant fluorescence intensity (black; left axis) and Cy3 fluorescence intensity (green; right axis) resulting from addition of 400 nm EF-Tu·EF-Ts to the mixture. Region III, addition of saturating amounts of unlabeled GTP (100 μm) resulted in a rapid decrease (kturnover = 0.6 ± 0.03 s−1) in the mant signal (black; left axis), whereas the Cy3 signal (green; right axis) exhibited a small increase in intensity.
To directly monitor the process of nucleotide exchange, a 10-fold molar excess of unlabeled GTP was added to the same reaction while monitoring mant-GTP fluorescence (Fig. 6, region III). Here, the mant-GTP signal rapidly returned to base line (kturnover ∼0.6 ± 0.03 s−1; Table 2), whereas examination of the Cy3 fluorescence intensity showed that ternary complex remained intact (Fig. 6, region III). A slight increase in Cy3 fluorescence was also observed, likely reflecting a subtle change in ternary complex stability in the presence of unlabeled GTP. In similar experiments using only EF-Tu, the rate of the mant-GTP exchange was greatly reduced (kturnover ∼0.005 ± 4 × 10⁻⁵ s−1; data not shown). These experiments demonstrate that the EF-Ts activities observed are not in response to an insult (such as GDP) but are instead actively occurring in the presence of GTP where ternary complex appears stable. Inclusion of kirromycin in the experiment effectively blocked the mant-GTP nucleotide exchange process (data not shown). This finding suggests that rearrangements at the interface of domains 1 and 3 of EF-Tu are required for the exchange process.
DISCUSSION
In the present investigation, we developed a means to explore the kinetic and thermodynamic properties of the E. coli ternary complex EF-Tu·GTP·Phe-tRNAPhe using bulk fluorescence methods. Akin to earlier steady state measurements of ternary complex formation (16), the fluorescence-based assays described here are based on changes in relative fluorescence intensity. However, unlike earlier work, the approach we describe is based on the environmentally sensitive Cy3 fluorophore (43, 58) at a distinct site of tRNA attachment, the naturally occurring modified nucleotide acp3U present at position 47 in E. coli tRNAPhe. Although this modification is not as ubiquitous as the s4U residue utilized previously, tRNA molecules modified at this site have been shown to be fully functional in all aspects of the translation process, including aminoacylation, tRNA selection, and translocation (43, 46, 60). The data presented show that the functionality of acp3U-labeled tRNAPhe also extends to ternary complex formation. In agreement with prior fluorescence investigations of ternary complex formation obtained under steady state conditions (16), we show that the formation of ternary complex strictly depends on the GTP nucleotide and the aminoacyl moiety of aa-tRNA. We also show that the EF-Tu·GTP·Phe-tRNAPhe complex forms a high affinity (nm KD) interaction (Fig. 1C) (17, 19, 20, 23, 25, 26).
Unexpectedly, however, we observed that the apparent affinity of ternary complex formation is significantly enhanced in the presence of EF-Ts, the GEF for EF-Tu (KD ∼12 versus ∼47 nm; Table 1). These findings could not be rationalized based on trivial differences in EF-Tu activities in the absence and presence of EF-Ts (e.g. that 80% of the EF-Tu preparation was bound to GDP; Fig. 2). Moreover, the propensity of EF-Ts to decrease the efficiency with which ternary complex was formed in the presence of non-hydrolyzable GTP analogs also suggested an unanticipated function of EF-Ts as a fidelity determinant of ternary complex formation and stability (Fig. 1D). In striking contrast to contemporary models in which EF-Ts serves only as the GEF for EF-Tu (49, 62), these findings collectively led us to examine whether EF-Ts functions to regulate ternary complex stability in a direct manner through modulation of the nucleotide binding site.
In line with previous investigations using yeast components (63), pre-steady state measurements obtained under conditions designed to approximate the cellular concentrations of aa-tRNA, GTP, and EF-Tu suggested that the bacterial ternary complex forms via a rate-limiting conformational event in EF-Tu that occurs at a rate of ∼20 s−1. However, in the presence of cellular concentrations of EF-Ts, ternary complex formation was observed to proceed at a rate 4 times faster (∼85 s−1) (Fig. 4). As the fluorescence signal detected here depends exquisitely on the presence of the aminoacyl moiety and the nature of the γ-phosphate of the GTP nucleotide, this conformational change likely reports on the ordering of S1, S2, and P loop elements in the G domain of EF-Tu, the structural scaffold of the nucleotide binding pocket (Fig. 1, A and B).
A trivial explanation for the observed disparity in rates would be that EF-Ts drives ternary complex formation by accelerating nucleotide loading (Reactions 1 and 2). However, in this case, the apparent rates of ternary complex formation would eventually plateau at the same maximum value (∼85 s−1). Instead, two distinct maximum rates were observed. Moreover, these experiments were performed following preincubation of EF-Tu and the EF-Tu·EF-Ts complex with saturating concentrations of GTP (1 mm). We conclude that EF-Ts directly facilitates ternary complex formation by accelerating EF-Tu·GTP loading onto aa-tRNA. Indeed, direct interactions between EF-Ts and ternary complex have been suggested previously (18, 64, 65). Such insights suggest that the established model of ternary complex formation (Reactions 1–3 above) needs revision. Thus, although the direct binding of EF-Tu·GTP to aa-tRNA is feasible (Reaction 3) (17, 19, 20, 22, 66–68), our findings suggest that the kinetically favored pathway for ternary complex formation proceeds via the direct binding of an EF-Tu·GTP·EF-Ts complex to aa-tRNA (Fig. 7).
FIGURE 7.

Ternary complex formation and disassembly can occur via two distinct pathways. In both pathways, the binary complex EF-Tu·EF-Ts binds GTP, forming an EF-Tu·GTP·EF-Ts complex. In Path 1, this species directly binds aa-tRNA, forming a quaternary complex of EF-Tu·GTP·EF-Ts·aa-tRNA, which decays to the EF-Tu·GTP·aa-tRNA ternary complex following EF-Ts dissociation. In Path 2, EF-Ts dissociates from the EF-Tu·GTP·EF-Ts complex, allowing EF-Tu·GTP to bind aa-tRNA directly to form ternary complex.
Although previous investigations have shown that the EF-Tu·GTP·EF-Ts complex is labile, dissociating at a rate of 60 s−1 (28), at cellular concentrations of EF-Ts (∼10 μm) (29–31), the rate of EF-Ts rebinding to EF-Tu·GTP is estimated to be on the order of 300 s−1 (28). These considerations predict that the EF-Tu·GTP·EF-Ts complex may be relatively abundant in the cell. Based on these insights, we conclude that EF-Ts directly facilitates ternary complex formation and disassembly by lowering the effective activation barrier for a rate-determining conformational change in EF-Tu that is required for the protein to fully engage aa-tRNA and GTP ligands (Fig. 7). Our nucleotide binding studies suggest that ordering of the switch-1 helix in EF-Tu plays a critical role in this process (Fig. 1D). We speculate that EF-Ts influences the folding of the switch-1 helix in a manner that modulates this commitment step. Further experiments will be required to delineate precisely how EF-Ts impacts the reaction coordinate for ternary complex formation and disassembly.
These previously unanticipated functions of EF-Ts may provide several advantages to the cell. First, the observed capacity to increase the rate of ternary complex formation may increase the maximum rate of translation that can be achieved in the cell. Second, under steady state conditions, the capacity of EF-Ts to facilitate nucleotide turnover may allow a means of translational control under changing cellular conditions. For instance, under conditions of rapid growth where the concentration of GTP (900 μm) is in great excess over GDP (100 μm), EF-Ts ensures that ternary complex is abundant. However, during stress where the GTP/GDP ratio drops, EF-Ts may enable an energy-neutral means of lowering the cellular concentrations of ternary complex and thus the rate of translation. The inferred capacity of EF-Ts to directly act on the EF-Tu·GDP·aa-tRNA complex also has potentially important implications for the mechanism of translation. Indeed, an EF-Tu·GDP·aa-tRNA complex is formed on the ribosome during every step of the elongation cycle of protein synthesis. Therefore, during active growth, the concentration of EF-Tu·GDP·aa-tRNA approaches the concentration of ribosomes in the cell (∼10 μm). Notably, the concentrations of EF-Ts and ribosomes have been shown to exhibit a 1:1 stoichiometry over a range of cellular conditions (29–31). To our knowledge, the kinetic impact of EF-Ts on the rates and fidelities of aa-tRNA selection have yet to be explored. However, experiments performed in the absence of EF-Ts suggest that the departure of EF-Tu·GDP from the ribosome is rate-determining for the process (∼2–4 s−1) (67, 68).
The structure of the EF-Tu·GTP·EF-Ts complex is not presently known but is speculated to adopt a conformation that is distinct from EF-Tu·GTP, EF-Tu·GDP, and the EF-Tu·EF-Ts complex (28). Structural modeling suggests that an EF-Tu·GTP·EF-Ts complex would be sterically permitted to bind the acceptor stem of aa-tRNA if it adopts a conformation that is globally similar to that of the EF-Tu·EF-Ts complex (Fig. 8). Functional investigations of the Qβ replicase, an RNA-dependent RNA polymerase that contains an EF-Tu·EF-Ts complex, are consistent with this model as the template recognition in this system has been attributed to the direct binding of the EF-Tu·EF-Ts component of Qβ replicase to a primer region that contains a single-stranded 3′-CCA overhang (69). We therefore speculate that initial interactions between the EF-Tu·GTP·EF-Ts and aa-tRNA may occur in a manner akin to what is observed for Qβ replicase and more recently for archaeal translation initiation factor-2 (70) wherein domains 1 and 2 of EF-Tu bind the 3′-CCA end of aa-tRNA. Alternatively, initial interactions could occur via the direct binding of domains 2 and 3 of EF-Tu in complex with EF-Ts to the acceptor stem helix (Fig. 8). Irrespective of these considerations, we propose that the rate-determining conformational change in EF-Tu that gives rise to the high affinity ternary complex interaction is initiated with the compaction of the G domain onto domains 2 and 3 and the aa-tRNA acceptor stem. This conformational change would terminate with the formation of the interaction network linking the amino acid to the switch domains of EF-Tu and the γ-phosphate of GTP followed by the release of EF-Ts (Figs. 1 and 8).
FIGURE 8.

Hypothetical EF-Tu·GTP·EF-Ts·Phe-tRNAPhe quaternary complex. A, a top-down perspective of the EF-Tu·GTP·Phe-tRNAPhe ternary complex (Protein Data Bank code 1OB2) showing EF-Tu (blue) bound to Phe-tRNAPhe (wheat) and GDPNP (green spheres). Here, the center panel shows an extended conformation (purple) of EF-Tu as it is observed in the E. coli EF-Tu·EF-Ts crystal structure (Protein Data Bank code 1EFU) where domains 2 and 3 of both EF-Tu structures are superimposed (N, Cα, CO, O root mean square deviation is 0.886 Å). The right panel highlights the position of EF-Ts (red) in a quaternary complex if its interactions with EF-Tu are identical to those observed in the E. coli EF-Tu·EF-Ts crystal structure. This model reveals only minor steric clashes between EF-Ts and the D-stem of the tRNA. The blue arrow indicates the hypothesized motions of the G domain of EF-Tu during ternary complex formation and decay. B, identical structures as in A from the perspective of looking down the axis of the tRNA acceptor stem. Structures were analyzed and rendered in PyMOL.
In direct support of a model in which EF-Ts can physically associate with EF-Tu while it is bound to aa-tRNA, we found that EF-Ts actively dissociates ternary complex in the presence of GDP (Fig. 3, C and D). Ternary complex dissociation was inhibited by kirromycin (Fig. 3F), suggesting that the dissociation pathway likely entails reorganization of the interface of domains 1, 2, and 3 in EF-Tu prior to EF-Tu release in a manner that mirrors the association pathway.
Importantly, precedence for direct interactions between GEFs and activated G-proteins exists in signal transduction cascades involving other small G-proteins that are regulatory in nature. In yeast, the GEF Scd1 chaperones its activated G-protein, Cdc42, to its effector Shk1 via interactions with Scd2 (71). GEFs for the monomeric G-protein Ral, RalGDS and Rlf, interact with the GTP-bound state of upstream G-proteins Ras and Rap through Ras association domains (3, 72). Effector-bound conformational changes of G-proteins have also been described previously. For instance, the monomeric G-protein Ras has been shown to bind to its effector protein Raf in a two-step process termed “dynamic triggering” (59). NMR studies have revealed that switch-1 of Ras-GDPNP is dynamic, exhibiting at least two conformations in the Raf-bound state (59, 61). Thus, the findings presented here likely reflect a more general capacity of GEFs to facilitate G-protein loading onto their effector substrates. In addition to accelerating signaling processes, such interactions may also serve to influence the choice of downstream effectors. Future experiments testing these hypotheses are warranted and will need to be explored using approaches that are amenable to probing the complexity and range of dynamics that are likely to be found.
Acknowledgments
We thank Dr. Olke Uhlenbeck for critical review of the manuscript, Dr. Allan Hall and Doug Wheeler for informative discussions regarding G-protein biology, and all members of the Blanchard laboratory for insightful comments and discussions.
This work was supported, in whole or in part, by National Institutes of Health Grants GM079238 and MH099491. This work was also supported by National Science Foundation Faculty Early Career Development Award MCB-0747230.
- GTPase
- GTP-hydrolyzing protein
- EF
- elongation factor
- aa-tRNA
- aminoacyl-transfer RNA
- GEF
- guanosine nucleotide exchange factor
- GTPγS
- guanosine 5′-(γ-thio)triphosphate
- GDPNP
- guanosine 5′-(β,γ-imido)triphosphate
- mant-GTP
- 2′/3′-O-(N-methylanthraniloyl)guanosine 5′-triphosphate
- S1
- switch-1
- S2
- switch-2
- acp3U
- 3-(3-amino-3-carboxypropyl)uridine
- s4U
- 4-thiouridine.
REFERENCES
- 1. Bourne H. R., Sanders D. A., McCormick F. (1991) The GTPase superfamily conserved structure and molecular mechanism. Nature 349, 117–127 [DOI] [PubMed] [Google Scholar]
- 2. Vetter I. R., Wittinghofer A. (2001) The guanine nucleotide-binding switch in three dimensions. Science 294, 1299–1304 [DOI] [PubMed] [Google Scholar]
- 3. Bos J. L., Rehmann H., Wittinghofer A. (2007) GEFs and GAPs: critical elements in the control of small G proteins. Cell 129, 865–877 [DOI] [PubMed] [Google Scholar]
- 4. Wittinghofer A., Vetter I. R. (2011) Structure-function relationships of the G domain, a canonical switch motif. Annu. Rev. Biochem. 80, 943–971 [DOI] [PubMed] [Google Scholar]
- 5. Thomposon R. C., Dix D. B. (1982) Accuracy of protein biosynthesis. A kinetic study of the reaction of poly(U)-programmed ribosomes with a leucyl-tRNA2-elongation factor Tu-GTP complex. J. Biol. Chem. 257, 6677–6682 [PubMed] [Google Scholar]
- 6. Hopfield J. J., Yamane T., Yue V., Coutts S. M. (1976) Direct experimental evidence for kinetic proofreading in amino acylation of tRNAIle. Proc. Natl. Acad. Sci. U.S.A. 73, 1164–1168 [DOI] [PMC free article] [PubMed] [Google Scholar]
- 7. Rodnina M. V., Pape T., Fricke R., Wintermeyer W. (1995) Elongation factor Tu, a GTPase triggered by codon recognition on the ribosome: mechanism and GTP consumption. Biochem. Cell Biol. 73, 1221–1227 [DOI] [PubMed] [Google Scholar]
- 8. Rodnina M. V., Savelsbergh A., Wintermeyer W. (1999) Dynamics of translation on the ribosome: molecular mechanics of translocation. FEMS Microbiol. Rev. 23, 317–333 [DOI] [PubMed] [Google Scholar]
- 9. Geggier P., Dave R., Feldman M. B., Terry D. S., Altman R. B., Munro J. B., Blanchard S. C. (2010) Conformational sampling of aminoacyl-tRNA during selection on the bacterial ribosome. J. Mol. Biol. 399, 576–595 [DOI] [PMC free article] [PubMed] [Google Scholar]
- 10. Nissen P., Kjeldgaard M., Thirup S., Polekhina G., Reshetnikova L., Clark B. F., Nyborg J. (1995) Crystal structure of the ternary complex of Phe-tRNAPhe, EF-Tu, and a GTP analog. Science 270, 1464–1472 [DOI] [PubMed] [Google Scholar]
- 11. Nissen P., Kjeldgaard M., Thirup S., Clark B. F., Nyborg J. (1996) The ternary complex of aminoacylated tRNA and EF-Tu-GTP. Recognition of a bond and a fold. Biochimie 78, 921–933 [DOI] [PubMed] [Google Scholar]
- 12. Abel K., Yoder M. D., Hilgenfeld R., Jurnak F. (1996) An α to β conformational switch in EF-Tu. Structure 4, 1153–1159 [DOI] [PubMed] [Google Scholar]
- 13. Polekhina G., Thirup S., Kjeldgaard M., Nissen P., Lippmann C., Nyborg J. (1996) Helix unwinding in the effector region of elongation factor EF-Tu-GDP. Structure 4, 1141–1151 [DOI] [PubMed] [Google Scholar]
- 14. Kawashima T., Berthet-Colominas C., Wulff M., Cusack S., Leberman R. (1996) The structure of the Escherichia coli EF-Tu·EF-Ts complex at 2.5 Å resolution. Nature 379, 511–518 [DOI] [PubMed] [Google Scholar]
- 15. Voorhees R. M., Schmeing T. M., Kelley A. C., Ramakrishnan V. (2010) The mechanism for activation of GTP hydrolysis on the ribosome. Science 330, 835–838 [DOI] [PMC free article] [PubMed] [Google Scholar]
- 16. Abrahamson J. K., Laue T. M., Miller D. L., Johnson A. E. (1985) Direct determination of the association constant between elongation factor Tu × GTP and aminoacyl-tRNA using fluorescence. Biochemistry 24, 692–700 [DOI] [PubMed] [Google Scholar]
- 17. Louie A., Jurnak F. (1985) Kinetic studies of Escherichia coli elongation factor Tu-guanosine 5′-triphosphate-aminoacyl-tRNA complexes. Biochemistry 24, 6433–6439 [DOI] [PubMed] [Google Scholar]
- 18. Romero G., Chau V., Biltonen R. L. (1985) Kinetics and thermodynamics of the interaction of elongation factor Tu with Ts. J. Biol. Chem. 260, 6167–6174 [PubMed] [Google Scholar]
- 19. Delaria K., Guillen M., Louie A., Jurnak F. (1991) Stabilization of the Escherichia coli elongation factor Tu-GTP-aminoacyl-tRNA complex. Arch. Biochem. Biophys. 286, 207–211 [DOI] [PubMed] [Google Scholar]
- 20. Chapman S. J., Schrader J. M., Uhlenbeck O. C. (2012) Histidine 66 in Escherichia coli elongation factor Tu selectively stabilizes aminoacyl-tRNAs. J. Biol. Chem. 287, 1229–1234 [DOI] [PMC free article] [PubMed] [Google Scholar]
- 21. Kristensen O., Reshetnikova L., Nissen P., Siboska G., Thirup S., Nyborg J. (1996) Isolation, crystallization and x-ray analysis of the quaternary complex of Phe-tRNA(Phe), EF-Tu, a GTP analog and kirromycin. FEBS Lett. 399, 59–62 [DOI] [PubMed] [Google Scholar]
- 22. Dale T., Sanderson L. E., Uhlenbeck O. C. (2004) The affinity of elongation factor Tu for an aminoacyl-tRNA is modulated by the esterified amino acid. Biochemistry 43, 6159–6166 [DOI] [PubMed] [Google Scholar]
- 23. Pingoud A., Urbanke C., Krauss G., Peters F., Maass G. (1977) Ternary complex formation between elongation factor Tu, GTP and aminoacyl-tRNA: an equilibrium study. Eur. J. Biochem. 78, 403–409 [DOI] [PubMed] [Google Scholar]
- 24. Cai Y. C., Bullard J. M., Thompson N. L., Spremulli L. L. (2000) Interaction of mitochondrial elongation factor Tu with aminoacyl-tRNA and elongation factor Ts. J. Biol. Chem. 275, 20308–20314 [DOI] [PubMed] [Google Scholar]
- 25. Watson B. S., Hazlett T. L., Eccleston J. F., Davis C., Jameson D. M., Johnson A. E. (1995) Macromolecular arrangement in the aminoacyl-tRNA·elongation factor Tu·GTP ternary complex. A fluorescence energy transfer study. Biochemistry 34, 7904–7912 [DOI] [PubMed] [Google Scholar]
- 26. Janiak F., Dell V. A., Abrahamson J. K., Watson B. S., Miller D. L., Johnson A. E. (1990) Fluorescence characterization of the interaction of various transfer RNA species with elongation factor Tu·GTP: evidence for a new functional role for elongation factor Tu in protein biosynthesis. Biochemistry 29, 4268–4277 [DOI] [PubMed] [Google Scholar]
- 27. Hazlett T. L., Johnson A. E., Jameson D. M. (1989) Time-resolved fluorescence studies on the ternary complex formed between bacterial elongation factor Tu, guanosine 5′-triphosphate, and phenylalanyl-tRNAPhe. Biochemistry 28, 4109–4117 [DOI] [PubMed] [Google Scholar]
- 28. Gromadski K. B., Wieden H. J., Rodnina M. V. (2002) Kinetic mechanism of elongation factor Ts-catalyzed nucleotide exchange in elongation factor Tu. Biochemistry 41, 162–169 [DOI] [PubMed] [Google Scholar]
- 29. Miyajima A., Kaziro Y. (1978) Coordination of levels of elongation factors Tu, Ts, and G, and ribosomal protein S1 in Escherichia coli. J. Biochem. 83, 453–462 [DOI] [PubMed] [Google Scholar]
- 30. Pedersen S., Bloch P. L., Reeh S., Neidhardt F. C. (1978) Patterns of protein synthesis in E. coli: a catalog of the amount of 140 individual proteins at different growth rates. Cell 14, 179–190 [DOI] [PubMed] [Google Scholar]
- 31. Bremer H., Dennis P. P. (1987) in Escherichia coli and Salmonella typhimurium (Ingraham J. L., Low K. B., Magasanik B., Schaechter M., Umbarger H. E., eds) pp. 1527–1542, American Society for Microbiology, Washington, D. C [Google Scholar]
- 32. Ji Y., Zhang B., Van Horn S. F., Warren P., Woodnutt G., Burnham M. K., Rosenberg M. (2001) Identification of critical staphylococcal genes using conditional phenotypes generated by antisense RNA. Science 293, 2266–2269 [DOI] [PubMed] [Google Scholar]
- 33. Forsyth R. A., Haselbeck R. J., Ohlsen K. L., Yamamoto R. T., Xu H., Trawick J. D., Wall D., Wang L., Brown-Driver V., Froelich J. M., Kedar G. C., King P., McCarthy M., Malone C., Misiner B., Robbins D., Tan Z., Zhu Z.-y., Carr G., Mosca D. A., Zamudio C., Foulkes J. G., Zyskind J. W. (2002) A genome-wide strategy for the identification of essential genes in Staphylococcus aureus. Mol. Microbiol. 43, 1387–1400 [DOI] [PubMed] [Google Scholar]
- 34. Young T. S., Walsh C. T. (2011) Identification of the thiazolyl peptide GE37468 gene cluster from Streptomyces ATCC 55365 and heterologous expression in Streptomyces lividans. Proc. Natl. Acad. Sci. U.S.A. 108, 13053–13058 [DOI] [PMC free article] [PubMed] [Google Scholar]
- 35. Parmeggiani A., Nissen P. (2006) Elongation factor Tu-targeted antibiotics: four different structures, two mechanisms of action. FEBS Lett. 580, 4576–4581 [DOI] [PubMed] [Google Scholar]
- 36. Parmeggiani A., Krab I. M., Okamura S., Nielsen R. C., Nyborg J., Nissen P. (2006) Structural basis of the action of pulvomycin and GE2270 A on elongation factor Tu. Biochemistry 45, 6846–6857 [DOI] [PubMed] [Google Scholar]
- 37. Spahn C. M., Prescott C. D. (1996) Throwing a spanner in the works: antibiotics and the translation apparatus. J. Mol. Med. 74, 423–439 [DOI] [PubMed] [Google Scholar]
- 38. Gonzalez R. L., Jr., Chu S., Puglisi J. D. (2007) Thiostrepton inhibition of tRNA delivery to the ribosome. RNA 13, 2091–2097 [DOI] [PMC free article] [PubMed] [Google Scholar]
- 39. Rodnina M. V., Fricke R., Kuhn L., Wintermeyer W. (1995) Codon-dependent conformational change of elongation factor Tu preceding GTP hydrolysis on the ribosome. EMBO J. 14, 2613–2619 [DOI] [PMC free article] [PubMed] [Google Scholar]
- 40. Kothe U., Rodnina M. V. (2006) Delayed release of inorganic phosphate from elongation factor Tu following GTP hydrolysis on the ribosome. Biochemistry 45, 12767–12774 [DOI] [PubMed] [Google Scholar]
- 41. Vogeley L., Palm G. J., Mesters J. R., Hilgenfeld R. (2001) Conformational change of elongation factor Tu (EF-Tu) induced by antibiotic binding. Crystal structure of the complex between EF-Tu.GDP and aurodox. J. Biol. Chem. 276, 17149–17155 [DOI] [PubMed] [Google Scholar]
- 42. Rodnina M. V., Gromadski K. B., Kothe U., Wieden H. J. (2005) Recognition and selection of tRNA in translation. FEBS Lett. 579, 938–942 [DOI] [PubMed] [Google Scholar]
- 43. Blanchard S. C., Kim H. D., Gonzalez R. L., Jr., Puglisi J. D., Chu S. (2004) tRNA dynamics on the ribosome during translation. Proc. Natl. Acad. Sci. U.S.A. 101, 12893–12898 [DOI] [PMC free article] [PubMed] [Google Scholar]
- 44. Dunkle J. A., Wang L., Feldman M. B., Pulk A., Chen V. B., Kapral G. J., Noeske J., Richardson J. S., Blanchard S. C., Cate J. H. (2011) Structures of the bacterial ribosome in classical and hybrid states of tRNA binding. Science 332, 981–984 [DOI] [PMC free article] [PubMed] [Google Scholar]
- 45. Plumbridge J. A., H. G., Ehrenberg M., Rigler R. (1980) Characterisation of a new, fully active fluorescent derivative of E. coli tRNA Phe. Nucleic Acids Res. 8, 827–843 [PMC free article] [PubMed] [Google Scholar]
- 46. Blanchard S. C., Gonzalez R. L., Kim H. D., Chu S., Puglisi J. D. (2004) tRNA selection and kinetic proofreading in translation. Nat. Struct. Mol. Biol. 11, 1008–1014 [DOI] [PubMed] [Google Scholar]
- 47. Fersht A. (1985) Enzyme Structure and Mechanism, 2 Ed., W. H. Freeman and Co., New York [Google Scholar]
- 48. Savitzky A., Golay M. J. E. (1964) Smoothing and differentiation of data by simplified least squares procedures. Anal. Chem. 36, 1627–1639 [Google Scholar]
- 49. Miller D. L., Weissbach H. (1970) Interactions between the elongation factors: the displacement of GPD from the TU-GDP complex by factor Ts. Biochem. Biophys. Res. Commun. 38, 1016–1022 [DOI] [PubMed] [Google Scholar]
- 50. Weaver R. F. (2007) Molecular Biology, 4 Ed., McGraw-Hill, New York [Google Scholar]
- 51. Dahl L. D., Wieden H. J., Rodnina M. V., Knudsen C. R. (2006) The importance of P-loop and domain movements in EF-Tu for guanine nucleotide exchange. J. Biol. Chem. 281, 21139–21146 [DOI] [PubMed] [Google Scholar]
- 52. Wieden H. J., Mercier E., Gray J., Steed B., Yawney D. (2010) A combined molecular dynamics and rapid kinetics approach to identify conserved three-dimensional communication networks in elongation factor Tu. Biophys. J. 99, 3735–3743 [DOI] [PMC free article] [PubMed] [Google Scholar]
- 53. Levitus M., Ranjit S. (2011) Cyanine dyes in biophysical research: the photophysics of polymethine fluorescent dyes in biomolecular environments. Q. Rev. Biophys. 44, 123–151 [DOI] [PubMed] [Google Scholar]
- 54. Munro J. B., Wasserman M. R., Altman R. B., Wang L., Blanchard S. C. (2010) Correlated conformational events in EF-G and the ribosome regulate translocation. Nat. Struct. Mol. Biol. 17, 1470–1477 [DOI] [PMC free article] [PubMed] [Google Scholar]
- 55. Ott G., Faulhammer H. G., Sprinzl M. (1989) Interaction of elongation factor Tu from Escherichia coli with aminoacyl-tRNA carrying a fluorescent reporter group on the 3 terminus. Eur. J. Biochem. 184, 345–352 [DOI] [PubMed] [Google Scholar]
- 56. Sanderson L. E., Uhlenbeck O. C. (2007) Directed mutagenesis identifies amino acid residues involved in elongation factor Tu binding to yeast Phe-tRNAPhe. J. Mol. Biol. 368, 119–130 [DOI] [PMC free article] [PubMed] [Google Scholar]
- 57. Goodrich J. A., Kugel J. F. (2007) Binding and Kinetics for Molecular Biologists, Cold Spring Harbor Laboratory Press, Cold Spring Harbor, NY [Google Scholar]
- 58. Altman R. B., Terry D. S., Zhou Z., Zheng Q., Geggier P., Kolster R. A., Zhao Y., Javitch J. A., Warren J. D., Blanchard S. C. (2012) Cyanine fluorophore derivatives with enhanced photostability. Nat. Methods 9, 68–71 [DOI] [PMC free article] [PubMed] [Google Scholar]
- 59. Stumber M., Geyer M., Graf R., Kalbitzer H. R., Scheffzek K., Haeberlen U. (2002) Observation of slow dynamic exchange processes in Ras protein crystals by 31P solid state NMR spectroscopy. J. Mol. Biol. 323, 899–907 [DOI] [PubMed] [Google Scholar]
- 60. Podkowinski J., Dymarek-Babs T., Gornicki P. (1989) Modified tRNAs for probing tRNA binding sites on the ribosome. Acta Biochim. Pol. 36, 235–244 [PubMed] [Google Scholar]
- 61. Spoerner M., Herrmann C., Vetter I. R., Kalbitzer H. R., Wittinghofer A. (2001) Dynamic properties of the Ras switch I region and its importance for binding to effectors. Proc. Natl. Acad. Sci. U.S.A. 98, 4944–4949 [DOI] [PMC free article] [PubMed] [Google Scholar]
- 62. Weissbach H., Miller D. L., Hachmann J. (1970) Studies on the role of factor Ts in polypeptide synthesis. Arch. Biochem. Biophys. 137, 262–269 [DOI] [PubMed] [Google Scholar]
- 63. Gromadski K. B., Schümmer T., Strømgaard A., Knudsen C. R., Kinzy T. G., Rodnina M. V. (2007) Kinetics of the interactions between yeast elongation factors 1A and 1Bα, guanine nucleotides, and aminoacyl-tRNA. J. Biol. Chem. 282, 35629–35637 [DOI] [PMC free article] [PubMed] [Google Scholar]
- 64. Schwartzbach C. J., Spremulli L. L. (1991) Interaction of animal mitochondrial EF-Tu·EF-Ts with aminoacyl-tRNA, guanine nucleotides, and ribosomes. J. Biol. Chem. 266, 16324–16330 [PubMed] [Google Scholar]
- 65. Bubunenko M. G., Kireeva M. L., Gudkov A. T. (1992) Novel data on interactions of elongation factor Ts. Biochimie 74, 419–425 [DOI] [PubMed] [Google Scholar]
- 66. Weissbach H., Redfield B., Yamasaki E., Davis R. C., Jr., Pestka S., Brot N. (1972) Studies on the ribosomal sites involved in factors Tu and G-dependent reactions. Arch. Biochem. Biophys. 149, 110–117 [DOI] [PubMed] [Google Scholar]
- 67. Pape T., Wintermeyer W., Rodnina M. V. (1998) Complete kinetic mechanism of elongation factor Tu-dependent binding of aminoacyl-tRNA to the A site of the E. coli ribosome. EMBO J. 17, 7490–7497 [DOI] [PMC free article] [PubMed] [Google Scholar]
- 68. Pape T., Wintermeyer W., Rodnina M. (1999) Induced fit in initial selection and proofreading of aminoacyl-tRNA on the ribosome. EMBO J. 18, 3800–3807 [DOI] [PMC free article] [PubMed] [Google Scholar]
- 69. Takeshita D., Tomita K. (2012) Molecular basis for RNA polymerization by Qβ replicase. Nat. Struct. Mol. Biol. 19, 229–237 [DOI] [PubMed] [Google Scholar]
- 70. Schmitt E., Panvert M., Lazennec-Schurdevin C., Coureux P. D., Perez J., Thompson A., Mechulam Y. (2012) Structure of the ternary initiation complex aIF2-GDPNP-methionylated initiator tRNA. Nat. Struct. Mol. Biol. 19, 450–454 [DOI] [PubMed] [Google Scholar]
- 71. Endo M., Shirouzu M., Yokoyama S. (2003) The Cdc42 binding and scaffolding activities of the fission yeast adaptor protein Scd2. J. Biol. Chem. 278, 843–852 [DOI] [PubMed] [Google Scholar]
- 72. Urano T., Emkey R., Feig L. A. (1996) Ral-GTPases mediate a distinct downstream signaling pathway from Ras that facilitates cellular transformation. EMBO J. 15, 810–816 [PMC free article] [PubMed] [Google Scholar]
- 73. Leipe D. D., Wolf Y. I., Koonin E. V., Aravind L. (2002) Classification and evolution of P-loop GTPases and related ATPases. J. Mol. Biol. 317, 41–72 [DOI] [PubMed] [Google Scholar]