Abstract
Vegetables, especially white potatoes, provide significant levels of key nutrients of concern, such as potassium and dietary fiber. Per capita availability (PCA) data for vegetables—often used as a proxy for vegetable consumption—show that vegetable consumption, including consumption of white potatoes, declined in the past decade. Using dietary data for participants in the NHANES 2009–2010, we examined total vegetable, white potato, and French-fried potato consumption among all age-gender groups as well as mean energy, potassium, and dietary fiber intakes. Mean total energy intake for the US population (≥2 y old) was 2080 kcal/d, with white potatoes and French-fried potatoes providing ∼4% and ∼2% of total energy, respectively. Individuals who consumed white potatoes had significantly higher total vegetable and potassium intakes than did nonconsumers. In addition, the proportion of potassium and dietary fiber contributed by white potatoes was higher than the proportion that they contributed to total energy. Among white potato consumers aged 14–18 y, white potatoes provided ∼23% of dietary fiber and ∼20% of potassium but only ∼11% of total energy in the diet. The nutrient-dense white potato may be an effective way to increase total vegetable consumption and potassium and dietary fiber intake.
Introduction
Trends in vegetable per capita availability and consumption
Despite recommendations to increase vegetable consumption, data from the USDA Economic Research Service (ERS)3 show that per capita availability (PCA) of vegetables, a proxy for vegetable consumption, declined steadily over the past decade (1). Declines in PCA were most severe among all white potato categories. The fresh and processed vegetable category contributed <5% of total energy, 0.5% of total fat, and 29% of sodium but also contributed ∼50% of vitamin C; ∼25% of vitamin A, potassium, and dietary fiber; and ≥10% of folate, magnesium, iron, and copper to the food supply. In addition to supplying 2.4% of total energy, 0.1% of total fat, 7% of dietary fiber, and 3% of sodium, white potatoes alone contributed 16% of vitamin C, 10% of vitamin B-6, and 12% of potassium to the food supply. The white potato is also a source (≥2%) of the following nutrients: protein, thiamin, niacin, phosphorus, magnesium, iron, zinc, and copper. Therefore, the decline in vegetable and white potato PCA could have negative implications for the intake of many nutrients, particularly the key nutrients of concern: potassium and dietary fiber.
PCA data are only a proxy for actual consumption. Nevertheless, consumption data, such as those collected by the Behavioral Risk Factor Surveillance System and the NHANES, confirm these disappointing trends in vegetable intake. Blanck et al. (2) assessed frequency of fruit and vegetable consumption in 7 surveys from 1994 to 2005 and found that the frequency of fruit and vegetable consumption declined by 0.22 times/d. The decrease in vegetable consumption was due to declines in nonfried potato consumption among adult men and women, and consumption of all other vegetables also declined among men. The prevalence of consuming fruit, vegetables, or both 5 times/d did not change during that time period.
NHANES estimates the serving sizes of foods eaten and the intake of components in food combinations. With the use of NHANES II (1976–1980), Patterson et al. (3) found that 27 and 29% of US adults met the guidelines for vegetable and fruit consumption, respectively, but only 9% of adults met the recommendations to eat ≥2 servings/d of fruit and ≥3 servings/d of vegetables. Thirty years later, the CDC reported that only 26.3% of US adults consumed ≥3 vegetables/d in 2009 (4).
Most US children and adolescents also do not consume the recommended daily servings of fruit and vegetables (5, 6). From 2003 to 2004, Kimmons et al. (5) found that <6% of adolescents met the recommendations for fruit and vegetable consumption. In a small convenience sample (n = 168), Dennison et al. (7) found that young children aged 2 and 5 y consumed 0.4 and 0.6 servings of vegetables/d, respectively, excluding potatoes. Potato consumption among children aged 2 and 5 y was 0.15 and 0.2 servings/d, respectively. Over a 1-wk time period, only 3% of the 2-y-olds and 0% of the 5-y-olds met the recommendation to consume ≥3 servings of vegetables/d.
Potassium and dietary fiber: 2 nutrients of concern
The Institute of Medicine and the Dietary Guidelines for Americans have identified potassium, dietary fiber, calcium, and vitamin D as 4 nutrients of concern because most Americans do not consume sufficient amounts of these nutrients to meet their needs. Most vegetables, including white potatoes, are not good sources of calcium or vitamin D but are major sources of potassium and dietary fiber.
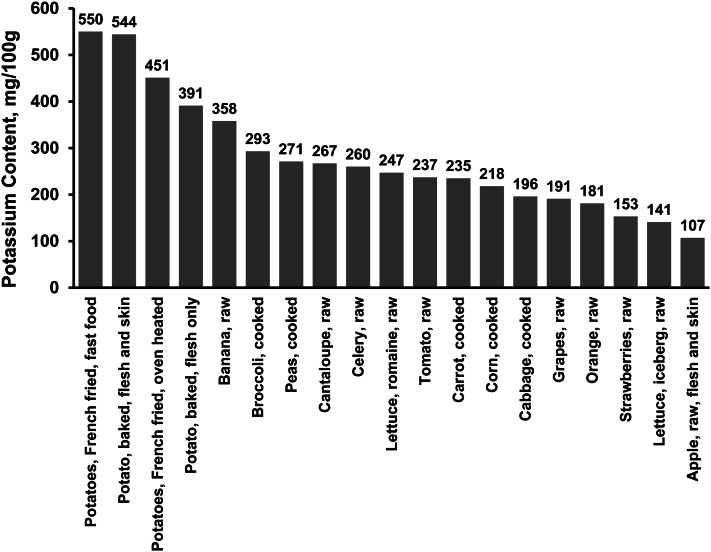
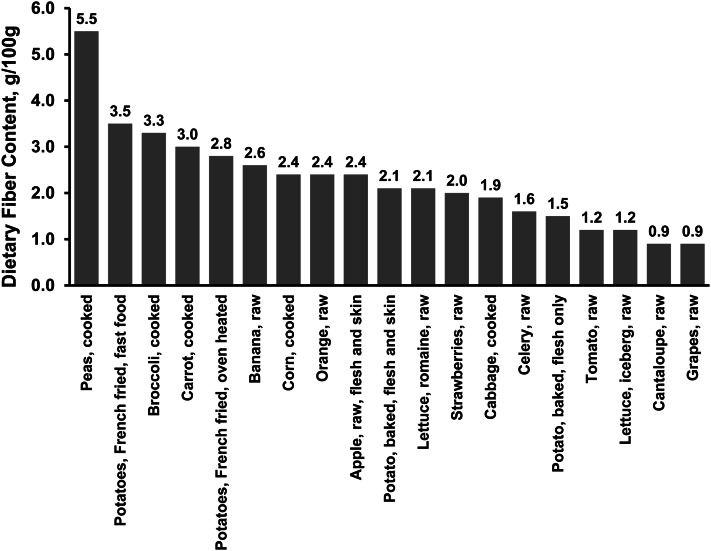
Potassium and dietary fiber are found in both the skin and flesh of the white potato (Table 1). A baked potato with skin provides 544 mg potassium and 2.1 g dietary fiber per 100 g, whereas a baked potato without skin provides 391 mg potassium and 1.5 g dietary fiber per 100 g. Vitamins C and B-6 appear to mainly be distributed in the flesh rather than in the skin of the white potato. Regardless of cooking method—baking, boiling, or frying—the white potato retains most, if not all, of its potassium and dietary fiber. On a gram per weight basis, the white potato in all of its cooked forms provides more potassium and as much dietary fiber as do other commonly consumed fruit and vegetables (Figs. 1, 2).
Table 1.
Nutrient composition of selected raw and cooked white potatoes per 100 g1
| Raw | Baked |
Boiled | French-fried |
|||
| Nutrient | Flesh and skin | Flesh and skin | Flesh only | Flesh only | Oven-heated | Fast food |
| Water, % | 81.6 | 75.4 | 75.4 | 77.5 | 61.5 | 38.6 |
| Energy, kcal | 69 | 94 | 93 | 86 | 172 | 312 |
| Potassium, mg | 407 | 544 | 391 | 328 | 451 | 579 |
| Dietary fiber, g | 2.4 | 2.1 | 1.5 | 1.8 | 2.6 | 3.8 |
| Vitamin C, mg | 9.1 | 12.6 | 12.8 | 7.4 | 13.3 | 4.7 |
| Vitamin B-6, μg | 203 | 211 | 301 | 269 | 184 | 372 |
Adapted from reference 8 with permission.
Figure 1.
Potassium content of commonly consumed fruit and vegetables. Adapted from reference 9 with permission.
Figure 2.
Dietary fiber content of commonly consumed fruit and vegetables. Adapted from reference 9 with permission.
Trends in potassium and dietary fiber intake
Low vegetable intake, especially low white potato intake, has negative consequences for achieving the Adequate Intake (AI) levels for potassium and dietary fiber. Studies show that only 2–3% of the US population had total usual intakes of potassium that met the AI (10, 11). Potassium intake also appears to be declining among Americans, which could have widespread negative consequences for blood pressure and heart health. Cogswell et al. (11) compared NHANES data from 1988 to 1994 with NHANES data from 2003 to 2008. Although remaining higher than recommended, sodium intake did not change significantly. However, adult men and women consumed 150–380 mg and 90–150 mg less potassium, respectively, during the later time period than they did in the earlier time period. Although the reason for the decline in potassium intake was unclear, the authors noted that fewer adults were consuming fluid milk, which is a good source of potassium. The researchers also speculated that a decline in the intake of potassium-containing fruit and vegetables could be another possible explanation for the decrease in potassium intake.
Like potassium, dietary fiber is a nutrient of concern because intake of this nutrient is far below recommended AI levels. Grain products, fruit, and vegetables are the major sources of dietary fiber in the US food supply. USDA/ERS data from 1970 show that vegetables were the number 1 source of dietary fiber in the food supply (32%), followed by grain products (30%), legumes/nuts/soy (14%), and fruit (13%). White potatoes provided 9% of dietary fiber in 1970 (1). More than 30 y later, grain products replaced vegetables as the number 1 source of dietary fiber in the food supply, and the contribution of dietary fiber made by white potatoes declined to 7%.
A position paper published in 2008 by the Academy of Nutrition and Dietetics (formerly the American Dietetic Association) reported that usual dietary fiber intake for adults in the United States was 15 g/d, which is well below the AI for dietary fiber for adult women (25 g/d) and men (38 g/d) (12). Analyzing data from several 2-year cycles of NHANES, King et al. (13) found no change in dietary fiber intake over a 10-y period. Much like the PCA data, the researchers discovered that grain products were the number 1 source of dietary fiber for Americans (44% of total intake). Vegetables, fruit, and dried beans/peas/other legumes provided 21, 13, and 10% of dietary fiber, respectively.
Vegetable and white potato consumption and nutrient intake
Freedman and Keast (14, 15) published 2 studies on white potato consumption using merged data from NHANES 2003–2004 and 2005–2006. White potatoes, French-fried potatoes, and oven-baked fries contributed <10% of total energy and <5% of total daily sodium intake among children and adolescents who consumed these foods, but these foods also provided ≥10% of daily intakes of vitamin B-6, potassium, and copper. Among adults (aged ≥19 y), Freedman and Keast found that ∼35% consumed white potatoes and ∼12% consumed French-fried potatoes. Potatoes provided <3% of sodium on the day that they were consumed, but they also provided ∼14–16 and ∼17% of dietary fiber and potassium intakes, respectively. French-fried potatoes contributed 14–16% of potassium and 16–20% of dietary fiber to the diet on the day that they were consumed while only providing ≤10% of total energy and ∼4% of sodium.
As previously noted, however, vegetable and white potato PCA has declined in the past decade. By using NHANES 2009–2010, we examined the consumption of vegetables and white potatoes and assessed energy intake and the intake of 2 key nutrients of concern, potassium and dietary fiber. We also analyzed nutrient contributions from white potatoes among consumers within the US population and among males and females within 8 age groups.
Methods
NHANES is a continuous, population-based survey designed to collect health and nutrition information from households in the United States. NHANES is conducted by the CDC National Center for Health Statistics, and survey data are released in 2-y cycles (16). We examined vegetable consumption, including consumption of white potatoes, among all individuals aged ≥2 y by using data from the first day of the 24-h dietary recall from NHANES 2009–2010. All food codes that included vegetables were identified by using the Food and Nutrient Database for Dietary Surveys 5.0. A total vegetable category was created along with subcategories for total white potatoes and French-fried potatoes. The total vegetable category included vegetable juice and all fresh, canned, and frozen vegetables (dark green/leafy, deep yellow, potatoes, tomatoes, lettuce, green beans, dried beans/peas, and corn). The total white potato category included all forms of the white potato, including baked, boiled, roasted, stewed, stuffed, mashed, with sauce, French-fried, hash-browned, home-fried, potato skins, and potato salad. The French-fried potato category included both oven-baked and deep-fried white potatoes. The food data were aggregated to the individual level and then merged with the demographic data. Appropriate survey weights were used to calculate mean consumption and percentiles of consumption of total vegetables, total white potatoes, and French-fried potatoes.
Males and females aged 2–4, 5–8, 9–13, 14–18, 19–30, 31–50, 51–70, and ≥71 y were included in the study. These age groups are similar to those used to determine Dietary Reference Intakes. Proxy interviews were conducted for children aged <6 y and for other individuals who could not report for themselves due to age or disability. The preferred proxy was the individual responsible for preparing the sample person’s meals (17). Children aged 6–11 y were asked to provide their own data while being assisted by an adult household member. Individuals with unreliable records, as defined by NHANES staff, were excluded from the analysis.
Mean energy, potassium, and dietary fiber intakes were calculated by using appropriate survey weights for all age-gender groups and for consumers and nonconsumers of white potatoes. Group means were estimated by using multiple regression with the constant term suppressed (equivalent to an ANOVA approach) via Stata Statistical Software, release 8.0 (18). A Taylor linearization approach was used to correct the estimated SEs for survey design effects, such as oversampling and the use of cluster sampling and strata. The statistical significance of differences between group means (P < 0.05) was calculated by using the Stata “test” procedure, which calculates the probability that any 2 estimated means are equal to one another.
NHANES 2009–2010 data were merged with the MyPyramid Equivalents Database (MPED) 2.0 for USDA Survey Foods, 2003–2004 and the Center for Nutrition Policy and Promotion (CNPP) Addendum to the MPED 2.0 in order to estimate cup equivalents of total vegetables, total white potatoes, and all other starchy vegetables (19, 20). The MyPyramid database defines 1 cup of raw, cooked, or canned vegetables; 2 cups of raw leafy green vegetables; and 0.5 cup dried vegetables as 1 cup equivalent. MPED 2.0 was developed for NHANES 2003–2004, and the CNPP Addendum was developed for NHANES 2005–2006 and 2007–2008. The CNPP Addendum reflects the most recent publicly available cup equivalent data. Codes that were added for the first time in NHANES 2009–2010 were not captured in the cup equivalent estimations.
Results
Vegetable intake
Most individuals aged ≥2 y (82% of males and 83% of females) consumed vegetables on the day of the survey (Table 2). Fewer boys (67%) and girls (73%) aged 9–13 y reported consuming vegetables compared with all other age-gender groups. The highest vegetable consumers included men (86%) and women (85%) aged 51–70 y.
Table 2.
Percentage of individuals consuming total vegetables, total white potatoes, and French-fried potatoes among all males and females, NHANES 2009–20101
| Males |
Females |
|||||||
| Age group | Sample size | Total vegetables | Total white potatoes | French-fried potatoes | Sample size | Total vegetables | Total white potatoes | French-fried potatoes |
| y | n | % | % | % | n | % | % | % |
| ≥2 | 2506 | 81.9 ± 1.1 | 30.0 ± 1.3 | 12.5 ± 1.1 | 2665 | 82.8 ± 0.9 | 26.7 ± 1.2 | 10.4 ± 0.9 |
| 2–4 | 334 | 76.5 ± 4.0 | 27.9 ± 3.4 | 21.6 ± 2.7 | 282 | 77.0 ± 3.0 | 30.4 ± 3.2 | 20.0 ± 3.4 |
| 5–8 | 357 | 81.9 ± 2.4 | 32.4 ± 3.5 | 25.4 ± 4.1 | 336 | 79.8 ± 3.1 | 25.2 ± 4.2 | 19.8 ± 4.3 |
| 9–13 | 399 | 67.0 ± 3.7 | 23.1 ± 2.1 | 15.3 ± 2.5 | 411 | 72.5 ± 3.1 | 29.4 ± 2.1 | 17.2 ± 2.9 |
| 14–18 | 387 | 78.0 ± 2.4 | 29.3 ± 2.9 | 19.6 ± 3.5 | 329 | 74.8 ± 4.3 | 27.4 ± 4.5 | 19.7 ± 4.5 |
| 19–30 | 452 | 79.0 ± 2.1 | 28.4 ± 2.6 | 15.2 ± 2.0 | 531 | 79.5 ± 2.6 | 33.4 ± 2.0 | 20.0 ± 1.5 |
| 31–50 | 844 | 81.2 ± 1.5 | 29.0 ± 2.4 | 14.6 ± 1.9 | 947 | 82.1 ± 1.5 | 25.0 ± 2.2 | 9.7 ± 1.8 |
| 51–70 | 813 | 85.7 ± 2.4 | 33.3 ± 1.4 | 10.4 ± 1.6 | 767 | 85.3 ± 2.1 | 24.7 ± 1.8 | 7.9 ± 1.5 |
| ≥71 | 397 | 78.9 ± 2.0 | 26.5 ± 2.7 | 5.3 ± 1.3 | 420 | 84.4 ± 2.2 | 25.5 ± 2.8 | 2.9 ± 0.8 |
Values are based on a single 24-h dietary recall and are presented as sample-weighted proportions ± SE using Stata, 2003 (18).
For all males and females aged ≥2 y, 30% and 27% consumed white potatoes, respectively. White potato consumption was lowest among boys aged 9–13 y (23%) and women aged 51–70 y (25%) and highest for men aged 51–70 y (33%) and women aged 19–30 y (33%). Only ∼1 of every 8 males and 1 of every 10 females aged ≥2 y consumed French-fried potatoes.
Total vegetable, total white potato, and French-fried potato intake among all individuals aged ≥2 y averaged ∼160, 36, and 11 g/d, respectively (Table 3). Individuals in the 90th percentile consumed about 389, 132, and 43 g/d of vegetables, white potatoes (∼1 small baked potato), and French-fried potatoes (∼60% of a small, 71-g serving from a fast-food restaurant), respectively. As expected, males tended to consume more total vegetables, total white potatoes, and French-fried potatoes than did females. Boys aged 5–8 y (16 g/d) and women aged 19–30 y (19 g/d) had the highest intakes of French-fried potatoes, consuming ∼25% of a small, 71-g serving from a fast-food restaurant.
Table 3.
Mean intakes of total vegetables, total white potatoes, and French-fried potatoes among all males and females, NHANES 2009–20101
| Total vegetables |
Total white potatoes |
French-fried potatoes |
||||
| Age group | Mean intake | 90th percentile | Mean intake | 90th percentile | Mean intake | 90th percentile |
| y | g/d | |||||
| All (≥2) | 160.2 ± 5.3 | 389.4 | 36.3 ± 1.1 | 132.0 | 10.5 ± 0.4 | 42.8 |
| Males | ||||||
| 2–4 | 69.1 ± 7.7 | 180.0 | 17.8 ± 2.7 | 71.4 | 10.6 ± 1.5 | 42.5 |
| 5–8 | 84.2 ± 7.7 | 187.4 | 23.5 ± 2.1 | 85.0 | 16.0 ± 2.6 | 63.8 |
| 9–13 | 87.0 ± 6.6 | 255.2 | 24.7 ± 2.0 | 103.5 | 11.0 ± 2.5 | 42.5 |
| 14–18 | 120.8 ± 8.9 | 281.1 | 37.9 ± 2.9 | 130.0 | 15.5 ± 2.5 | 74.8 |
| 19–30 | 150.3 ± 9.5 | 353.8 | 37.4 ± 4.1 | 140.9 | 14.3 ± 1.7 | 63.6 |
| 31–50 | 210.2 ± 17.2 | 460.3 | 47.1 ± 4.1 | 173.0 | 15.1 ± 2.3 | 74.8 |
| 51–70 | 221.3 ± 12.2 | 498.5 | 54.6 ± 4.8 | 190.2 | 7.4 ± 1.0 | 7.6 |
| ≥71 | 190.1 ± 9.2 | 459.4 | 38.3 ± 4.3 | 157.5 | 3.5 ± 0.8 | 0.0 |
| ≥2 | 171.8 ± 7.7 | 415.3 | 41.5 ± 1.6 | 157.5 | 12.0 ± 0.8 | 50.0 |
| Females | ||||||
| 2–4 | 72.3 ± 6.0 | 198.0 | 18.4 ± 2.5 | 72.4 | 8.7 ± 1.2 | 28.5 |
| 5–8 | 77.2 ± 6.8 | 174.5 | 16.9 ± 2.8 | 77.0 | 11.1 ± 2.4 | 44.0 |
| 9–13 | 93.3 ± 7.1 | 232.8 | 24.8 ± 2.9 | 85.0 | 9.5 ± 1.5 | 42.5 |
| 14–18 | 110.4 ± 12.8 | 253.3 | 30.0 ± 7.8 | 105.0 | 13.2 ± 2.8 | 42.8 |
| 19–30 | 135.7 ± 10.1 | 365.2 | 40.8 ± 3.0 | 130.0 | 18.5 ± 1.3 | 85.0 |
| 31–50 | 158.4 ± 7.2 | 384.3 | 30.6 ± 2.3 | 118.1 | 7.6 ± 1.5 | 0.0 |
| 51–70 | 192.8 ± 7.0 | 411.9 | 31.5 ± 3.3 | 138.0 | 5.8 ± 0.8 | 0.0 |
| ≥71 | 183.2 ± 8.7 | 424.5 | 35.0 ± 4.4 | 156.0 | 1.4 ± 0.5 | 0.0 |
| ≥2 | 149.2 ± 4.4 | 367.0 | 31.3 ± 1.3 | 127.1 | 9.1 ± 0.6 | 32.1 |
Values are based on a single 24-h dietary recall and are presented as sample-weighted means ± SE using Stata, 2003 (18).
Consuming 160 g/d of total vegetables translates into ∼1.7 cups/d (Table 4). For all age-gender groups, consumption of white potatoes and all other starchy vegetables was the equivalent of ∼0.25–0.33 cups/d and ∼0.33–0.75 cups/wk, respectively.
Table 4.
Mean intakes of total vegetables, total white potatoes, and all other starchy vegetables among all males and females, NHANES 2009–20101
| Age group | Total vegetables | Total white potatoes | All other starchy vegetables |
| y | cup equivalents/d | ||
| All (≥2) | 1.7 ± 0.05 | 0.28 ± 0.01 | 0.07 ± 0.004 |
| Males | |||
| 2–4 | 1.2 ± 0.08 | 0.31 ± 0.04 | 0.06 ± 0.06 |
| 5–8 | 1.2 ± 0.09 | 0.37 ± 0.05 | 0.07 ± 0.07 |
| 9–13 | 1.1 ± 0.08 | 0.30 ± 0.04 | 0.06 ± 0.02 |
| 14–18 | 1.3 ± 0.05 | 0.26 ± 0.03 | 0.06 ± 0.01 |
| 19–30 | 1.6 ± 0.07 | 0.27 ± 0.03 | 0.07 ± 0.02 |
| 31–50 | 1.9 ± 0.06 | 0.27 ± 0.02 | 0.05 ± 0.01 |
| 51–70 | 2.2 ± 0.10 | 0.29 ± 0.02 | 0.07 ± 0.01 |
| ≥71 | 1.7 ± 0.10 | 0.24 ± 0.02 | 0.06 ± 0.01 |
| ≥2 | 1.7 ± 0.04 | 0.28 ± 0.01 | 0.06 ± 0.004 |
| Females | |||
| 2–4 | 1.2 ± 0.10 | 0.31 ± 0.06 | 0.10 ± 0.02 |
| 5–8 | 1.3 ± 0.07 | 0.25 ± 0.04 | 0.10 ± 0.01 |
| 9–13 | 1.2 ± 0.07 | 0.28 ± 0.03 | 0.06 ± 0.01 |
| 14–18 | 1.4 ± 0.09 | 0.32 ± 0.06 | 0.03 ± 0.01 |
| 19–30 | 1.7 ± 0.09 | 0.32 ± 0.03 | 0.04 ± 0.01 |
| 31–50 | 1.8 ± 0.08 | 0.25 ± 0.02 | 0.07 ± 0.01 |
| 51–70 | 2.2 ± 0.10 | 0.27 ± 0.03 | 0.08 ± 0.01 |
| ≥71 | 1.8 ± 0.06 | 0.26 ± 0.03 | 0.10 ± 0.01 |
| ≥2 | 1.8 ± 0.05 | 0.28 ± 0.01 | 0.07 ± 0.01 |
Values are based on a single 24-h dietary recall and are presented as sample-weighted means ± SE using Stata, 2003 (18).
Energy, potassium, and dietary fiber intake
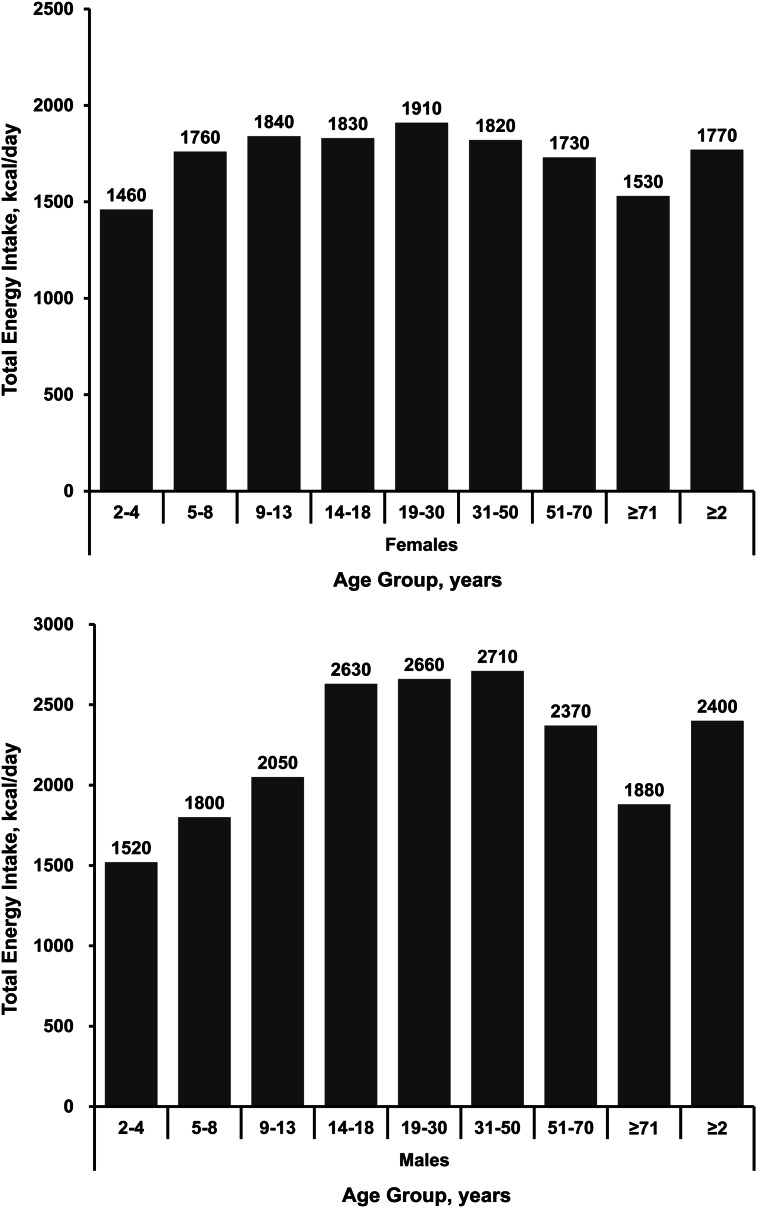
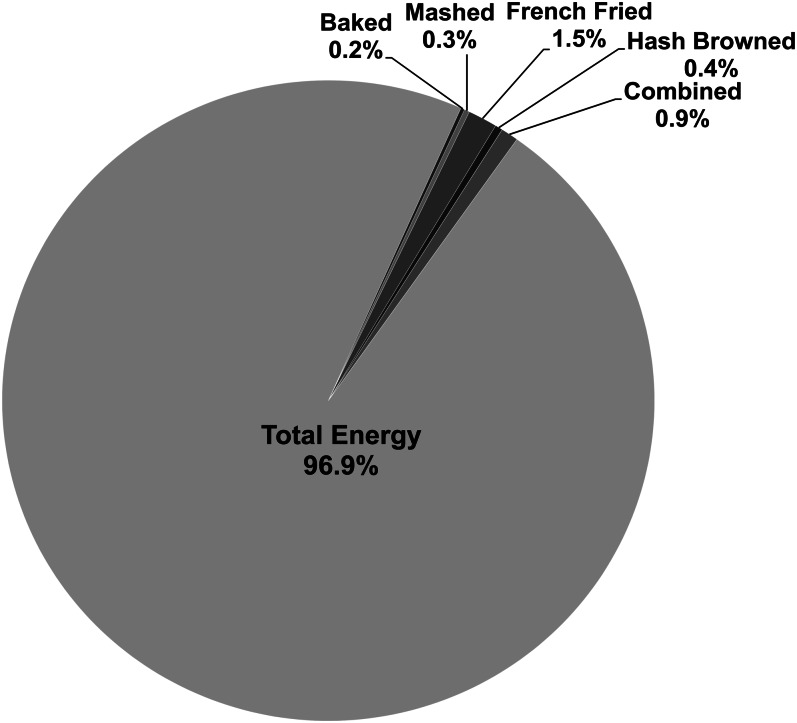
Total energy intake for all individuals aged ≥2 y was 2080 kcal/d, and males (2405 kcal/d) tended to consume more total energy than did females (1772 kcal/d) (Table 5, Fig. 3). Mean total energy intake peaked during middle age for men (31–50 y) at 2707 kcal/d, while peaking during young adulthood for women (19–30 y) at 1908 kcal/d. Energy intake from total vegetables, total white potatoes, and French-fried potatoes was 149 kcal/d (7.2%), 68 kcal/d (3.3%), and 31 kcal/d (1.5%), respectively, for all individuals aged ≥2 y (Fig. 4). For males and females aged ≥2 y in the 90th percentile of consumption, French-fried potatoes provided 134 and 118 kcal/d, respectively, which is equivalent to ≤50% of a small, 71-g serving from a fast-food restaurant.
Table 5.
Mean total energy and mean energy from consumption of total vegetables, total white potatoes, and French-fried potatoes among all males and females, NHANES 2009–20101
| Total vegetables |
Total white potatoes |
French-fried potatoes |
|||||
| Age group | Total energy | Mean intake | 90th percentile | Mean intake | 90th percentile | Mean intake | 90th percentile |
| y | kcal/d | ||||||
| All (≥2) | 2080.2 ± 12.7 | 148.6 ± 3.4 | 389 | 67.5 ± 1.9 | 264 | 31.3 ± 1.3 | 118 |
| Males | |||||||
| 2–4 | 1523.6 ± 27.9 | 84.8 ± 9.6 | 227 | 39.9 ± 5.6 | 167 | 31.1 ± 4.5 | 133 |
| 5–8 | 1803.4 ± 32.1 | 117.5 ± 10.3 | 296 | 57.0 ± 7.3 | 200 | 47.4 ± 7.7 | 200 |
| 9–13 | 2051.5 ± 42.4 | 110.1 ± 11.4 | 286 | 48.9 ± 7.1 | 198 | 33.0 ± 7.8 | 121 |
| 14–18 | 2631.8 ± 77.8 | 151.7 ± 10.8 | 418 | 72.9 ± 8.0 | 285 | 45.2 ± 7.1 | 207 |
| 19–30 | 2660.0 ± 67.0 | 162.8 ± 13.1 | 427 | 76.9 ± 8.2 | 282 | 43.0 ± 4.9 | 190 |
| 31–50 | 2707.1 ± 48.2 | 191.2 ± 11.7 | 513 | 90.3 ± 10.1 | 299 | 45.5 ± 6.9 | 207 |
| 51–70 | 2366.2 ± 39.2 | 192.1 ± 11.8 | 466 | 92.5 ± 7.9 | 307 | 21.2 ± 2.8 | 24 |
| ≥71 | 1883.9 ± 45.1 | 135.2 ± 7.0 | 336 | 51.6 ± 6.6 | 183 | 10.1 ± 2.3 | 0 |
| ≥2 | 2405.0 ± 23.1 | 164.8 ± 6.1 | 427 | 77.4 ± 3.2 | 267 | 35.6 ± 2.5 | 134 |
| Females | |||||||
| 2–4 | 1460.7 ± 27.0 | 82.7 ± 6.7 | 203 | 37.1 ± 4.5 | 133 | 25.8 ± 3.8 | 89 |
| 5–8 | 1764.7 ± 41.2 | 95.3 ± 8.8 | 272 | 41.4 ± 7.6 | 200 | 33.4 ± 7.4 | 134 |
| 9–13 | 1835.6 ± 42.1 | 105.8 ± 7.8 | 282 | 46.3 ± 4.1 | 157 | 28.7 ± 4.6 | 118 |
| 14–18 | 1826.9 ± 65.6 | 121.2 ± 14.3 | 330 | 62.2 ± 14.9 | 267 | 38.1 ± 7.7 | 133 |
| 19–30 | 1907.9 ± 45.8 | 152.5 ± 7.8 | 423 | 87.3 ± 5.4 | 301 | 56.1 ± 3.9 | 267 |
| 31–50 | 1820.3 ± 32.8 | 138.1 ± 4.9 | 356 | 57.0 ± 4.5 | 236 | 22.9 ± 4.5 | 0 |
| 51–70 | 1732.3 ± 23.9 | 142.3 ± 6.9 | 343 | 52.7 ± 5.2 | 223 | 16.6 ± 2.3 | 0 |
| ≥71 | 1527.1 ± 36.7 | 135.0 ± 8.4 | 334 | 46.9 ± 5.5 | 190 | 3.9 ± 1.3 | 0 |
| ≥2 | 1771.7 ± 9.3 | 133.3 ± 2.3 | 343 | 58.1 ± 2.3 | 239 | 27.2 ± 1.7 | 118 |
Values are based on a single 24-h dietary recall and are presented as sample-weighted means ± SE using Stata, 2003 (18).
Figure 3.
Mean total energy intake for females (top panel; n = 4544) and for males (bottom panel; n = 4503) aged ≥2 y, NHANES 2009–2010.
Figure 4.
Proportion of total energy contributed by selected white potato categories, including French-fried potatoes, for all individuals aged ≥2 y (n = 9047), NHANES 2009–2010.
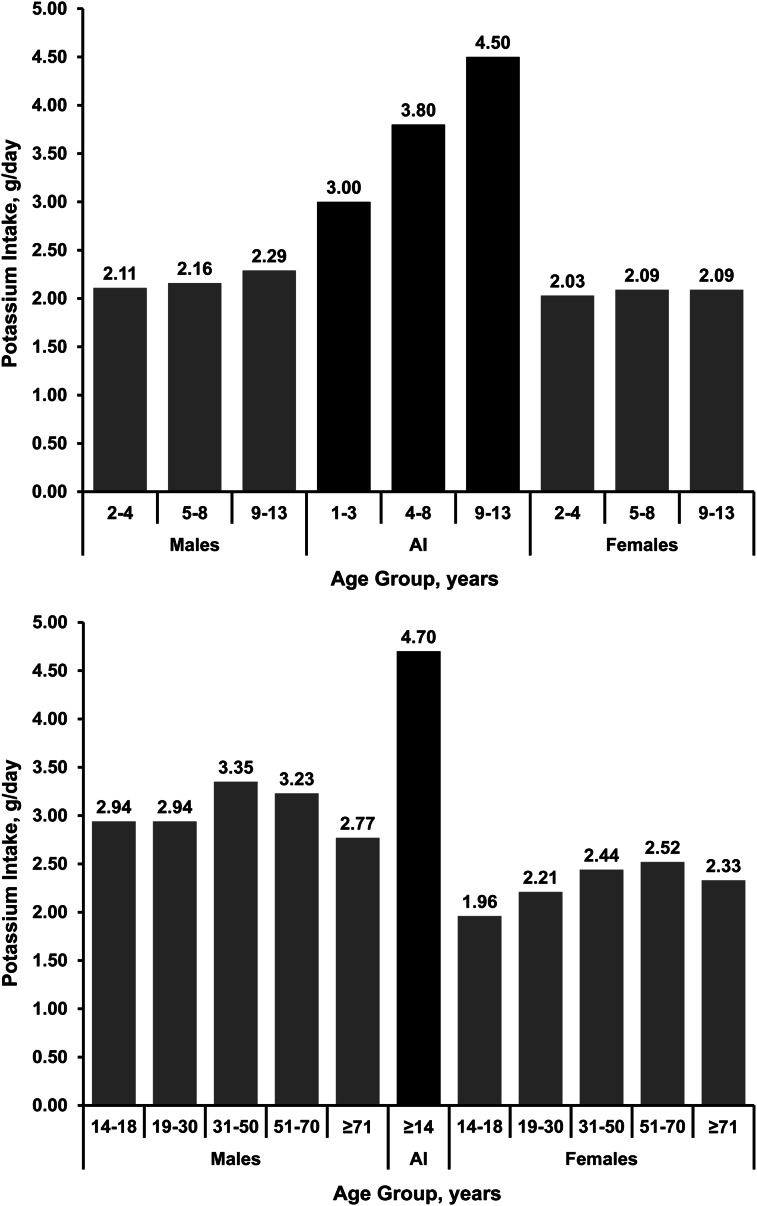
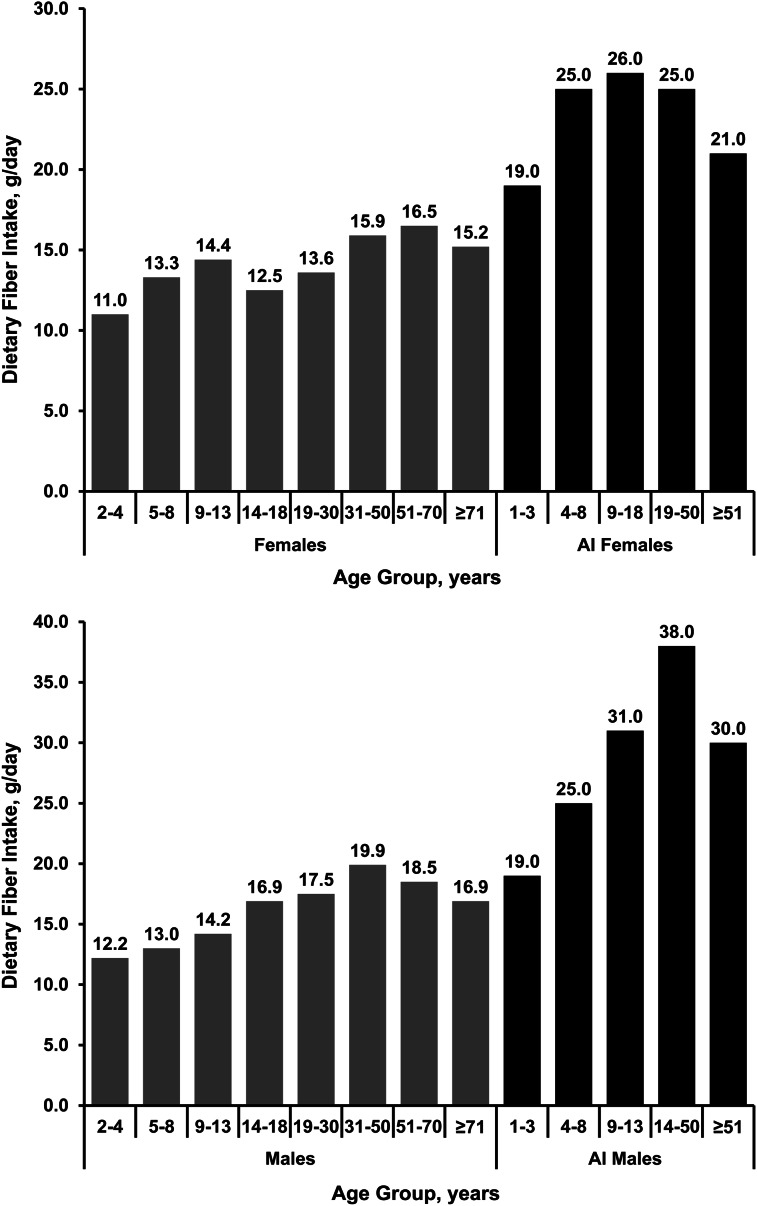
Mean intakes of potassium and dietary fiber are shown in Table 6. Mean intakes of potassium and dietary fiber among age-gender groups in relation to the AI for these nutrients are shown in Figures 5 and 6. Similar to other earlier studies, mean potassium and dietary fiber intakes were far below the AIs for all age-gender groups. For males and females, mean potassium intake ranged between 50–70% and 40–68% of AI across all age groups, respectively. Older adults are at greater risk of having high blood pressure, but mean potassium intake among men and women aged ≥51 y was well below the AI of 4700 mg/d. In addition, men aged ≥71 y consumed <60% of the AI for potassium, and women aged ≥71 y consumed only ∼50% of the AI for potassium.
Table 6.
Mean intakes of potassium and dietary fiber among all males and females, NHANES 2009–20101
| Age group | Potassium | Dietary fiber |
| y | mg/d | g/d |
| Males | ||
| 2–4 | 2108.3 ± 40.4 | 12.2 ± 0.3 |
| 5–8 | 2158.3 ± 51.1 | 13.0 ± 0.4 |
| 9–13 | 2290.8 ± 65.6 | 14.2 ± 0.4 |
| 14–18 | 2935.0 ± 122.2 | 16.9 ± 0.6 |
| 19–30 | 2936.3 ± 107.0 | 17.5 ± 0.8 |
| 31–50 | 3350.3 ± 75.1 | 19.9 ± 0.7 |
| 51–70 | 3225.1 ± 64.0 | 18.5 ± 0.6 |
| ≥71 | 2770.5 ± 79.1 | 16.9 ± 0.5 |
| ≥2 | 2977.7 ± 32.6 | 17.6 ± 0.3 |
| Females | ||
| 2–4 | 2031.8 ± 48.4 | 11.0 ± 0.4 |
| 5–8 | 2088.5 ± 49.9 | 13.3 ± 0.5 |
| 9–13 | 2086.9 ± 78.0 | 14.4 ± 0.6 |
| 14–18 | 1964.3 ± 87.4 | 12.5 ± 0.4 |
| 19–30 | 2209.8 ± 52.4 | 13.6 ± 0.4 |
| 31–50 | 2444.3 ± 42.5 | 15.9 ± 0.5 |
| 51–70 | 2523.9 ± 53.8 | 16.5 ± 0.4 |
| ≥71 | 2327.9 ± 42.1 | 15.2 ± 0.4 |
| ≥2 | 2318.8 ± 18.5 | 14.9 ± 0.2 |
Values are based on a single 24-h dietary recall and are presented as sample-weighted means ± SE using Stata, 2003 (18).
Figure 5.
Mean potassium intake relative to the AI for children and adolescents aged 2–13 y (top panel) and for adolescents and adults aged ≥14 y (bottom panel), NHANES 2009–2010. n = 9047 for all individuals aged ≥2 y. AI, Adequate Intake.
Figure 6.
Mean dietary fiber intake relative to the AI for females (top panel; n = 4544) and for males (bottom panel; n = 4503) aged ≥2 y, NHANES 2009–2010. AI, Adequate Intake.
Like potassium intake, mean dietary fiber intake was below the AI for males and females regardless of age. With few exceptions, mean dietary fiber intake was 50–65% of the AI for this nutrient. Older women aged 51–70 and ≥71y tended to consume more dietary fiber relative to the AI at 79% and 72%, respectively. Males and females aged 14–18 y consumed <50% of the AI for dietary fiber.
Nutrient intakes among white potato consumers
Among consumers of white potatoes, this vegetable contributed ≤11% of mean total energy for males and ≤13% of mean total energy for females (Table 7).
Table 7.
Percentage of total energy, potassium, and dietary fiber provided by white potatoes among all white potato consumers1
| Age group | Total energy | Potassium | Dietary fiber |
| y | %/d | ||
| Males | |||
| 2–4 | 8.6 ± 0.01 | 13.9 ± 0.01 | 17.0 ± 0.01 |
| 5–8 | 10.2 ± 0.01 | 16.3 ± 0.02 | 20.1 ± 0.02 |
| 9–13 | 10.6 ± 0.01 | 19.3 ± 0.02 | 20.2 ± 0.01 |
| 14–18 | 10.6 ± 0.01 | 18.9 ± 0.01 | 22.5 ± 0.02 |
| 19–30 | 10.6 ± 0.01 | 19.3 ± 0.01 | 22.9 ± 0.02 |
| 31–50 | 10.9 ± 0.01 | 18.8 ± 0.01 | 22.5 ± 0.01 |
| 51–70 | 11.6 ± 0.01 | 18.7 ± 0.01 | 21.3 ± 0.01 |
| ≥71 | 10.7 ± 0.00 | 18.2 ± 0.01 | 18.9 ± 0.01 |
| Females | |||
| 2–4 | 8.5 ± 0.01 | 12.9 ± 0.01 | 14.4 ± 0.01 |
| 5–8 | 10.0 ± 0.01 | 16.6 ± 0.02 | 16.5 ± 0.01 |
| 9–13 | 8.7 ± 0.01 | 16.6 ± 0.02 | 14.9 ± 0.01 |
| 14–18 | 11.4 ± 0.01 | 20.4 ± 0.01 | 23.2 ± 0.01 |
| 19–30 | 13.5 ± 0.01 | 24.9 ± 0.01 | 26.2 ± 0.03 |
| 31–50 | 11.7 ± 0.00 | 19.0 ± 0.01 | 19.6 ± 0.01 |
| 51–70 | 11.3 ± 0.00 | 18.3 ± 0.01 | 17.3 ± 0.01 |
| ≥71 | 12.0 ± 0.01 | 19.0 ± 0.01 | 16.7 ± 0.01 |
Values are based on a single 24-h dietary recall and are presented as sample-weighted proportions ± SE using Stata, 2003 (18).
However, white potatoes were significant sources of potassium and dietary fiber. White potatoes contributed >18% of potassium intake for 11 of the 16 age-gender groups and >13% of potassium for the remaining 5 age-gender groups. More than 20% of dietary fiber intake was provided by white potatoes for 6 out of 8 age groups for male consumers, and >16% of dietary fiber intake was provided by white potatoes for 6 out of 8 age groups for female consumers.
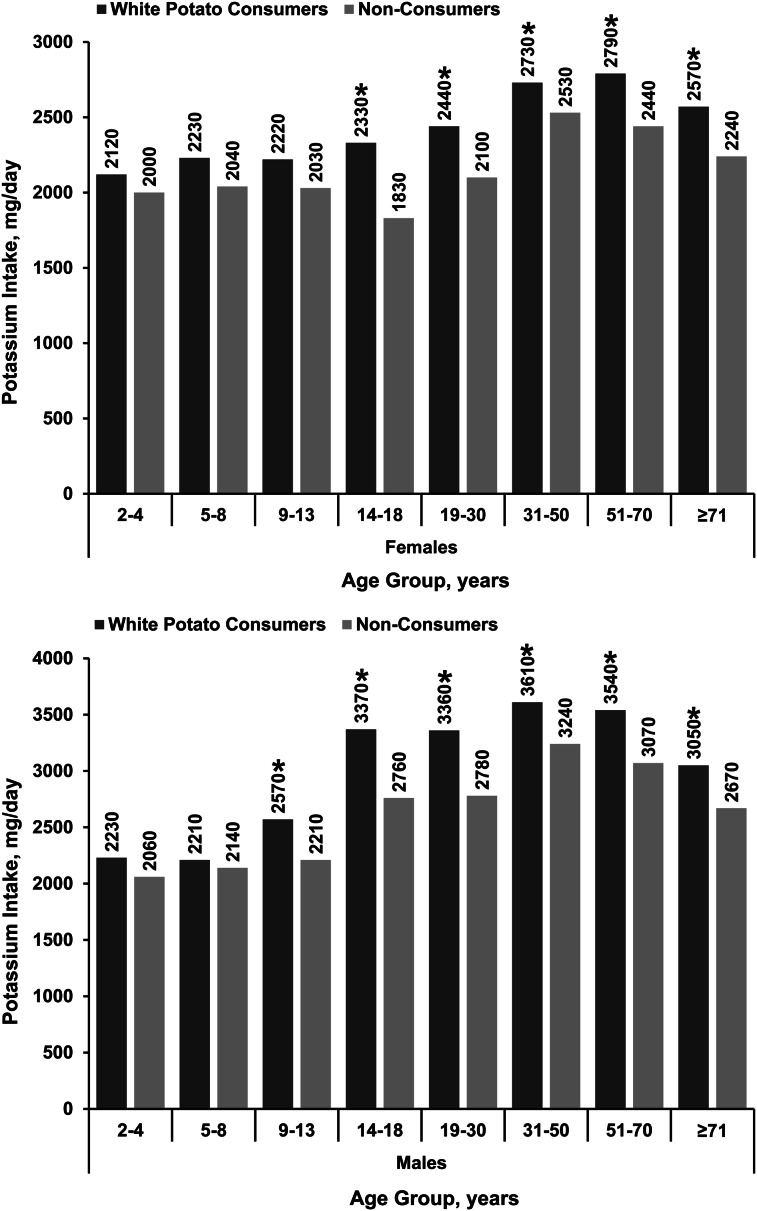
Consumers of white potatoes consumed significantly more potassium than did nonconsumers (Fig. 7). Among males aged 14–70 y, those who consumed white potatoes consumed >70% of the AI for potassium. Males aged 9–13 y and females aged ≥14 y consumed ∼50–60% of the AI for potassium when they consumed white potatoes. However, differences in dietary fiber intake between consumers and nonconsumers of white potatoes were not significant.
Figure 7.
Mean potassium intake for female white potato consumers (n = 1180) and nonconsumers (n = 3364) (top panel) and for male white potato consumers (n = 1226) and nonconsumers (n = 3277) (bottom panel) aged ≥2 y, NHANES 2009–2010. *Difference at P < 0.05.
Study limitations
NHANES is a large, nationally representative population survey that is widely used in health research. Like any data set, however, NHANES has limitations. The 24-h dietary recall used in NHANES has been extensively tested but is likely to have some measurement error for the variables used in this analysis. Food and beverage consumption may be underestimated because respondents fail to remember, or choose not to report, certain eating/drinking occasions. However, the multipass system used in NHANES is designed to minimize underreporting. Another limitation is that the data are cross-sectional. Therefore, associations cannot determine a cause-effect relationship. In addition, although the sample was stratified by age and gender, we did not control for other variables (e.g., race and ethnicity) that should be considered when developing programs and policies designed to encourage vegetable consumption.
Conclusions
Vegetables, including white potatoes, provide key micronutrients in the diet. Data from the USDA/ERS show that white potatoes contribute significant levels of potassium and dietary fiber to the food supply. Whether baked, boiled, or fried, food composition data show that white potatoes retain most, if not all, of the potassium and dietary fiber found in the raw vegetable. In addition, white potatoes provide as much dietary fiber and even more potassium than other commonly consumed fruit and vegetables on a gram per weight basis. One medium baked white potato with skin (148 g) provides 138 kcal, 792 mg of potassium, and 3.3 g of dietary fiber; and a small serving of oven-heated French-fried potatoes (70 g) provides 116 kcal, 330 mg of potassium, and 1.6 g of dietary fiber (21).
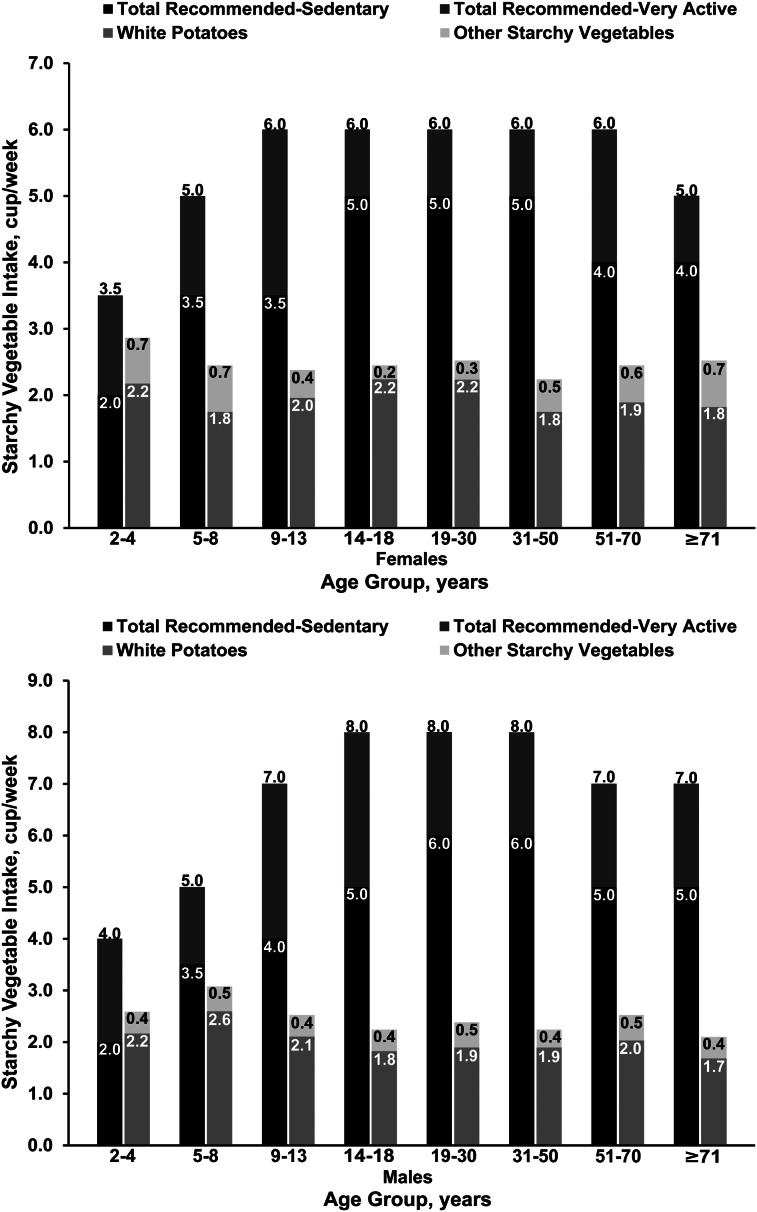
In 2010 the CDC concluded that, although a diet high in fruit and vegetables is associated with numerous positive health outcomes (22–24), children, adolescents, and adults in the United States do not consume the recommended amounts of fruit and vegetables (4). Our research using NHANES 2009–2010 confirms that vegetable consumption, including consumption of starchy vegetables such as white potatoes, is far below consumption recommendations included in the 2010 Dietary Guidelines for Americans (Fig. 8) (25). The guidelines recommend that individuals should consume 5–6 cups of starchy vegetables per week for a 2100 kcal/d diet. However, this study discovered that individuals aged ≥2 y consumed only ∼2 cups/wk of white potatoes and ∼0.5 cups/wk of other starchy vegetables, which is far less than the recommendations. Depending on age and activity level, males aged 14–18 y require 2000–3200 kcal/d to maintain caloric balance and should be consuming 5–8 cups/wk of starchy vegetables. Nevertheless, our analysis found that this age-gender group consumed <2 cups/wk of white potatoes and <0.5 cups/wk of other starchy vegetables in a 2660-kcal/d diet.
Figure 8.
Mean white potato intake and other starchy vegetable intake relative to total recommended starchy vegetable intake from the 2010 Dietary Guidelines for Americans for females (top panel; n = 4544) and for males (bottom panel; n = 4503) aged ≥2 y, NHANES 2009–2010. Total recommended starchy vegetable intake shows the minimum and maximum intake levels for sedentary and very active individuals within each age-gender group. For this analysis, 1 cup of total vegetables was approximately equivalent to 94 g. Adapted from reference 25 with permission.
Nearly all Americans fail to achieve dietary recommendations for potassium and dietary fiber intake (10–12). We found that the intake for both of these nutrients of concern continues to be well below the established AIs for all age-gender groups (26, 27). Low intakes of potassium are particularly troubling because of the role this nutrient plays in maintaining healthy blood pressure. Even though ∼67% of men and ∼80% of women aged ≥75 y have high blood pressure (28), our study found that men and women aged ≥71 y consumed only 59 and 50% of the AI for potassium, respectively.
The white potato is a particularly rich source of potassium and a good source of dietary fiber and other micronutrients. Encouraging consumption of this well-liked, affordable, and nutrient-dense vegetable may be an effective and economical way to increase total vegetable consumption as well as potassium and dietary fiber intakes among children, adolescents, and adults in the United States.
Acknowledgments
Both of the authors read and approved the final manuscript.
Footnotes
Abbreviations used: AI, Adequate Intake; CNPP, Center for Nutrition Policy and Promotion; ERS, Economic Research Service; MPED, MyPyramid Equivalents Database; PCA, per capita availability.
Literature Cited
- 1. Economic Research Service Food Availability (Per Capita) Data System [Internet]. Vegetables (all uses) data set [cited 2012 Sep 28] [about 42 p.]. Washington (DC): USDA, Economic Research Service; 2010. Available from: http://ers.usda.gov/data-products/food-availability-(per-capita)-data-system.aspx.
- 2.Blanck HM, Gillespie C, Kimmons JE, Seymour JD, Serdula MK. Trends in fruit and vegetable consumption among US men and women, 1994–2005. Prev Chronic Dis. 2008;5:A35. [PMC free article] [PubMed] [Google Scholar]
- 3.Patterson BH, Block G, Rosenberger WF, Pee D, Kahle LL. Fruit and vegetables in the American diet: data from the NHANES II survey. Am J Public Health. 1990;80:1443–9 [DOI] [PMC free article] [PubMed] [Google Scholar]
- 4.Centers for Disease Control and Prevention State-specific trends in fruit and vegetable consumption among adults: United States, 2000–2009. MMWR Morb Mortal Wkly Rep. 2010;59:1125–30 [PubMed] [Google Scholar]
- 5.Kimmons J, Gillespie C, Seymour J, Serdula M, Blanck HM. Fruit and vegetable intake among adolescents and adults in the United States: percentage meeting individualized recommendations. Medscape J Med. 2009;11:26. [PMC free article] [PubMed] [Google Scholar]
- 6.Centers for Disease Control and Prevention Fruit and vegetable consumption among high school students: United States, 2010. MMWR Morb Mortal Wkly Rep. 2011;60:1583–6 [PubMed] [Google Scholar]
- 7.Dennison BA, Rockwell HL, Baker SL. Fruit and vegetable intake in young children. J Am Coll Nutr. 1998;17:371–8 [DOI] [PubMed] [Google Scholar]
- 8. USDA National Nutrient Database for Standard Reference, Release 25 [Internet]. Washington (DC): USDA, Agricultural Research Service [cited 2012 Sep 28]. Available from: http://www.ars.usda.gov/main/site_main.htm?modecode=12–35–45–00.
- 9. USDA National Nutrient Database for Standard Reference, Release 24 [Internet]. Washington (DC): USDA, Agricultural Research Service; c2011 [cited 2012 Sep 28]. Available from: http://www.ars.usda.gov/Services/docs.htm?docid=22808.
- 10.Fulgoni VL III, Keast DR, Bailey RL, Dwyer J. Foods, fortificants, and supplements: where do Americans get their nutrients? J Nutr. 2011;141:1847–54 [DOI] [PMC free article] [PubMed] [Google Scholar]
- 11.Cogswell ME, Zhang Z, Carriquiry AL, Gunn JP, Kuklina EV, Saydah SH, Yang Q, Moshfegh AJ. Sodium and potassium intakes among US adults: NHANES 2003–2008. Am J Clin Nutr. 2012;96:647–57 [DOI] [PMC free article] [PubMed] [Google Scholar]
- 12.Slavin JL. Position of the American Dietetic Association: health implications of dietary fiber. J Am Diet Assoc. 2008;108:1716–31 [DOI] [PubMed] [Google Scholar]
- 13.King DE, Mainous AG III, Lambourne CA. Trends in dietary fiber intake in the United States, 1999–2008. J Acad Nutr Diet. 2012;112:642–8 [DOI] [PubMed] [Google Scholar]
- 14.Freedman MR, Keast DR. White potatoes, including French fries, contribute shortfall nutrients to children’s and adolescents’ diets. Nutr Res. 2011;31:270–7 [DOI] [PubMed] [Google Scholar]
- 15.Freedman MR, Keast DR. Potatoes, including French fries, contribute key nutrients to diets of US adults: NHANES 2003–2006. J Nutr Ther. 2012;1:1–11 [Google Scholar]
- 16. Centers for Disease Control and Prevention [Internet]. About the National Health and Nutrition Examination Survey [about 4 screens]. Hyattsville (MD): National Center for Health Statistics; c2012 [cited 2012 Sep 28]. Available from: http://www.cdc.gov/nchs/nhanes/about_nhanes.htm.
- 17. Centers for Disease Control and Prevention [Internet]. National Health and Nutrition Examination Survey (NHANES): MEC In-person dietary interviewers procedures manual [about 390 screens]. Hyattsville (MD): National Center for Health Statistics; c2009 [cited 2012 Sep 28]. Available from: http://www.cdc.gov/nchs/data/nhanes/nhanes_09_10/DietaryInterviewers_Inperson.pdf.
- 18.StataCorp Stata statistical software: release 8.0. College Station (TX): Stata Corporation; 2003 [Google Scholar]
- 19. MyPyramid Equivalents Database 2.0 for USDA Survey Foods, 2003–2004 [Internet]. Beltsville (MD): USDA, Agricultural Research Service, Beltsville Human Nutrition Research Center, Food Surveys Research Group; c2008 [cited 2012 Sep 28]. Available from: http://www.ars.usda.gov/Services/docs.htm?docid=17558.
- 20. Center for Nutrition Policy and Promotion Addendum to the MyPyramid Equivalents Database 2.0 [Internet]. Alexandria (VA): USDA, Center for Nutrition Policy and Promotion, Nutrition Guidance and Analysis Division; c2011 [cited 2012 Sep 28]. Available from: http://www.cnpp.usda.gov/OtherProjects.htm.
- 21. Alliance for Potato Research and Education [Internet]. The white potato: an affordable, nutrient-dense vegetable [about 9 screens]. McLean (VA): Alliance for Potato Research and Education; c2012 [cited 2012 Sep 28]. Available from: http://www.apre.org/resources/scientific-brief-1_062512.pdf.
- 22.He FJ, Nowson CA, Lucas M, MacGregor GA. Increased consumption of fruit and vegetables is related to a reduced risk of coronary heart disease: meta-analysis of cohort studies. J Hum Hypertens. 2007;21:717–28 [DOI] [PubMed] [Google Scholar]
- 23.Rolls BJ, Ello-Martin JA, Tohill BC. What can intervention studies tell us about the relationship between fruit and vegetable consumption and weight management? Nutr Rev. 2004;62:1–17 [DOI] [PubMed] [Google Scholar]
- 24.Johnston CS, Taylor CA, Hampl JS. More Americans are eating “5 a day” but intakes of dark green and cruciferous vegetables remain low. J Nutr. 2000;130:3063–7 [DOI] [PubMed] [Google Scholar]
- 25.USDA, US Department of Health and Human Services Dietary guidelines for Americans, 2010. 7th ed Washington (DC): US Government Printing Office; 2010 [DOI] [PMC free article] [PubMed] [Google Scholar]
- 26.Institute of Medicine, Food and Nutrition Board Dietary Reference Intakes for water, potassium, sodium, chloride, and sulfate. Washington (DC): The National Academies Press; 2005 [Google Scholar]
- 27.Institute of Medicine, Food and Nutrition Board Dietary Reference Intakes for energy, carbohydrate, fiber, fat, fatty acids, cholesterol, protein, and amino acids (macronutrients). Washington (DC): The National Academies Press; 2005 [Google Scholar]
- 28. Centers for Disease Control and Prevention [Internet]. High blood pressure facts [about 3 screens]. Atlanta (GA): National Center for Chronic Disease Prevention and Health Promotion, Division for Heart Disease and Stroke Prevention; c2012 [cited 2012 Sep 28]. Available from: http://www.cdc.gov/bloodpressure/facts.htm.


