

Abstract
The interaction of the myeloid restricted molecule CD200R with its widely expressed ligand CD200 is involved in the down-regulation of microglia activation. In the present study, we examined the involvement of CD200R in microglia activation in experimental ocular hypertension to determine the role of microglia activation in retinal ganglion cell (RGC) death, the key pathological event in glaucoma. Experimental glaucoma was induced in adult Brown Norway rats by sclerosis of the episcleral veins with the injection of hypertonic saline. Immunohistochemical methods were used to determine the involvement of microglia using GFAP, CD45, OX42 and OX41 and the involvement of CD200 and CD200R in the optic nerve head. Our data demonstrate the increased presence of microglia within the optic nerve head during ocular hypertension, identified by positive staining with OX42 and OX41. The peak of microglia correlates with peak in RGC death at days 20–27 (T3) post OHT induction. In addition, CD200 and CD200R positive cells were increased in ocular hypertensive eyes. Increased expression of CD200 was detected in the early phase (days 1–7; T1) of OHT and decreased over time, whilst the expression of CD200R was detected in the middle phase (days 20–27; T3) of OHT, correlating with the increase in microglia markers. Changes in the expression of CD200R/CD200 occur early in experimental glaucoma and precede the peak in microglia infiltration and RGC death, suggesting that CD200R-positive microglia play an important role in the initiation of RGC death during OHT, indicating a potential area for therapeutic intervention in treating glaucoma.
Keywords: microglia, experimental glaucoma, CD200, CD200R
1. Introduction
Retinal ganglion cell (RGC) death is a key pathological event in glaucoma and the biological basis for the loss of vision. Although significant advances have been made in the medical and surgical treatment of glaucoma, the disease remains the most common cause, worldwide, of irreversible vision loss (Quigley, 1996).
The pathological changes that are characteristic of a glaucomatous retina involve a reduction in inner retinal thickness and significant loss of RGC by apoptosis. There is persuasive evidence that the damage is initiated within the optic nerve in response to structural changes within the lamina cribrosa which are translated into cellular changes that influence RGC viability (Hernandez, 1993). While astrocytes and lamina cribrosal cells have been identified as key elements in this process, a pivotal role has also been suggested for microglia cell activation in the initiation and propagation of RGC death (Naskar et al., 2002; Yuan and Neufeld, 2001), possibly as part of the wider involvement of the immune system (Tezel and Wax, 2004).
Microglia are the resident macrophages and immune-surveillance cells of the central nervous system that are adapted to the specialised microenvironment of neural tissue (Fields and Stevens-Graham, 2002). In normal tissue, microglial are quiescent and have a stellar shape with a small nucleus and cell body with several ramified processes. In the adult rat retina, mature microglia are located in the inner plexiform and ganglion cell layer, forming a network of potential immunoeffector cells, playing a critical role in host defence against invading micro-organisms, immunoregulation and tissue repair (Chen et al., 2002). Since microglia play a key role in the defence of neural tissue, one of their most characteristic features is their rapid activation in response to a wide variety of neural injuries. When microglia are activated they markedly change their phenotype and become migratory, antigen-presenting cells that induce the expression of new proteins, cytokines, receptors and mitogens (Tambuyzer et al., 2009; reviewed Ransohoff and Perry, 2009). Furthermore, activated microglia display an altered morphology, may undergo mitosis and can become scavenging, phagocytic cells producing cytotoxic and degradative enzymes and their by-products, such as nitric oxide, which has been implicated in the neurodegenerative changes seen in glaucoma (Chao et al.,1992; Neufeld et al., 1997; Siu et al., 2002). Nitric oxide (NO) is a hydrophobic molecule generated through the oxidation of L-arginine to L-citrulline by a family of constitutive or cytokine-inducible isoenzymes, the NO synthases (NOS). Transcription of the cytokine-inducible NOS (iNOS/NOS2) results in elevated NO production, typically produced by macrophages.In human glaucomatous tissue, NOS2-positive cells were identified as astrocytes, in the nerve bundles in disorganised areas of the lamina cribosa and in proximity to blood vessels, high concentration of NO may perhaps lead to the formation of peroxynitrite in focal areas within the optic nerve head (Neufeld, 1999a). However, more recent studies using a rat model (Pang et al., 2005) or the DBA/2J mouse model (Libby et al., 2007) suggest that NOS2 is not involved in glaucomatous optic neuropathy.
Analysis of optic nerves in human glaucoma has confirmed the presence of microglia activity in regions of the optic nerve head with peripapillary atrophy (PPA) where the blood-retina barrier has broken down (Neufeld, 1999b; Yuan and Neufeld, 2001). Since PPA can occur as an early optic nerve change associated with the onset of glaucoma (Jonas and Naumann, 1989), it is reasonable to hypothesise that microglia activation may be involved in the initiation of RGC death in glaucoma. Consistent with this idea, microglia activation has been observed following experimental ocular hypertension and prior to the onset of RGC death (Lam et al., 2003; Wang et al., 2000). The identification of activated microglia in glaucomatous tissue, however, does not, in itself, confirm the role of microglia activation in the initiation of retinal ganglion cell loss.
Analysis of events that result in microglia activation in relation to the onset of retinal ganglion cell loss should clarify this issue. In this context, CD200 (OX-2) was selected as a suitable marker of microglia activation. As a member of the immunoglobulin superfamily, it is widely distributed and expressed on neurons, activated T and B cells, follicular dendritic cells and endothelium. Its receptor, CD200R, is expressed predominantly in cells of the myeloid lineage, including microglia (Wright et al., 2000) and expression patterns of the neuroglial CD200 axis are an important factor in the control of microglia activity (Barclay et al., 2002). CD200R expressed on microglia cells interacts with CD200 to limit the level of microglial activation. In retinal inflammatory disease such as uveitis, disruption of the CD200/CD200R axis can result in microglia activation (Carter and Dick, 2004), and activated microglia demonstrate significant phagocytic activity in damaged retinal tissue (Schuetz and Thanos, 2004). Furthermore, in the hippocampus of aged and amyloid-β-treated rats, microglial activation was accompanied by decreased expression of neuronal CD200, providing evidence that neurons can down regulate activation in vitro through the interaction of CD200 and CD200R (Lyons et al., 2007).
We therefore hypothesised that CD200R expression in glaucomatous tissue could be used as a marker for microglial activation to clarify the temporal relationship between microglial activation and retinal ganglion cell loss.
2. Materials and methods
2.1. Antibodies and reagents
Polyclonal rabbit anti-cow GFAP was obtained from Dako, UK, monoclonal mouse anti-rat CD45 was obtained from Immunologicals Direct, UK, and monoclonal mouse anti-rat CD200, CD200R OX41 and OX42 were obtained from Harlan-Sera lab, UK. Mouse anti-rat Caspase-3, Alexa Fluor-488 and -594, donkey anti-mouse fluorescent secondary antibody were obtained from Molecular Probes, UK. Apoptag Peroxidase in situ detection kit was obtained from Chemicon, UK. All other reagents were obtained from Sigma Aldrich, UK, unless otherwise stated.
2.2. Animals
All procedures conformed to the UK Home Office Regulations for animal experimentation and to the Association for Research in Vision and Ophthalmology (ARVO) statement for the use of animals in research. Rats (Rattus norwegicus (n = 25); retired male breeders, weight range 250–450 g, age range 5–8 months,) were housed at 21°C and provided ad libitum with standard chow and water. Animals were maintained on a constant 24 h 40–90 lux (i.e. non-retinotoxic) light regime to minimise diurnal intraocular pressure (IOP) variation. Intraocular pressures were measured following corneal anaesthesia with topical 0.5% Benoxinate (Oxybuprocaine) Hydrochloride (Chauvin Pharmaceuticals, UK). IOPs were recorded with a factory calibrated Mentor® Tono-Pen™ XL as the mean of 10 readings on alternate days with animals held under gentle restraint (Moore et al., 1993).
2.3. Induction and assessment of experimental glaucoma
Unilateral experimental glaucoma was induced using an established method in which a superior episcleral aqueous drainage vein was exposed and injected with hypertonic saline (1.75 M) to induce sclerosis and damage to the trabecular meshwork, thereby compromising the drainage of aqueous from the eye (Morrison et al., 1997). The contralateral eye served as a normotensive non-operated control. A Delrin (Acetal resin, DuPont Corp.) ring, open at the site of the injection was pre-placed to ensure that injected saline was directed toward the trabecular meshwork and did not drain away through the episcleral veins. The standard deviation of IOP in the injected eye was used to quantify the extent to which the IOP fluctuated following the induction of experimental glaucoma. Animals were sacrificed at appropriate time points from 1 to 65 days post-microinjection by terminal anaesthetic. The eyes were enucleated, dissected and the optic nerve heads embedded in OCT (Tissue-Tek; Sakura, Netherlands). Parasagittal retinal cryosections (7 μm) were taken around the optic nerve head and air dried on Superfrost+ slides (BDH, UK).
To simplify analysis and facilitate comparison of aspects of IOP elevation with pathological optic nerve changes and quantitative immunohistochemistry, animals (n = 25) were segregated into 5 groups on the basis of the duration of IOP elevation (T).
2.4. Quantification of retinal ganglion cell (RGC) death
RGC death was quantified on the basis of nuclear counts in the retinal ganglion cell layer and expressed relative to the contralateral control eye. Apoptotic RGCs were detected using deoxynucleotidyl transferase-mediated deoxyuridine triphosphate nick-end labelling (TUNEL) staining using the Apoptag Peroxidase in situ detection kit according to manufacturer’s instructions (Fig. 2) and confirmed via detection of active caspase 3 protein by immunofluorescence (data not shown). RGC death was expressed as the number of TUNEL-positive cells as a percentage of total cell number in the retinal ganglion cell layer (GCL) as quantified by nuclear staining with methyl green dye.
Fig. 2.
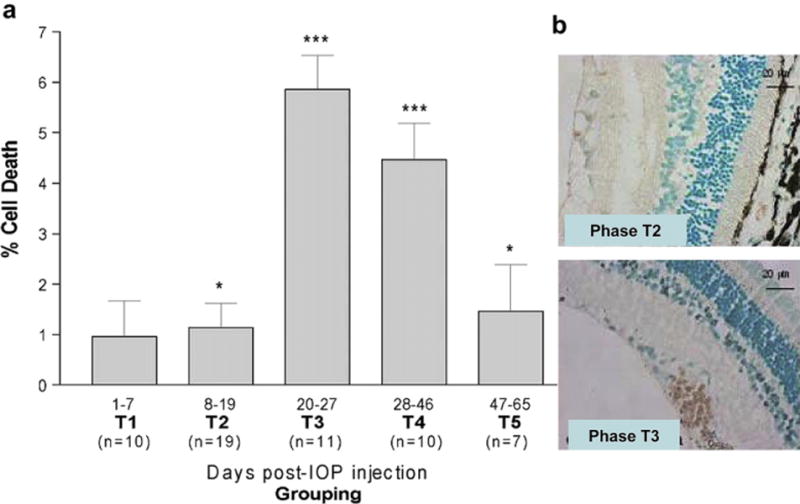
a. TUNEL positivity counts, as a percentage of Hoechst-stained cells in the retinal ganglion cell layer. Measurements are given as the mean ± SD of animal groups according to time (T1–T5) as detailed in Fig. 1. Statistical significance is indicated relative to contralateral (normotensive) eyes (p < 0.05*, p < 0.005**, p < 0.0005***). b. Immunohistochemical representation of TUNEL staining in hypertensive eyes. TUNEL-positive cells (brown) are seen in T2 and more predominately in the T3 phase (For interpretation of the references to color in this figure legend, the reader is referred to the web version of this article.).
2.5. Immunofluorescent localisation of glia and microglia
Optic nerve sections were fixed in acetone, washed in phosphate buffered saline (PBS) containing 2% bovine serum albumin (BSA) and 0.1% Triton X-100, and incubated with the appropriate primary antibody, diluted in PBS containing 2% BSA with 0.2% Tween-20. The appropriate secondary antibodies were diluted in PBS with 2 μg/ml bisbenzimide. Sections were washed in PBS prior to mounting in Gelvatol.
Fluorescent images were captured and recorded by Leica QFluoro software using a DMRA2 microscope (Leica Microsystems, UK). QWin software (Leica, UK) was used to quantify the pixel intensity of greyscale images. Immunofluorescence quantification graphs for peaks in pixel number and intensity results were normalised by subtraction of control immunofluorescence. Fluorescence data were presented as mean measurements (±SEM) across the 25 animals.
2.6. Statistical analysis
Statistical analysis was performed using the Mann–Whitney test (MS Excel) amongst the groups and p values equal or less than 0.05 were considered significant, unless otherwise stated. Results are expressed as mean ± SD.
3. Results
3.1. Experimental ocular hypertension
Intraocular pressure (IOP) was induced by injecting hypertonic saline (1.75 M) into an exposed superior episcleral aqueous drainage vein inducing sclerosis and damage to the trabecular meshwork, thereby compromising the drainage of aqueous from the eye (Morrison et al., 1997). Sustained unilateral elevations of IOP were observed in all animals following induced ocular hypertension (p < 0.05, relative to the contralateral eye, n = 25) with a maximum duration of 65 days (mean increase of 5.89 mmHg, standard deviation (SD), 3.76 mmHg). A typical IOP plot is shown in Fig. 1. We observed some variation in the stability of IOP elevation with the SD of IOP measurements ranging from 1.05 to 13.56 mmHg.
Fig. 1.
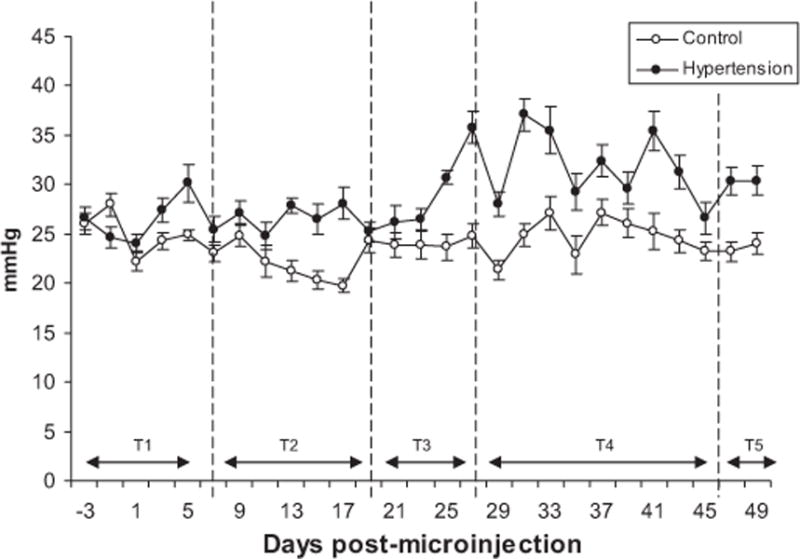
Intraocular pressure profile in ocular hypertensive and control eyes. Plots demonstrate the increase in IOP following the induction of experimental glaucoma for 5 animals. Each reading is the mean ± SD of 10 IOP measurements using a Tonopen. The first reading was taken 3 days prior to injection.
3.2. Retinal ganglion cell (RGC) death
To determine the number of apoptotic RGCs following the induction of ocular hypertension, sections were stained using TUNEL The differences in RGC death between experimental and control retina over time during ocular hypertension (T) and the cumulative effect of ocular hypertension under the IOP curve is shown in Fig. 2. The number of apoptotic TUNEL-positive RGCs in the retina peaked at days 20–27 (T3) with a statistical significant difference between hypertensive and normal retinas observed from day 8 onwards (p < 0.05).
3.3. Expression of glia and microglia markers during ocular hypertension
Typical examples of optic nerve head images used to quantify immunofluorescence changes during ocular hypertension are shown in Fig. 3. GFAP labelling was localised to astroglial columns throughout the normal optic nerve head in transversely oriented dense astrocytic processes (Fig. 3a). Following the induction of ocular hypertension denser labelling appeared as brightly labelled thick astrocytic processes (Fig. 3b). GFAP immunoreactivity was significantly elevated from T2 (11–19 days), with a peak at T3 (20–27, p < 0.05). The increase in GFAP immunofluorescence was not sustained and did not differ significantly from control in later time groups (T4, T5; days 28-onwards).
Fig. 3.
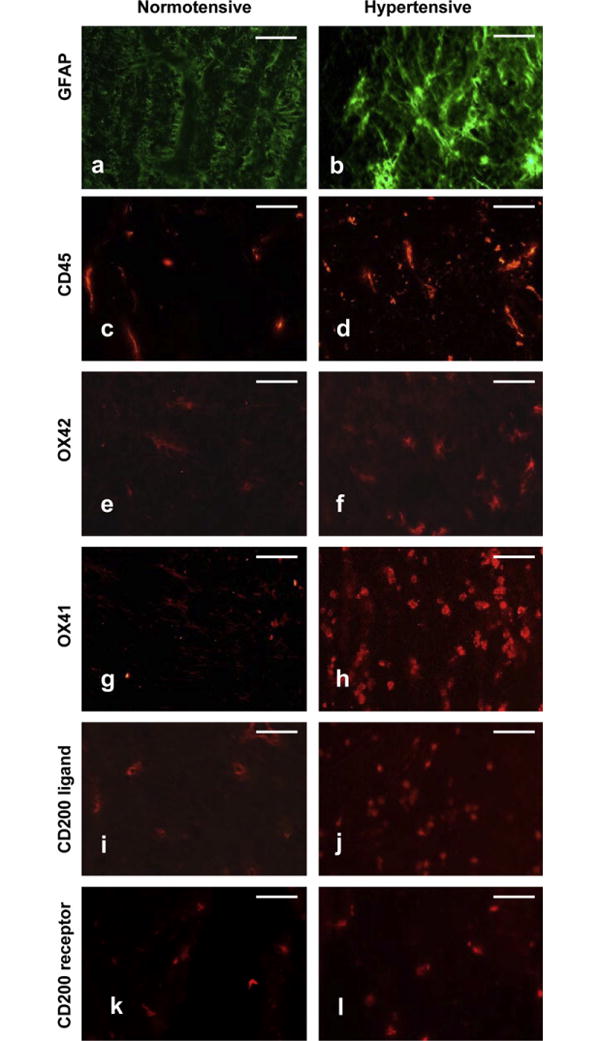
Immunohistochemical analysis of GFAP, CD45, OX42, OX41 and CD200, CD200R in rodent normotensive or hypertensive optic nerve heads at T3 (days 20–27. Representative of 5 independent experiments. Scale bars: 50 μm.
Changes in the labelling of markers for microglia activation between normotensive and hypertensive groups are shown in Fig. 3c–h and demonstrated as a function of duration of IOP elevation (T) in Fig. 4. Resident microglia (OX42- and OX41-positive), were identified in the optic nerve head of normal eyes (Fig. 3e and g). A similar distribution and profile for CD45-positive cells was also observed (Fig. 3c). Following the induction of ocular hypertension, microglia elongated and became more amoeboid, consistent with microglia activation (Fig. 3f and h). Absolute OX42-positive cells were counted per 50 μm2 field for each time point: T1 – 5.8 ± 1.5; T2 – 9.4 ± 1.1; T3 – 23.2 ± 1.9; T4 – 15 ± 4.5; T5 – 3.2 ± 1.3.
Fig. 4.
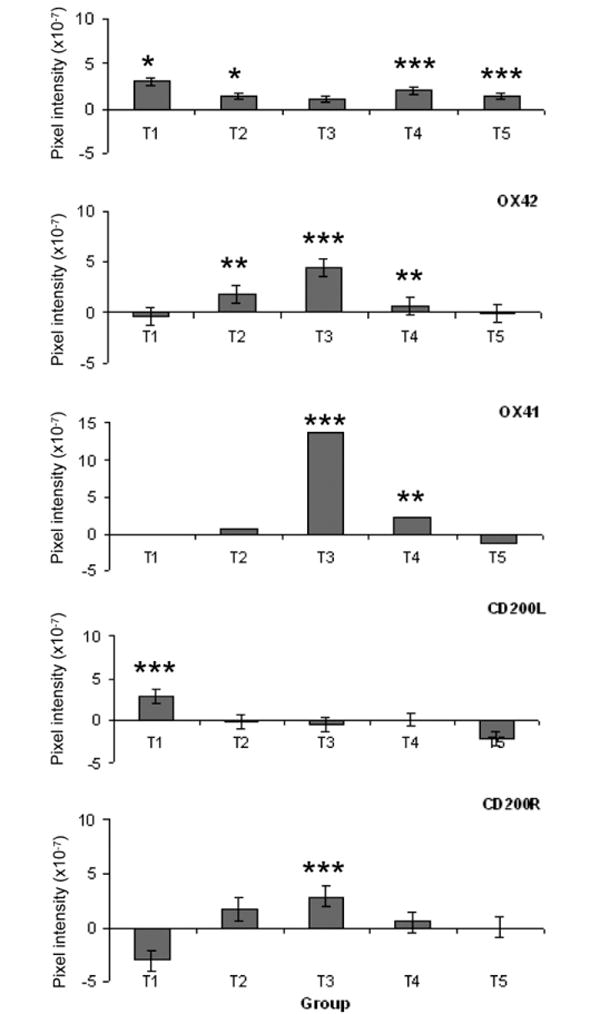
Changes in immunofluorescent labelling for microglia markers in normotensive and hypertensive eyes as a function of IOP elevation duration. Means ± SD are given relative to contralateral control eyes. Negative pixel intensities indicate greater labelling in the control relative to the hypertensive eye. Statistical significance is given relative to the normotensive eye (p < 0.05*, p < 0.005**, p < 0.0005***).
3.4. Expression of CD200 and CD200R in the optic nerve head
Expression of CD200 and CD200R between normotensive and hypertensive groups are represented and illustrated in Fig. 3i–l. CD200 and CD200R are expressed in normotensive groups (Fig. 3i and k, respectively) and the expression of both markers increased during ocular hypertension (Fig. 3j and l, respectively).
To determine the changes of microglia markers during ocular hypertension, quantitative analysis using pixel density was used (Fig. 4). Significant changes in CD45 staining were observed during early and late stages of ocular hypertension (T1, T2 and T4, T5, respectively). OX42 and OX41 staining peaked at stage T3 (days 20–27), with significant changes (< 0.05) starting at T2 (day 8) and continuing to stage T4 (day 46) before declining to returning control values by T5 (47–65 days).
Sparse labelling for CD200 and CD200R was observed in both normotensive and hypertensive eyes. Quantitative analysis (Fig. 4d and e) revealed an increase in CD200L (ligand) staining during the early stages of ocular hypertension (T1, 1–7 days, p < 0.001), with a return to control levels by T2 (11–19 days). CD200R staining decreased in the early stages of ocular hypertension but this did not reach significance. A significant increase in CD200R labelling was observed by T3 (20–27 days, p < 0.001), with a return to control levels by T5 (47–65 days).
4. Discussion
In this study, we used a rodent model of experimental glaucoma to investigate the temporal relationship between microglia activity and RGC damage. An important aspect of the rodent model is that the increases in IOP were moderate and that clinically the eyes displayed little ocular inflammation. Changes in microglia activation are therefore unlikely to be result directly from manipulations to increase IOP. The principle findings of our data are consistent with a temporal sequence of events in which the uncoupling of the CD200–CD200R axis and down-regulation of CD200R precede microglia activation and retinal ganglion cell loss.
One of the most characteristic features of microglia is their rapid activation in response to a wide variety of neural injury, a key factor in the defence of neural tissue. When activated, microglia can change their phenotype markedly and have altered morphology, and become scavenging, phagocytic cells with cytotoxic and degradative enzymes. Since microglia are phenotypically altered monocytes that entered the CNS during foetal development, one single antibody cannot specifically distinguish microglia from macrophages or haematogenous cells such as monocytes or lymphocytes. For the purposes of this study, the microglial cells in the optic nerve head were identified with OX42 (CD11b, Mac-1) a pan-microglia marker; OX41 an activated macrophage marker; and CD45 a glycoprotein found on the surface of macrophages, monocytes and lymphocytes, this differential identification panel is based on previous published findings (Neufeld, 1999b).
The observed increases in OX42- and OX41-positive cells are consistent with microglia activation in this glaucoma model. Similar activation has been reported in other rat glaucoma models (Ju et al., 2006) but at time points that would correspond to the T4 group in our study (6 weeks post induction of ocular hypertension). Activated microglia are closely related to dying RGCs in glaucoma (Naskar et al., 2002) and development (Boya et al., 1987) and are thought to play a role in the phagocytosis of retinal cellular debris (Thanos, 1991). The involvement of retinal microglia in retinal pathology is to be expected given their role in the protection of central nervous tissue (Kreutzberg, 1995). The key issue addressed in the present study is the temporal relationship between microglia activation and the onset of RGC loss. Our observation that the number of OX42- and CD45-positive cells increased in the early stages of ocular hypertension (T2 days 8–19), prior to the peak in RGC apoptosis identified at T3 (days 20–27), suggests that the activation of resident retinal microglia (Chen and Weber, 2001; Provis and Mitrofanis, 1990) influences RGC death in experimental glaucoma. We observed that the increase in microglia activation preceded the peak rate of RGC loss but that peak labelling for OX42 and OX41 coincided with peak TUNEL (apoptosis) rates (T3).
The CD200/CD200R complex is thought to play an important role in regulating microglia activity in relation to surrounding neuroglial populations (Neumann, 2001). With regard to resident microglia, any breakdown in this interaction could be used as a marker for the activation of microglia. In this respect, it is interesting to note that the most significant CD200 staining was observed in the earliest stage of IOP elevation, which preceded the onset of a significant increase in RGC death. Peak staining for CD200R occurred later during ocular hypertension and correlated with RGC cell death. Taken together, these findings suggest that uncoupling of the CD200–CD200R interaction is an early event in experimental glaucoma and probably precedes significant elevation in the rate of RGC death, thus raising the possibility that early microglia activation may play a role in initiating RGC death in glaucoma. These findings are consistent with observations that blockade of the CD200–CD200R axis with monoclonal antibodies in the Lewis rat increased CD200 expression, exacerbated inflammation and increased the production of nitric oxide synthase-2 (NOS-2) (Banerjee and Dick, 2004). Work on explanted human retina suggests that CD200R stimulation can sustain microglia migration within the retina (Carter and Dick, 2004).
Other studies have confirmed that an alteration in the CD200 axis plays a role in the regulation of microglia activity in the retina. The numbers of microglia are elevated and activated in the retina of CD200-deficient mice (Broderick et al., 2002) during experimental uveitis; however, macrophages lacking CD200 do not demonstrate an increase in CD200R. We also observed that staining for CD200 was reduced as intraocular pressure increased, possibly reflecting the loss of RGCs. This further suggests microglia activation due to a lack of CD200 down-regulation. Although no other studies have investigated CD200 interactions in the optic nerve, CD200–CD200R clearly has a role in suppression of autoimmunity during transplant rejection via reduction of the pro-inflammatory cytokines Interleukin-2 (IL-2), Interferon-γ (IFNγ), and Tumour Necrosis Factor-α (TNFα) and an elevation of anti-inflammatory cytokines, IL-10, IL-4 and Transforming Growth Factor-β (TGFβ) (Gorczynski et al., 1999, 2001). These mechanisms may also be involved in glaucoma pathophysiology and need to be studied further.
Our data suggests but does not prove that modulation of microglia activity may be beneficial in the reduction of RGC loss in glaucoma. The importance of immunomodulatory factors in glaucoma has been suggested as away of advancing treatment. RGC loss that occurs in ocular hypertension or following optic nerve trauma can be reduced by use of the immunomodulatory drug, Glatiramer Acetate (Cop-1) (Kipnis et al., 2000; Schori et al., 2001). With more severe damage such as optic nerve transection, the benefits of this intervention are not apparent (Blair et al., 2005). Involvement of microglia in RGC death suggests that their inhibition may be beneficial. Minocycline has been used as an inhibitor of microglia activation but distinguishing its effects on microglia from more direct neuroprotective effects has been difficult. In rats, minocycline is beneficial in reducing RGC loss following optic nerve transection or in experimental glaucoma (Levkovitch-Verbin et al., 2006). It has also shown a protective effect a mouse model of photoreceptor degeneration (Hughes et al., 2004). Since these effects can occur following the depletion of the myeloid populations a direct neuroprotective effect for minocycline should also be considered. Further work is required in experimental glaucoma models in which the effects of agents such as minocycline are evaluated in animals in which the myeloid population has been depleted.
In summary, we have demonstrated that microglia activation and uncoupling of the CD200–CD200R complex are early events in experimental glaucoma that coincide with the onset of RGC death. Our data suggest that, in addition to any beneficial role microglia may play in the later stages of disease; it is possible that they may also play a role in the initiation of RGC loss.
Acknowledgments
National Eye Research Centre, UK (SCIAD 043) Project grant (JEM). The authors thank Professor Andrew Dick and Dr James McLaren for critical reading of this manuscript.
Abbreviations
- RGC
retinal ganglion cells
- IOP
intraocular pressure
- GCL
ganglion cell layer
References
- Banerjee D, Dick AD. Blocking CD200–CD200 receptor axis augments NOS-2 expression and aggravates experimental autoimmune uveoretinitis in Lewis rats. Ocul Immunol Inflamm. 2004;12:115–125. doi: 10.1080/09273940490895326. [DOI] [PubMed] [Google Scholar]
- Barclay AN, Wright GJ, Brooke G, Brown MH. CD200 and membrane protein interactions in the control of myeloid cells. Trends Immunol. 2002;23:285–290. doi: 10.1016/s1471-4906(02)02223-8. [DOI] [PubMed] [Google Scholar]
- Blair M, Pease ME, Hammond J, Valenta D, Kielczewski J, Levkovitch-Verbin H, Quigley H. Effect of glatiramer acetate on primary and secondary degeneration of retinal ganglion cells in the rat. Invest Ophthalmol Vis Sci. 2005;46:884–890. doi: 10.1167/iovs.04-0731. [DOI] [PubMed] [Google Scholar]
- Boya J, Calvo J, Carbonell AL. Appearance of microglial cells in the postnatal rat retina. Arch Histol Jpn. 1987;50:223–228. doi: 10.1679/aohc.50.223. [DOI] [PubMed] [Google Scholar]
- Broderick C, Hoek RM, Forrester JV, Liversidge J, Sedgwick JD, Dick AD. Constitutive retinal CD200 expression regulates resident microglia and activation state of inflammatory cells during experimental autoimmune uveoretinitis. Am J Pathol. 2002;161:1669–1677. doi: 10.1016/S0002-9440(10)64444-6. [DOI] [PMC free article] [PubMed] [Google Scholar]
- Carter DA, Dick AD. CD200 maintains microglial potential to migrate in adult human retinal explant model. Curr Eye Res. 2004;28:427–436. doi: 10.1080/02713680490503778. [DOI] [PubMed] [Google Scholar]
- Chao C, Hu S, Molitor T, Shaskan E, Peterson P. Activated microglia mediate neuronal cell injury via a nitric oxide mechanism. J Immunol. 1992;149:2736–2741. [PubMed] [Google Scholar]
- Chen H, Weber AJ. BDNF enhances retinal ganglion cell survival in cats with optic nerve damage. Invest Ophthalmol Vis Sci. 2001;42:966–974. [PubMed] [Google Scholar]
- Chen L, Yang P, Kijlstra A. Distribution, markers, and functions of retinal microglia. Ocul Immunol Inflamm. 2002;10:27–39. doi: 10.1076/ocii.10.1.27.10328. [DOI] [PubMed] [Google Scholar]
- Fields RD, Stevens-Graham B. New insights into neuron-glia communication. Science. 2002;298:556–562. doi: 10.1126/science.298.5593.556. [DOI] [PMC free article] [PubMed] [Google Scholar]
- Gorczynski L, Chen Z, Hu J, Kai Y, Lei J, Ramakrishna V, Gorczynski RM. Evidence that an OX-2-positive cell can inhibit the stimulation of type 1 cytokine production by bone marrow-derived B7-1 (and B7-2)-positive dendritic cells. J Immunol. 1999;162:774–781. [PubMed] [Google Scholar]
- Gorczynski R, Bransom J, Cattral M, Huang X, Lei J, Min W, Wan Y, Gauldie J. Dendritic cells expressing TGFbeta/IL-10, and CHO cells with OX-2, increase graft survival. Transplant Proc. 2001;33:1565–1566. doi: 10.1016/s0041-1345(00)02595-1. [DOI] [PubMed] [Google Scholar]
- Hernandez M. Extracellular matrix molecules of the lamina cribrosa: a pressure-sensitive connective tissue. J Glaucoma. 1993;2:50–57. [PubMed] [Google Scholar]
- Hughes EH, Schlichtenbrede FC, Murphy CC, Broderick C, van Rooijen N, Ali RR, Dick AD. Minocycline delays photoreceptor death in the rds mouse through a microglia-independent mechanism. Exp Eye Res. 2004;78:1077–1084. doi: 10.1016/j.exer.2004.02.002. [DOI] [PubMed] [Google Scholar]
- Jonas JB, Naumann GO. Parapapillary chorioretinal atrophy in normal and glaucoma eyes. II. Correlations. Invest Ophthalmol Vis Sci. 1989;30:919–926. [PubMed] [Google Scholar]
- Ju KR, Kim HS, Kim JH, Lee NY, Park CK. Retinal glial cell responses and Fas/FasL activation in rats with chronic ocular hypertension. Brain Res. 2006;1122:209–221. doi: 10.1016/j.brainres.2006.09.022. [DOI] [PubMed] [Google Scholar]
- Kipnis J, Yoles E, Porat Z, Cohen A, Mor F, Sela M, Cohen IR, Schwartz M. T cell immunity to copolymer 1 confers neuroprotection on the damaged optic nerve: possible therapy for optic neuropathies. Proc Natl Acad Sci USA. 2000;97:7446–7451. doi: 10.1073/pnas.97.13.7446. [DOI] [PMC free article] [PubMed] [Google Scholar]
- Kreutzberg GW. Microglia, the first line of defence in brain pathologies. Arzneimittelforschung. 1995;45:357–360. [PubMed] [Google Scholar]
- Lam TT, Kwong JM, Tso MO. Early glial responses after acute elevated intraocular pressure in rats. Invest Ophthalmol Vis Sci. 2003;44:638–645. doi: 10.1167/iovs.02-0255. [DOI] [PubMed] [Google Scholar]
- Levkovitch-Verbin H, Kalev-Landoy M, Habot-Wilner Z, Melamed S. Minocycline delays death of retinal ganglion cells in experimental glaucoma and after optic nerve transection. Arch Ophthalmol. 2006;124:520–526. doi: 10.1001/archopht.124.4.520. [DOI] [PubMed] [Google Scholar]
- Libby RT, Howell GR, Pang IH, et al. Inducible nitric oxide synthase, Nos2, does not mediate optic neuropathy and retinopathy in the DBA/2J glaucoma model. BMC Neurosci. 2007;8:108. doi: 10.1186/1471-2202-8-108. [DOI] [PMC free article] [PubMed] [Google Scholar]
- Lyons A, Downer EJ, Crotty S, Nolan YM, Mills KH, Lynch MA. CD200 ligand receptor interaction modulates microglial activation in vivo and in vitro: a role for IL-4. J Neurosci. 2007;27:8309–8313. doi: 10.1523/JNEUROSCI.1781-07.2007. [DOI] [PMC free article] [PubMed] [Google Scholar]
- Moore C, Milne S, Morrison J. Noninvasive measurement of rat intraocular pressure with the tonopen. Invest Ophthalmol Vis Sci. 1993;34:363–369. [PubMed] [Google Scholar]
- Morrison JC, Moore CG, Deppmeier LM, Gold BG, Meshul CK, Johnson EC. A rat model of pressure induced optic nerve damage. Exp Eye Res. 1997;64:85–96. doi: 10.1006/exer.1996.0184. [DOI] [PubMed] [Google Scholar]
- Naskar R, Wissing M, Thanos S. Detection of early neuron degeneration and accompanying microglial responses in the retina of a rat model of glaucoma. Invest Ophthalmol Vis Sci. 2002;43:2962–2968. [PubMed] [Google Scholar]
- Neufeld A, Hernandez M, Gozalez M. Nitric oxide synthase in the human glaucomatous optic nerve head. Arch Ophthalmol. 1997;115:497–503. doi: 10.1001/archopht.1997.01100150499009. [DOI] [PubMed] [Google Scholar]
- Neufeld AH. Nitric oxide: a potential mediator of retinal ganglion cell damage in glaucoma. Surv Ophthalmol. 1999a;43(Suppl. 1):S129–S135. doi: 10.1016/s0039-6257(99)00010-7. [DOI] [PubMed] [Google Scholar]
- Neufeld AH. Microglia in the optic nerve head and the region of parapapillary chorioretinal atrophy in glaucoma. Arch Ophthalmol. 1999b;117:1050–1056. doi: 10.1001/archopht.117.8.1050. [DOI] [PubMed] [Google Scholar]
- Neumann H. Control of glial immune function by neurons. Glia. 2001;36:191–199. doi: 10.1002/glia.1108. [DOI] [PubMed] [Google Scholar]
- Pang IH, Johnson EC, Jia L, et al. Evaluation of inducible nitric oxide synthase in glaucomatous optic neuropathy and pressure-induced optic nerve damage. Invest Ophthalmol Vis Sci. 2005 Apr;46(4):1313–1321. doi: 10.1167/iovs.04-0829. [DOI] [PubMed] [Google Scholar]
- Provis JM, Mitrofanis J. NADPH-diaphorase neurones of human retinae have a uniform topographical distribution. Vis Neurosci. 1990;4:619–623. doi: 10.1017/s0952523800005812. [DOI] [PubMed] [Google Scholar]
- Quigley HA. Number of people with glaucoma worldwide. Br J Ophthalmol. 1996;80:389–393. doi: 10.1136/bjo.80.5.389. [DOI] [PMC free article] [PubMed] [Google Scholar]
- Ransohoff RM, Perry VH. Microglial physiology: unique stimuli, specialized responses. Annu Rev Immunol. 2009;27:119–145. doi: 10.1146/annurev.immunol.021908.132528. [DOI] [PubMed] [Google Scholar]
- Schori H, Kipnis J, Yoles E, WoldeMussie E, Ruiz G, Wheeler LA, Schwartz M. Vaccination for protection of retinal ganglion cells against death from glutamate cytotoxicity and ocular hypertension: implications for glaucoma. Proc Natl Acad Sci USA. 2001;98:3398–3403. doi: 10.1073/pnas.041609498. [DOI] [PMC free article] [PubMed] [Google Scholar]
- Schuetz E, Thanos S. Neuro-glial interactions in the adult rat retina after reaxotomy of ganglion cells: examination of neuron survival and phagocytic microglia using fluorescent tracers. Brain Res Bull. 2004;62:391–396. doi: 10.1016/j.brainresbull.2003.10.008. [DOI] [PubMed] [Google Scholar]
- Siu AW, Leung MC, To CH, Siu FK, Ji JZ, So KF. Total retinal nitric oxide production is increased in intraocular pressure-elevated rats. Exp Eye Res. 2002;75:401–406. [PubMed] [Google Scholar]
- Tambuyzer BR, Ponsaerts P, Nouwen EJ. Microglia: gatekeepers of central nervous system immunology. J Leukoc Biol. 2009;85:352–370. doi: 10.1189/jlb.0608385. [DOI] [PubMed] [Google Scholar]
- Tezel G, Wax MB. The immune system and glaucoma. Curr Opin Ophthalmol. 2004;15:80–84. doi: 10.1097/00055735-200404000-00003. [DOI] [PubMed] [Google Scholar]
- Thanos S. The relationship of microglial cells to dying neurons during natural neuronal cell death and axotomy-induced degeneration of the rat retina. Eur J Neurosci. 1991;3:1189–1207. doi: 10.1111/j.1460-9568.1991.tb00054.x. [DOI] [PubMed] [Google Scholar]
- Wang X, Tay SS, Ng YK. An immunohistochemical study of neuronal and glial cell reactions in retinae of rats with experimental glaucoma. Exp Brain Res. 2000;132:476–484. doi: 10.1007/s002210000360. [DOI] [PubMed] [Google Scholar]
- Wright GJ, Puklavec MJ, Willis AC, Hoek RM, Sedgwick JD, Brown MH, Barclay AN. Lymphoid/neuronal cell surface OX2 glycoprotein recognizes a novel receptor on macrophages implicated in the control of their function. Immunity. 2000;13:233–242. doi: 10.1016/s1074-7613(00)00023-6. [DOI] [PubMed] [Google Scholar]
- Yuan L, Neufeld AH. Activated microglia in the human glaucomatous optic nerve head. J Neurosci Res. 2001;64:523–532. doi: 10.1002/jnr.1104. [DOI] [PubMed] [Google Scholar]