

Abstract
Panels of prognostic biomarkers selected using candidate approaches often do not validate in independent populations, so additional strategies are needed to identify reliable classifiers. In this study, we used an array-based approach to measure DNA methylation and applied a novel method for grouping CpG dinucleotides according to well-characterized genomic sequence features. A hypermethylation profile among 13 CpG loci characterized by polycomb group target genes, mammalian interspersed repeats, and transcription factor binding sites (PcG/MIR/TFBS), was associated with reduced survival (hazard ratio: 3.98, p=0.001) in head and neck squamous cell carcinoma patients. This association was driven by CpGs associated with the TAP1 and ALDH3A1 genes, findings that were validated in an independent patient group (hazard ratio: 2.86, p=0.04). Together, the data not only elucidate new potential targets for therapeutic intervention in head and neck cancer, but also may aid in the identification of poor prognosis patients who may require more aggressive treatment regimens.
Keywords: Epigenetics, DNA Sequence, Head and Neck Carcinoma, Survival, Microarray
Introduction
Head and neck squamous cell carcinoma (HNSCC) arises from the mucosal lining of the larynx, pharynx, and oral cavity. Over 40,000 new cases develop annually in the US and despite advances in treatment regimens, five-year survival rates near 50% have declined only modestly over the past 30 years (1). The major determinants of patient prognosis include patient age, tumor stage and site, lifetime duration of alcohol/tobacco exposure, and oncogenic human papilloma virus-16 (HPV16) infection, although these do not fully inform patient outcome and are used conservatively in treatment planning (2). Identification of additional prognostic molecular biomarkers is needed to provide clinicians with better therapeutic decision-making tools. Candidate gene approaches have been employed in past studies of head and neck cancer to identify additional biomarkers of prognosis, although their results have almost uniformly been poorly replicated in independent studies (3-5). Thus, utilizing discovery-based approaches coupled with appropriate validation may provide novel markers of greater utility.
Epigenetic silencing of genes via promoter hypermethylation is a critical event in the development of many cancers, including HNSCCs (6-9). Due to the inherent stability of 5-methylcytosine, DNA methylation is attractive an epigenetic indicator for measurement. Consistent with studies of candidate genetic markers, candidate studies using DNA methylation as a predictive tool have uncovered novel biomarkers of survival (10). However, many prior studies suffer from a limited ability to detect strong overall survival associations and these identified associations may vary widely among different populations (11-13). Heterogeneous patterns of somatic alterations across tumors can decrease the utility of single candidate genes as biomarkers and molecular profile-based markers that address this challenge are increasingly pursued and employed.
Previous studies by our group and others have shown that profiles of cancer-related epigenetic alterations are dependent upon the local genomic architecture (11, 14-16). In fact, Lienert and colleagues (17) recently described “methylation-determining regions” of short DNA fragments whose sequence content (CpG density, transcription factor binding sites) largely defines methylation patterning in mouse embryonic stem cells. Therefore, we compared DNA methylation grouped by specific sets of phenotypically well-understood DNA sequence elements to ask if methylation profiles of these sets were associated with HNSCC patient survival times. We measured methylation genome-wide, at over 26,377 CpG loci and defined novel groups of loci based on their proximity to functional sequence elements.
Materials and Methods
Samples and Study Population
The initial discovery-phase study population has been previously described (18) and an independent validation population was drawn from Boston-area hospitals between 2003 and 2007, in an extension of the original case-control study of HNSCCs. Tumor samples (encompassing all head and neck sites except nasopharyngeal carcinomas) from incident cases were microscopically examined and histologically confirmed to be >70% tumor content by the study pathologist. Patients were enrolled after providing written, informed consent, as approved by all of the participating institutional review boards. Clinical information was collected and HPV16 status assessed using short fragment PCR to amplify a region of the L1 gene of HPV16, according to previously published methods (19). In total, 91 fresh-frozen tumor specimens from the discovery patient population and 101 formalin-fixed paraffin-embedded (FFPE) tumors from the validation population were subjected to methylation analysis. All-cause patient survival data were obtained from the National Death Index and survival was tracked for eight years post-diagnosis when possible.
DNA Isolation and Methylation Array Procedures
DNA was extracted from fresh-frozen tumors and 18 clinically normal head and neck tissues sourced from the National Disease Research Interchange using the DNeasy Blood and Tissue kit (Qiagen, Valencia, CA) or from 20 μm FFPE sections according to previously published procedures (20). One microgram of genomic DNA was sodium bisulfite-modified using the EZ DNA Methylation Kit (Zymo Research, Orange, CA) per the manufacturer’s instructions. DNA methylation was measured in the discovery patient population on a genome-wide scale using the Illumina Infinium HumanMethylation27 microarray platform (San Diego, CA). This BeadChip assay measures methylation (21), given as a β value ranging from zero to one, at over 27,000 CpG loci. Arrays were processed at the UCSF Institute for Human Genetics, Genomics Core Facility according to the manufacturer’s protocol. Data were assembled in BeadStudio without normalization, as recommended by the manufacturer. Control probes were used to assess sample performance. Specifically, the multivariate characteristics of array control probes based on fitted mean vector and variance-covariance matrix (Mahalanobis distance) was used to screen for outlying samples (although none were found). Sex chromosomal loci (n=1092) were excluded to avoid gender-specific methylation bias. As single nucleotide polymorphisms near the interrogated CpG site are known to induce spurious signals in the Illumina platforms, we excluded an additional 109 probes which resulted in a final dataset of 26,377 autosomal loci associated with 13,856 genes.
Statistical Analysis
Methylation data were analyzed in R statistical software v2.8.1 (http://www.r-project.org). Differential methylation (hypermethylation/hypomethylation) was determined by comparing the distributions of the methylation betas for each locus between tumor samples and normal tissue. A nonparametric Cox-Wilcoxon rank sum test was used to determine significance (false discovery rate q<0.05) and a threshold of ∣Δβ∣ > 0.2 was imposed to identify potentially meaningful biological changes. All 26,377 autosomal array CpG loci were clustered into mutually exclusive groups based on the following genomic functional sequence element criteria: CpG island status (22) (obtained from the array annotation file), Polycomb group (PcG) target status of the gene associated with the CpG (i.e. gene was described as a PcG target in at least one of Bracken, et al. (23), Lee, et al. (24), Schlesinger, et al. (25), or Squazzo, et al.(26)), presence within 1kb of at least one of 258 computationally predicted transcription factor binding sites (TFBS; sequences obtained from the tfbsConsSites track of the UCSC Genomes Table Browser (NCBI36/hg18 assembly, TFBS Z-score > 2)), and presence within any of the following types of repetitive element as defined by the Repeatmasker v3.2.7 track within Genomes Browser: Alu, LINE-1, LINE-2, and MIR sequences. Methylation array β values were averaged across all CpG loci within each bioinformatic class to generate an aggregate methylation value and tumors were grouped into high/intermediate/low categories depending on whether their specific methylation level was in the highest, middle, or lowest tertile across the population for each class.
Cox proportional hazards models were performed to determine class-specific (and locus-specific) associations between methylation groups and prognosis, and were controlled for patient age at diagnosis, anatomic site, combined AJCC stage, and HPV16 status. The null distribution of the 41-dimensional Cox Z-statistic was obtained by randomly permuting aggregate methylation values with respect to the survival variables 10,000 times. Note here that the response variable is survival and the predictor is that of tumor methylation. An omnibus test of significance, analogous to a Kolmogorov-Smirnov test, was performed by comparing the observed maximum for 41 Z-scores with the corresponding quantity over the permutation distribution. We tested for univariate associations between epidemiologic factors and high/intermediate/low categorical tumor methylation using non-parametric Kruskal-Wallis anova tests for continuous variables and a 10,000-permutation chi-squared test for categorical variables. An association was considered significant where p< 0.05.
Locus specificity and Array Validation
In order to determine the specificity of individual CpG locus methylation associations with patient outcomes, we assessed methylation at sites proximal to the index CpG loci (ALDH3A1 and TAP1). CpG loci in different bioinformatic groups or in nearby genes were compared, using Spearman’s rho, for their concordance with the index CpG, using the array CpG methylation values. Pyrosequencing assays were designed for the top two CpG loci (corresponding to ALDH3A1 and TAP1 genes) which were associated with survival. Pyrosequencing reactions were performed in triplicate according to the procedures described by Bollati et al. (27), with the following modifications: the annealing temperatures were 62°C-ALDH3A1 / 55.5°C-TAP1 and 47 (rather than 45) cycles were used in the case of ALDH3A1. Primers for this assay are provided in Supplementary Table 1. Sodium Bisulfite conversion efficiency was monitored using internal non-CpG cytosine residues using the PyroMark Q96MD system. DNA methylation at each locus was calculated by taking the percent of methylated signal divided by the sum of the methylated and unmethylated signals for each CpG. Nonparametric Spearman’s correlations were calculated between array CpG methylation and bisulfite pyrosequencing values. Tertile groups of methylation were determined across all tumors (within each dataset) for each CpG and tumors were stratified into low-, intermediate-, or high-methylation groups depending on their tertile membership. Survival was compared among groups using a log-rank test.
DNA methylation of TAP1 and ALDH3A1 loci were assessed in the independent validation patient set of 101 FFPE tumors. Pyrosequencing values of both loci were aggregated together (averaged) for each tumor and patient survival was compared across methylation tertiles. Cox models were used to adjust associations for clinical and demographic factors.
Results
Bioinformatically-clustered CpG loci are associated with patient survival
We determined the methylation state of 91 discovery-phase HNSCCs at all 26,377 autosomal loci using the Illumina Infinium HumanMethylation27 microarray. The methylation β distribution of this dataset is shown in Supplementary Figure 1, where each CpG locus is averaged across all 91 tumors. Given the enrichment of promoter and early exonic CpG loci in this array, a large proportion of loci in this array are unmethylated (45% of all CpGs where β<0.10) while a small proportion are highly methylated (0.5% of CpGs where β>0.90). To identify CpG loci whose altered methylation is associated with prognosis, we utilized a supervised approach that leverages genomic architecture to inform locus selection. Array CpG loci were bioinformatically clustered based on phenotypically well-understood DNA sequence elements into 41 mutually exclusive groups. Specifically, CpGs were clustered based on their presence within LINE-1, LINE-2, Alu, or MIR repeats, CpG islands, genes that are known targets of polycomb-group proteins, or within 1000-bp of transcription factor binding sites. Individual CpGs were only allowed to be members of a single bioinformatically-derived cluster. We hypothesized that this approach would attenuate biochemical and biological noise and reduce false discovery, thus providing increased power to detect significant associations with survival. Table 1 lists the DNA sequence elements that define each of the 41 CpG clusters and provides the number of CpGs in each cluster. Indicative of a preference for gene-rich regions in the array design, a single group of CpGs defined by being located in a CpG island and near a transcription factor binding site (CpGI∣TFBS) contains nearly half of all autosomal array CpG loci. The remaining CpG loci were spread unevenly across the other bioinformatically-derived clusters and 6% of CpG loci were not associated with any sequence elements that defined our clusters.
Table 1.
Description of Mutually Exclusive Bioinformatic Clusters of Methylation Array Loci
| Cluster Definition | Loci (n) | %Total | Cluster Definition | Loci (n) | %Total | Cluster Definition | Loci (n) | %Total |
|---|---|---|---|---|---|---|---|---|
| (not in any elements) | 1618 | 6 | CpGI∣MIR∣TFBS | 253 | 1 | PcG∣LINE2∣TFBS | 6 | s<1 |
| TFBS | 4436 | 17 | CpGI∣ALU | 120 | <1 | PcG∣LINE1 | 2 | <1 |
| MIR | 98 | <1 | CpGI∣ALU∣TFBS | 173 | 1 | PcG∣LINE1∣TFBS | 1 | <1 |
| MIR∣TFBS | 183 | 1 | CpGI∣LINE2 | 32 | <1 | CpGI∣PcG | 329 | 1 |
| ALU | 68 | <1 | CpGI∣LINE2∣TFBS | 130 | <1 | CpGI∣PcG∣TFBS | 2687 | 10 |
| ALU∣TFBS | 79 | <1 | CpGI∣LINE1 | 24 | <1 | CpGI∣PcG∣MIR | 4 | <1 |
| LINE2 | 88 | <1 | CpGI∣LINE1∣TFBS | 35 | <1 | CpGI∣PcG∣MIR∣TFBS | 33 | <1 |
| LINE2∣TFBS | 103 | <1 | PcG | 64 | <1 | CpGI∣PcG∣ALU | 10 | <1 |
| LINE2∣MIR∣TFBS | 1 | <1 | PcG∣TFBS | 313 | 1 | CpGI∣PcG∣ALU∣TFBS | 21 | <1 |
| LINE1 | 73 | <1 | PcG∣MIR | 8 | <1 | CpGI∣PcG∣LINE2 | 4 | <1 |
| LINE1∣TFBS | 45 | <1 | PcG∣MIR∣TFBS | 13 | <1 | CpGI∣PcG∣LINE2∣TFBS | 7 | <1 |
| CpGI | 2341 | 9 | PcG∣ALU | 3 | <1 | CpGI∣PcG∣LINE1 | 5 | <1 |
| CpGI∣TFBS | 12931 | 49 | PcG∣ALU∣TFBS | 1 | <1 | CpGI∣PcG∣LINE1∣TFBS | 1 | <1 |
| CpGI∣MIR | 71 | <1 | PcG∣LINE2 | 3 | <1 |
26,377 total autosomal loci were clustered. A shaded box indicates the cluster whose methylation is associated with survival. LINE= Long interspersed nuclear element. MIR = Mammalian interspersed repeat. TFBS = Transcription factor binding site. CpGI = CpG island. PcG = Polycomb group target group genes.
To investigate the relationship between these profiles of DNA methylation alterations and patient prognosis, we determined the average methylation value across all CpGs (aggregate methylation) among bioinformatic clusters for each of the tumor samples. For every bioinformatic cluster, tumors were sorted into “high,” “intermediate,” or “low” methylation subgroups depending on whether their methylation level (among member CpG loci) fell into the highest, middle, or lowest tertile, respectively. An omnibus test for significance indicated that, across bioinformatic clusters, methylation was significantly associated with patient survival (permutation test p=0.0037; Figure 1A). This association was robust to potential confounding variables such as age at diagnosis, anatomic site, combined AJCC stage, and HPV16 status (permutation p=0.021; Figure 1B). In the latter model, the power to detect significant differences in survival times, based on methylation of locus clusters, was diminished due to incomplete clinical data, however the effect remained significant.
Figure 1.

Cox survival scores for all bioinformatically-derived clusters. Infinium array CpG loci were clustered into 41 groups based on local sequence context. The cluster denoted by (*) contains 1636 loci that are not proximal to any of the functional elements used for clustering. For each cluster, the average methylation across all member loci for all tumors was calculated (represented by point color). Tumors were stratified into “high,” “intermediate,” and “low” methylation depending on each tumor’s methylation within each cluster and the dichotomous high/low group status was used as the predictor in a Cox proportional hazards model. Cluster-specific Cox scores are plotted for the (A) unadjusted model (n=90 with complete survival data) and (B) Cox model adjusted for age, site, stage, and HPV16 status (n=70). Dashed red lines represent the upper boundary for the 95% confidence limit of the null permutation distribution. The omnibus p-value indicates the overall significance level of the association between survival and methylation over all bioinformatic clusters of CpG loci. Associations where p<0.05 are considered significant.
To characterize the methylation state of the tumors in each patient subgroup, we compared the number of CpG loci that were differentially methylated compared to normal head and neck tissues (Supplementary Figure 2) and found the ratios of hypomethylated/hypermethylated CpG were significantly different across patient subgroups (permutation p<0.001). The top differentially-methylated sites within each group are described in Supplementary Table 2.
Methylation patterns of a 13-CpG locus cluster identify a patient subgroup with poor prognosis
Methylation of the CpG loci associated with the cluster: polycomb group target genes, mammalian interspersed repeats, and transcription factor binding sites (PcG∣MIR∣TFBS, Figure 1) was consistently associated with prognosis in these aggregate models. The aggregate methylation value for this group (β =0.52) was significantly higher than the mean across all clusters (average= 0.43, range= 0.11-0.71). Many of the genes associated with the 13 CpG loci in this cluster (described in Table 2) are involved in the maintenance of cellular homeostasis or possess tumor suppressive function. In order to assess possible bias or confounding arising from the characteristics of individual patients, we compared clinical and demographic factors the patients in the low, intermediate, and high methylation groups (Table 3). Notably, no significant differences in age at diagnosis, gender, HPV16 status, tumor site, tumor stage, drinking or smoking exposures were observed.
Table 2.
Gene-associated Loci In Bioinformatic Cluster PcG|MIR|TFBS
| Locus Name | Chromosome | Genomic Position | Entrez Gene ID | Symbol | Protein Name |
|---|---|---|---|---|---|
| cg01091565 | 15 | 88095766 | 55897 | MESP1 | mesoderm posterior 1 |
| cg01861509 | 10 | 73519632 | 9806 | SPOCK2 | sparc/osteonectin; cwcv and kazal-like domains proteoglycan (testican) 2 |
| cg03021690 | 14 | 102661717 | 7127 | TNFAIP2 | tumor necrosis factor; alpha-induced protein 2 |
| cg03389164 | 14 | 93493625 | 51676 | ASB2 | ankyrin repeat and SOCS box-containing protein 2 |
| cg03465320 | 6 | 32931056 | 6890 | TAP1 | transporter 1; ATP-binding cassette; sub-family B |
| cg16853860 | 6 | 32931094 | 6890 | TAP1 | transporter 1; ATP-binding cassette; sub-family B |
| cg03714916 | 6 | 36753864 | 1026 | CDKN1A | cyclin-dependent kinase inhibitor 1A |
| cg07617246 | 15 | 63503004 | 57722 | NOPE | DDM36 |
| cg09358725 | 11 | 33870664 | 4005 | LMO2 | LIM domain only 2 |
| cg11258532 | 16 | 65435374 | 766 | CA7 | carbonic anhydrase VII isoform 1 |
| cg15796819 | 17 | 19591782 | 218 | ALDH3A1 | aldehyde dehydrogenase 3 family; member A1 |
| cg22340747 | 15 | 43470502 | 2628 | GATM | glycine amidinotransferase (L-arginine:glycine amidinotransferase) |
| cg24387380 | 15 | 24741904 | 2558 | GABRA5 | gamma-aminobutyric acid (GABA) A receptor; alpha 5 precursor |
Table 3.
Clinicopathologic Characteristics of Study Participants Stratified According to Methylation Status Across 13 CpG Loci
| Low Methylation |
Intermediate Methylation |
High Methylation |
P | |
|---|---|---|---|---|
| (n=30) | (n=30) | (n=31) | ||
| Age at Diagnosis (years) | 0.87 a | |||
| Range | 32-84 | 41-87 | 34-80 | |
| Mean (SD) | 58 (11.1) | 63 (13.5) | 59.5 (12.7) | |
| Gender, n (%) | 0.22 b | |||
| Female | 6 (20) | 11 (37) | 6 (19) | |
| Male | 24 (80) | 19 (63) | 25 (81) | |
| HPV16 Status, n (%) | 0.30 b | |||
| Positive | 8 (27) | 11 (37) | 6 (19) | |
| Negative | 22 (73) | 19 (63) | 25 (81) | |
| Tumor Site, n (%) * | 0.45 b | |||
| Oral | 12 (46) | 17 (65) | 17 (71) | |
| Pharynx | 7 (27) | 5 (19) | 3 (12) | |
| Larynx | 7 (27) | 4 (15) | 4 (17) | |
| Tumor Stage, n (%) † | 0.71 b | |||
| I | 0 (0) | 0 (0) | 2 (7) | |
| II | 8 (30) | 5 (19) | 8 (29) | |
| III | 5 (19) | 4 (15) | 4 (14) | |
| IV | 14 (52) | 18 (67) | 14 (50) | |
| Lifetime Drink-Years of Consumption, n ‡ | 0.84 a | |||
| Range | 0-51 | 0-58 | 0-58 | |
| Mean (SD) | 27 (19) | 22 (21.7) | 29 (19) | |
| Never-drinkers, n | 5 | 4 | 5 | |
| Lifetime Pack-Years Smoked, n § | 0.32 a | |||
| Range | 0-105 | 0-100 | 0-125 | |
| Mean (SD) | 36 (29) | 30 (28) | 29 (31) | |
| Never-smokers, n | 5 | 6 | 7 |
Fifteen samples missing site data
Nine tumors missing stage data
Eighteen patients missing self-reported drinking data
Thirteen patients missing self-reported smoking data
Kruskal-Wallis analysis of variance
Permutation chi-square test
We next asked if the DNA methylation level within this cluster of 13 PcG∣MIR∣TFBS-member loci was associated with patient survival times. Kaplan-Meier analysis (Figure 2) revealed a significant difference in overall survival among the patient methylation groups by taking into account all loci in this class (Log-rank p=0.0003). The median survival time of patients in the high methylation group was 1.2 years with 13% of patients alive at 8 years, as compared to a 50% 8-year survivorship and a median survival time of 5.9 years in the low methylation group. In addition, the patient group with intermediate methylation demonstrated intermediate survival times. A Cox proportional hazards analysis, adjusted for age at diagnosis, tumor site, tumor stage, and HPV16 status, showed that patients in the high DNA methylation group had significantly decreased survival times (HR: 3.98, 95% CI: 1.8-8.9) (Table 4). Due to potential differences in treatment regimens of low vs. high stage disease that may influence survival times within and each patient methylation subgroup, we performed a stratified subset analysis and found that survival times did not significantly vary by stage within any of the high, intermediate, or low methylation subgroups (Log-rank p= 0.43, 0.33, 0.98, respectively).
Figure 2.
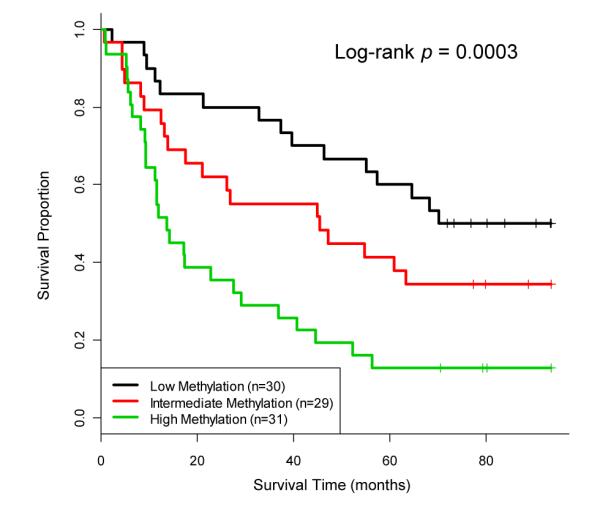
Kaplan-Meier analysis reveals an association between DNA methylation and overall patient survival. Patients with high, intermediate, and low methylation levels across the 13 PcG∣MIR∣TFBS CpG locus cluster in a discovery population (n=90) are shown. Vertical tick marks represent censored observations. Log-rank test p-value is considered significant where p<0.05.
Table 4.
Multivariable Cox Proportional Hazards Analysis in Testing and Validation Patient Populations
| Discovery |
Validation |
|||||
|---|---|---|---|---|---|---|
| Predictors | HR | 95% CI | P | HR | 95% CI | P |
| Methylation Group Status | ||||||
| Low Methylation | Reference | Reference | ||||
| Intermediate Methylation | 2.47 | (1.08, 5.65) | 0.03 | 2.82 | (0.99, 8.02) | 0.05 |
| High Methylation | 3.98 | (1.77, 8.93) | 0.001 | 2.86 | (1.02, 8.11) | 0.04 |
| HPV16 Detection | ||||||
| Negative | Reference | Reference | ||||
| Positive | 0.40 | (0.17, 0.89) | 0.02 | 0.47 | (0.13, 1.72) | 0.25 |
| Age (per decade) | 1.28 | (0.98, 1.65) | 0.07 | 1.08 | (0.77, 1.53) | 0.64 |
| Tumor Site | ||||||
| Oral Cavity | Reference | Reference | ||||
| Pharynx | 1.03 | (0.46, 2.32) | 0.93 | 0.81 | (0.36, 1.87) | 0.63 |
| Larynx | 1.85 | (0.83, 4.12) | 0.13 | 1.51 | (0.50, 4.52) | 0.46 |
| Combined AJCC Stage | ||||||
| I & II | Reference | Reference | ||||
| III & IV | 1.51 | (0.76, 2.96) | 0.24 | 3.25 | (0.75, 14.1) | 0.25 |
Significant results in bold. CI = Confidence Interval. HR = Hazard Ratio
Specificity and Validation of survival association by bisulfite pyrosequencing
To determine whether specific CpGs in the PcG∣MIR∣TFBS cluster were driving the observed survival association, individual Cox proportional hazards models were constructed for each of the 13 PcG∣MIR∣TFBS CpG loci (Supplementary Table 3). Methylation levels of TAP1 and ALDH3A1 CpGs were most highly associated with survival time (hazard ratios and p-values: 2.42 and 1.84, p<0.001 and p<0.02); we therefore selected these loci for confirmation by pyrosequencing all of the discovery-set tumors with available DNA (88 of 91). Methylation values determined by pyrosequencing were highly concordant with array measurements at both loci (Spearman’s correlation= 0.88 and 0.86) and survival associations were validated (log-rank p-value= 0.003 and 0.001; Supplementary Figure 3). To determine the specificity of this survival association for CpG loci in the PcG∣MIR∣TFBS cluster, array methylation values for ALDH3A1 and LMO2 CpGs were compared to those of loci within the same genes but clustered into a separate PcG∣TFBS group (LMO2 is examined here since there were no additional TAP1 CpGs with which to compare methylation in any other bioinformatic groups). Despite a close proximity of the ALDH3A1 CpG pairs and LMO2 CpGs pairs (~100 bp for each gene), methylation concordance was poor (Spearman’s correlation= 0.29 and 0.62) and proximal CpG methylation levels were not associated with survival in either case (log-rank p-value= 0.53 and 0.97; Supplementary Figure 4). Similarly, concordance of TAP1 and ALDH3A1 with neighboring gene loci (in ULK2 and PSMB9, respectively) was low (Spearman’s correlation= 0.14 and -0.14), and methylation of these CpGs were not associated with survival (log-rank p-value= 0.17 and 0.57; Supplementary Figure 5).
Methylation of TAP1 and ALDH3A1 independently confirm survival association in a HNSCC validation population
In order to validate the observed association with survival, we further examined an additional 101 tumors drawn from an independent tumor collection period. Bisulfite pyrosequencing analysis of these tumors at the TAP1 and ALDH3A1 loci was performed and aggregate methylation values were generated for each tumor. Membership in the patient subgroup with the highest methylation was independently poorly prognostic (Figure 3 and Table 4; HR: 2.86, 95% CI: 1.02-8.11), validating the initial discovery-phase observation. In addition, patients that belonged to the intermediate methylation subpopulation had decreased survival times compared to the low methylation subgroup, although this association did not reach significance in multivariable analyses (Figure 3 and Table 4; HR: 2.82, 95% CI: 0.99-8.02).
Figure 3.
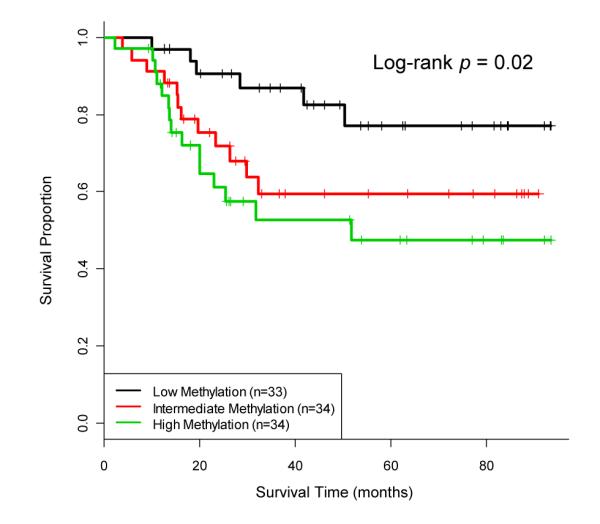
Combined methylation of TAP1 and ALDH3A1 loci is associated with overall survival in a HNSCC validation population. Aggregate methylation values for these top loci (out of the 13 PcG∣MIR∣TFBS CpGs) are determined for each of the 101 tumors in the validation patient population and the methylation groupings are compared. Vertical tick marks represent censored observations. Log-rank test p-value is considered significant where p<0.05.
Discussion
Epigenetic alterations, reflected in changes to the 5-methylcytosine content at specific genomic loci, are required for normal cellular function and development. Candidate gene approaches for identification of prognostic biomarkers are widely used by researchers and studies have found that DNA methylation alterations are associated with patient survival in a number of cancers (11, 28-36), including HNSCC. Head and neck malignancies are often aggressive tumors with a poor probability of survival, and there are few tools currently available to assist the oncologist in determining long-term outcome in these patients. Here we used a genome-wide array to measure DNA methylation in HNSCC, identified markers of patient survival time with a novel approach by clustering CpGs based on their association with local sequence features, and validated the identified markers in an independent set of tumors.
Recently, investigations have revealed that, in addition to aging and environment, the architecture of the genome itself may predispose certain CpG sites to DNA methylation, both in normal cells and in cancer (16, 37, 38). Therefore, methylation profiling using genomically-informed methodologies is an attractive approach for identifying novel biomarkers. Here, we have developed a unique method for classifying CpG loci that allows functional sequence elements to dictate the clustering. This technique has proven useful in defining a novel association between methylation of specific locus groups and patient prognosis.
Importantly, our analysis demonstrates that HNSCC patients with tumors hypermethylated at a group of 13 CpG loci (defined by proximity to polycomb gene targets, mammalian interspersed repetitive elements, and transcription factor binding sites) have a significantly reduced survival time independent of HPV16 infection status. This suggests that methylation alterations at these sites may determine the phenotype or therapeutic response of this disease. While more work is necessary to precisely determine how the nexus of these three functional sequence element types defines an observable phenotype, it is possible that methylation of these sites, particularly PcG target gene promoters and TFBSs, may potentiate the transformation into (or represent a product of) a stem cell-like tumor. Indeed, there is accumulating evidence that DNA hypermethylation is observed in many cancers at the sites of polycomb-mediated gene repression in embryonic cells, which become relaxed during differentiation, and this methylation correlates with stem cell characteristics (39). In addition, a number of transcription factors have been shown to be involved in the recruitment of DNA methyltransferases to PcG target sites (39). Further, studies of aging-dependent methylation have demonstrated that PcG marking and frequency of coincident retrotransposable elements are both correlated and complementary (14). All of these observations further support our result that the combination of these sequence elements is critical in determining tumor behavior.
Focusing on the individual gene members of the PcG∣MIR∣TFBS cluster, we see that many of these are highly relevant to head and neck disease. Chief among them is ALDH3A1, which is expressed in the oral mucosa (40) and is a member of the aldehyde dehydrogenase family of enzymes that convert the carcinogenic intermediate of ethanol metabolism, acetaldehyde, into non-toxic acetic acid. As alcohol is a major risk factor for the development of HNSCC, one might expect alterations of ALDH3A1 to play a role in the initiation and promotion of malignancy. At the same time, this gene has been shown to inhibit epithelial cell proliferation (41) and is frequently mutated in breast cancers (42). In addition, it is well-known that aldehyde dehydrogenase is involved in normal stem cell biology and is a functional marker for epithelial cells with enhanced tumorigenic potential. A recent publication showed enrichment for ALDH3 in the stem cell populations of mammalian oral tissues (43). This supports our hypothesis that alterations at PCG∣MIR∣TFBS-associated genes define a more stem-like constitution of tumor cells that engender more aggressive HNSCCs.
Downregulation of another gene represented in our PcG∣MIR∣TFBS-prognostic cluster, TAP1, allows HNSCC cells to avoid immune surveillance by cytotoxic T-lymphoctyes (44) and a lack of protein expression has recently been shown to confer a negative prognostic risk in HNSCC (45) as well as in many other cancers. This study, however, did not include HPV status in the survival analysis, so the question remained whether downregulation was truly independently prognostic. Another group reported that ectopic expression of TAP1 in xenograft assays significantly prolonged mouse survival time and increased immune infiltrate (46). In addition, functional investigations have revealed that this gene is downregulated in primary HNSCCs (47, 48), metastasis (45), and HNSCC cell lines (49), although promoter methylation was not previously described in this setting. Together, these data suggest that TAP1 may be a candidate for therapy in human HNSCCs.
Another gene marked by a CpG in the PcG∣MIR∣TFBS cluster that was associated with HNSCC survival is the ankyrin-repeat SOCS box-containing protein 2 (ASB2) which appears to be a modulator of notch signaling (50) and inhibits growth of leukemic cells (51). However, its potential status as a tumor suppressor in the head and neck had yet to be described. A prominent tumor suppressor in the PcG∣MIR∣TFBS cluster is CDKN1A, encoding the p21 (WAF) protein that signals G1 cell cycle arrest or senescence. Two additional genes identified in our analysis (SPOCK2 and NOPE) are known to be methylated as potential biomarkers in cancer (52, 53). Consistent with our observations, the genes represented by CpGs in the PcG∣MIR∣TFBS group are primarily tumor suppressors, and one would therefore expect that their inactivation through a combination of hypermethylation and additional somatic alterations would result in a poorer prognosis.
In summary, we have developed a novel technique to identify clinical characteristics of HNSCCs using the genomic information of CpG loci coupled with epigenetic content at those sites. In two independent populations, we show that DNA methylation profile markers may be used to identify those at greatest risk of death, irrespective of HPV status. The identification of specific DNA methylation biomarkers, such as those presented here, may assist in selecting patients who are most likely to benefit from tissue-sparing procedures and targeted therapies. It will be important to validate this in other populations in an effort to move these biomarkers into clinical practice.
Supplementary Material
Acknowledgements
This study was funded by the Flight Attendant Medical Research Institute (CJM) and the National Institutes of Health (KTK: CA078609, CA100679).
Footnotes
The authors declare no potential conflicts of interest.
Microarray data from this study have been contributed to the NCBI Gene Expression Omnibus under the accession number GSE25093 (http://www.ncbi.nlm.nih.gov/geo).
References
- 1.Edwards BK, Ward E, Kohler BA, Eheman C, Zauber AG, Anderson RN, et al. Annual report to the nation on the status of cancer, 1975-2006, featuring colorectal cancer trends and impact of interventions (risk factors, screening, and treatment) to reduce future rates. Cancer. 2010;116:544–73. doi: 10.1002/cncr.24760. [DOI] [PMC free article] [PubMed] [Google Scholar]
- 2.Adelstein DJ, Ridge JA, Gillison ML, Chaturvedi AK, D’Souza G, Gravitt PE, et al. Head Neck 2009. Vol. 31. Washington, D.C.: Nov 9-10, 2008. Head and neck squamous cell cancer and the human papillomavirus: summary of a National Cancer Institute State of the Science Meeting; pp. 1393–422. [DOI] [PubMed] [Google Scholar]
- 3.Avissar M, McClean MD, Kelsey KT, Marsit CJ. MicroRNA expression in head and neck cancer associates with alcohol consumption and survival. Carcinogenesis. 2009;30:2059–63. doi: 10.1093/carcin/bgp277. [DOI] [PMC free article] [PubMed] [Google Scholar]
- 4.Vlatkovic N, El-Fert A, Devling T, Ray-Sinha A, Gore DM, Rubbi CP, et al. Loss of MTBP expression is associated with reduced survival in a biomarker-defined subset of patients with squamous cell carcinoma of the head and neck. Cancer. 2011 doi: 10.1002/cncr.25864. [DOI] [PubMed] [Google Scholar]
- 5.Chang KP, Wu CC, Chen HC, Chen SJ, Peng PH, Tsang NM, et al. Identification of candidate nasopharyngeal carcinoma serum biomarkers by cancer cell secretome and tissue transcriptome analysis: potential usage of cystatin A for predicting nodal stage and poor prognosis. Proteomics. 2010;10:2644–60. doi: 10.1002/pmic.200900620. [DOI] [PubMed] [Google Scholar]
- 6.Rosas SL, Koch W, da Costa Carvalho MG, Wu L, Califano J, Westra W, et al. Promoter hypermethylation patterns of p16, O6-methylguanine-DNA-methyltransferase, and death-associated protein kinase in tumors and saliva of head and neck cancer patients. Cancer Res. 2001;61:939–42. [PubMed] [Google Scholar]
- 7.Ha PK, Califano JA. Promoter methylation and inactivation of tumour-suppressor genes in oral squamous-cell carcinoma. Lancet Oncol. 2006;7:77–82. doi: 10.1016/S1470-2045(05)70540-4. [DOI] [PubMed] [Google Scholar]
- 8.Hasegawa M, Nelson HH, Peters E, Ringstrom E, Posner M, Kelsey KT. Patterns of gene promoter methylation in squamous cell cancer of the head and neck. Oncogene. 2002;21:4231–6. doi: 10.1038/sj.onc.1205528. [DOI] [PubMed] [Google Scholar]
- 9.Bennett KL, Romigh T, Eng C. Disruption of transforming growth factor-beta signaling by five frequently methylated genes leads to head and neck squamous cell carcinoma pathogenesis. Cancer Res. 2009;69:9301–5. doi: 10.1158/0008-5472.CAN-09-3073. [DOI] [PubMed] [Google Scholar]
- 10.Langevin SM, Stone RA, Bunker CH, Lyons-Weiler MA, Laframboise WA, Kelly L, et al. MicroRNA-137 promoter methylation is associated with poorer overall survival in patients with squamous cell carcinoma of the head and neck. Cancer. 2010 doi: 10.1002/cncr.25689. [DOI] [PMC free article] [PubMed] [Google Scholar]
- 11.Misawa K, Ueda Y, Kanazawa T, Misawa Y, Jang I, Brenner JC, et al. Epigenetic inactivation of galanin receptor 1 in head and neck cancer. Clin Cancer Res. 2008;14:7604–13. doi: 10.1158/1078-0432.CCR-07-4673. [DOI] [PMC free article] [PubMed] [Google Scholar]
- 12.Estilo CL, P OC, Ngai I, Patel SG, Reddy PG, Dao S, et al. The role of novel oncogenes squamous cell carcinoma-related oncogene and phosphatidylinositol 3-kinase p110alpha in squamous cell carcinoma of the oral tongue. Clin Cancer Res. 2003;9:2300–6. [PubMed] [Google Scholar]
- 13.Calmon MF, Rodrigues RV, Kaneto CM, Moura RP, Silva SD, Mota LD, et al. Epigenetic silencing of CRABP2 and MX1 in head and neck tumors. Neoplasia. 2009;11:1329–39. doi: 10.1593/neo.91110. [DOI] [PMC free article] [PubMed] [Google Scholar]
- 14.Estecio MR, Gallegos J, Vallot C, Castoro RJ, Chung W, Maegawa S, et al. Genome architecture marked by retrotransposons modulates predisposition to DNA methylation in cancer. Genome Res. 2010;20:1369–82. doi: 10.1101/gr.107318.110. [DOI] [PMC free article] [PubMed] [Google Scholar]
- 15.Wolff EM, Chihara Y, Pan F, Weisenberger DJ, Siegmund KD, Sugano K, et al. Unique DNA methylation patterns distinguish noninvasive and invasive urothelial cancers and establish an epigenetic field defect in premalignant tissue. Cancer Res. 2010;70:8169–78. doi: 10.1158/0008-5472.CAN-10-1335. [DOI] [PMC free article] [PubMed] [Google Scholar]
- 16.Poage GM, Houseman EA, Christensen BC, Butler RA, Avissar-Whiting M, McClean MD, et al. Global hypomethylation identifies Loci targeted for hypermethylation in head and neck cancer. Clin Cancer Res. 2011;17:3579–89. doi: 10.1158/1078-0432.CCR-11-0044. [DOI] [PMC free article] [PubMed] [Google Scholar]
- 17.Lienert F, Wirbelauer C, Som I, Dean A, Mohn F, Schubeler D. Identification of genetic elements that autonomously determine DNA methylation states. Nat Genet. 2011;43:1091–7. doi: 10.1038/ng.946. [DOI] [PubMed] [Google Scholar]
- 18.Marsit CJ, McClean MD, Furniss CS, Kelsey KT. Epigenetic inactivation of the SFRP genes is associated with drinking, smoking and HPV in head and neck squamous cell carcinoma. Int J Cancer. 2006;119:1761–6. doi: 10.1002/ijc.22051. [DOI] [PubMed] [Google Scholar]
- 19.Furniss CS, McClean MD, Smith JF, Bryan J, Nelson HH, Peters ES, et al. Human papillomavirus 16 and head and neck squamous cell carcinoma. Int J Cancer. 2007;120:2386–92. doi: 10.1002/ijc.22633. [DOI] [PubMed] [Google Scholar]
- 20.Marsit CJ, Christensen BC, Houseman EA, Karagas MR, Wrensch MR, Yeh RF, et al. Epigenetic profiling reveals etiologically distinct patterns of DNA methylation in head and neck squamous cell carcinoma. Carcinogenesis. 2009;30:416–22. doi: 10.1093/carcin/bgp006. [DOI] [PMC free article] [PubMed] [Google Scholar]
- 21.Bibikova M, Le J, Barnes B, Saedinia-Melnyk S, Zhou L, Shen R, et al. Genome-wide DNA methylation profiling using Infinium® assay. Epigenomics. 2009;1:177–200. doi: 10.2217/epi.09.14. [DOI] [PubMed] [Google Scholar]
- 22.Takai D, Jones PA. Comprehensive analysis of CpG islands in human chromosomes 21 and 22. Proc Natl Acad Sci U S A. 2002;99:3740–5. doi: 10.1073/pnas.052410099. [DOI] [PMC free article] [PubMed] [Google Scholar]
- 23.Bracken AP, Dietrich N, Pasini D, Hansen KH, Helin K. Genome-wide mapping of Polycomb target genes unravels their roles in cell fate transitions. Genes Dev. 2006;20:1123–36. doi: 10.1101/gad.381706. [DOI] [PMC free article] [PubMed] [Google Scholar]
- 24.Lee TI, Jenner RG, Boyer LA, Guenther MG, Levine SS, Kumar RM, et al. Control of developmental regulators by Polycomb in human embryonic stem cells. Cell. 2006;125:301–13. doi: 10.1016/j.cell.2006.02.043. [DOI] [PMC free article] [PubMed] [Google Scholar]
- 25.Schlesinger Y, Straussman R, Keshet I, Farkash S, Hecht M, Zimmerman J, et al. Polycomb-mediated methylation on Lys27 of histone H3 pre-marks genes for de novo methylation in cancer. Nat Genet. 2007;39:232–6. doi: 10.1038/ng1950. [DOI] [PubMed] [Google Scholar]
- 26.Squazzo SL, O’Geen H, Komashko VM, Krig SR, Jin VX, Jang SW, et al. Suz12 binds to silenced regions of the genome in a cell-type-specific manner. Genome Res. 2006;16:890–900. doi: 10.1101/gr.5306606. [DOI] [PMC free article] [PubMed] [Google Scholar]
- 27.Bollati V, Baccarelli A, Hou L, Bonzini M, Fustinoni S, Cavallo D, et al. Changes in DNA methylation patterns in subjects exposed to low-dose benzene. Cancer Res. 2007;67:876–80. doi: 10.1158/0008-5472.CAN-06-2995. [DOI] [PubMed] [Google Scholar]
- 28.Kong KL, Kwong DL, Fu L, Chan TH, Chen L, Liu H, et al. Characterization of a candidate tumor suppressor gene uroplakin 1A in esophageal squamous cell carcinoma. Cancer Res. 2010;70:8832–41. doi: 10.1158/0008-5472.CAN-10-0779. [DOI] [PubMed] [Google Scholar]
- 29.Hoque MO, Begum S, Brait M, Jeronimo C, Zahurak M, Ostrow KL, et al. Tissue inhibitor of metalloproteinases-3 promoter methylation is an independent prognostic factor for bladder cancer. J Urol. 2008;179:743–7. doi: 10.1016/j.juro.2007.09.019. [DOI] [PMC free article] [PubMed] [Google Scholar]
- 30.Wang J, Lee JJ, Wang L, Liu DD, Lu C, Fan YH, et al. Value of p16INK4a and RASSF1A promoter hypermethylation in prognosis of patients with resectable non-small cell lung cancer. Clin Cancer Res. 2004;10:6119–25. doi: 10.1158/1078-0432.CCR-04-0652. [DOI] [PubMed] [Google Scholar]
- 31.Marsit CJ, Liu M, Nelson HH, Posner M, Suzuki M, Kelsey KT. Inactivation of the Fanconi anemia/BRCA pathway in lung and oral cancers: implications for treatment and survival. Oncogene. 2004;23:1000–4. doi: 10.1038/sj.onc.1207256. [DOI] [PubMed] [Google Scholar]
- 32.Ghosh A, Ghosh S, Maiti GP, Sabbir MG, Zabarovsky ER, Roy A, et al. Frequent alterations of the candidate genes hMLH1, ITGA9 and RBSP3 in early dysplastic lesions of head and neck: clinical and prognostic significance. Cancer Sci. 2010;101:1511–20. doi: 10.1111/j.1349-7006.2010.01551.x. [DOI] [PMC free article] [PubMed] [Google Scholar]
- 33.Marsit CJ, Posner MR, McClean MD, Kelsey KT. Hypermethylation of E-cadherin is an independent predictor of improved survival in head and neck squamous cell carcinoma. Cancer. 2008;113:1566–71. doi: 10.1002/cncr.23770. [DOI] [PMC free article] [PubMed] [Google Scholar]
- 34.Huang KH, Huang SF, Chen IH, Liao CT, Wang HM, Hsieh LL. Methylation of RASSF1A, RASSF2A, and HIN-1 is associated with poor outcome after radiotherapy, but not surgery, in oral squamous cell carcinoma. Clin Cancer Res. 2009;15:4174–80. doi: 10.1158/1078-0432.CCR-08-2929. [DOI] [PubMed] [Google Scholar]
- 35.Long NK, Kato K, Yamashita T, Makita H, Toida M, Hatakeyama D, et al. Hypermethylation of the RECK gene predicts poor prognosis in oral squamous cell carcinomas. Oral Oncol. 2008;44:1052–8. doi: 10.1016/j.oraloncology.2008.02.004. [DOI] [PubMed] [Google Scholar]
- 36.Puri SK, Si L, Fan CY, Hanna E. Aberrant promoter hypermethylation of multiple genes in head and neck squamous cell carcinoma. Am J Otolaryngol. 2005;26:12–7. doi: 10.1016/j.amjoto.2004.06.007. [DOI] [PubMed] [Google Scholar]
- 37.Langevin SM, Houseman EA, Christensen BC, Wiencke JK, Nelson HH, Karagas MR, et al. The influence of aging, environmental exposures and local sequence features on the variation of DNA methylation in blood. Epigenetics. 2011;6:908–19. doi: 10.4161/epi.6.7.16431. [DOI] [PMC free article] [PubMed] [Google Scholar]
- 38.Mohn F, Weber M, Rebhan M, Roloff TC, Richter J, Stadler MB, et al. Lineage-specific polycomb targets and de novo DNA methylation define restriction and potential of neuronal progenitors. Mol Cell. 2008;30:755–66. doi: 10.1016/j.molcel.2008.05.007. [DOI] [PubMed] [Google Scholar]
- 39.Baylin SB. Stem cells, cancer, and epigenetics. In: Girard L, editor. StemBook. Harvard Stem Cell Institute, Harvard University; Cambridge: [2010/07/09]. 2008. [PubMed] [Google Scholar]
- 40.Crabb DW, Matsumoto M, Chang D, You M. Overview of the role of alcohol dehydrogenase and aldehyde dehydrogenase and their variants in the genesis of alcohol-related pathology. Proc Nutr Soc. 2004;63:49–63. doi: 10.1079/pns2003327. [DOI] [PubMed] [Google Scholar]
- 41.Pappa A, Brown D, Koutalos Y, DeGregori J, White C, Vasiliou V. Human aldehyde dehydrogenase 3A1 inhibits proliferation and promotes survival of human corneal epithelial cells. J Biol Chem. 2005;280:27998–8006. doi: 10.1074/jbc.M503698200. [DOI] [PubMed] [Google Scholar]
- 42.Afsar NA, Haenisch S, Mateen A, Usman A, Ufer M, Ahmed KZ, et al. Genotype frequencies of selected drug metabolizing enzymes and ABC drug transporters among breast cancer patients on FAC chemotherapy. Basic Clin Pharmacol Toxicol. 2010;107:570–6. doi: 10.1111/j.1742-7843.2009.00531.x. [DOI] [PubMed] [Google Scholar]
- 43.Banh A, Xiao N, Cao H, Chen CH, Kuo P, Krakow T, et al. A novel aldehyde dehydrogenase-3 activator leads to adult salivary stem cell enrichment in vivo. Clin Cancer Res. 2011;17:7265–72. doi: 10.1158/1078-0432.CCR-11-0179. [DOI] [PMC free article] [PubMed] [Google Scholar]
- 44.Leibowitz MS, Andrade Filho PA, Ferrone S, Ferris RL. Deficiency of activated STAT1 in head and neck cancer cells mediates TAP1-dependent escape from cytotoxic T lymphocytes. Cancer Immunol Immunother. 2011 doi: 10.1007/s00262-010-0961-7. [DOI] [PMC free article] [PubMed] [Google Scholar]
- 45.Bandoh N, Ogino T, Katayama A, Takahara M, Katada A, Hayashi T, et al. HLA class I antigen and transporter associated with antigen processing downregulation in metastatic lesions of head and neck squamous cell carcinoma as a marker of poor prognosis. Oncol Rep. 2010;23:933–9. doi: 10.3892/or_00000717. [DOI] [PubMed] [Google Scholar]
- 46.Lou Y, Vitalis TZ, Basha G, Cai B, Chen SS, Choi KB, et al. Restoration of the expression of transporters associated with antigen processing in lung carcinoma increases tumor-specific immune responses and survival. Cancer Res. 2005;65:7926–33. doi: 10.1158/0008-5472.CAN-04-3977. [DOI] [PubMed] [Google Scholar]
- 47.Meissner M, Reichert TE, Kunkel M, Gooding W, Whiteside TL, Ferrone S, et al. Defects in the human leukocyte antigen class I antigen processing machinery in head and neck squamous cell carcinoma: association with clinical outcome. Clin Cancer Res. 2005;11:2552–60. doi: 10.1158/1078-0432.CCR-04-2146. [DOI] [PubMed] [Google Scholar]
- 48.Ogino T, Shigyo H, Ishii H, Katayama A, Miyokawa N, Harabuchi Y, et al. HLA class I antigen down-regulation in primary laryngeal squamous cell carcinoma lesions as a poor prognostic marker. Cancer Res. 2006;66:9281–9. doi: 10.1158/0008-5472.CAN-06-0488. [DOI] [PubMed] [Google Scholar]
- 49.Lopez-Albaitero A, Nayak JV, Ogino T, Machandia A, Gooding W, DeLeo AB, et al. Role of antigen-processing machinery in the in vitro resistance of squamous cell carcinoma of the head and neck cells to recognition by CTL. J Immunol. 2006;176:3402–9. doi: 10.4049/jimmunol.176.6.3402. [DOI] [PubMed] [Google Scholar]
- 50.Nie L, Zhao Y, Wu W, Yang YZ, Wang HC, Sun XH. Notch-induced Asb2 expression promotes protein ubiquitination by forming non-canonical E3 ligase complexes. Cell Res. 2010 doi: 10.1038/cr.2010.165. [DOI] [PMC free article] [PubMed] [Google Scholar]
- 51.Guibal FC, Moog-Lutz C, Smolewski P, Di Gioia Y, Darzynkiewicz Z, Lutz PG, et al. ASB-2 inhibits growth and promotes commitment in myeloid leukemia cells. J Biol Chem. 2002;277:218–24. doi: 10.1074/jbc.M108476200. [DOI] [PubMed] [Google Scholar]
- 52.Chung W, Kwabi-Addo B, Ittmann M, Jelinek J, Shen L, Yu Y, et al. Identification of novel tumor markers in prostate, colon and breast cancer by unbiased methylation profiling. PLoS One. 2008;3:e2079. doi: 10.1371/journal.pone.0002079. [DOI] [PMC free article] [PubMed] [Google Scholar]
- 53.Taylor KH, Pena-Hernandez KE, Davis JW, Arthur GL, Duff DJ, Shi H, et al. Large-scale CpG methylation analysis identifies novel candidate genes and reveals methylation hotspots in acute lymphoblastic leukemia. Cancer Res. 2007;67:2617–25. doi: 10.1158/0008-5472.CAN-06-3993. [DOI] [PubMed] [Google Scholar]
Associated Data
This section collects any data citations, data availability statements, or supplementary materials included in this article.