

Abstract
For tumor therapy with light ions and for experimental aspects in particle radiobiology the relative biological effectiveness (RBE) is an important quantity to describe the increased effectiveness of particle radiation. By establishing and analysing a database of ion and photon cell survival data, some remarkable properties of RBE-related quantities were observed. The database consists of 855 in vitro cell survival experiments after ion and photon irradiation. The experiments comprise curves obtained in different labs, using different ion species, different irradiation modalities, the whole range of accessible energies and linear energy transfers (LETs) and various cell types. Each survival curve has been parameterized using the linear-quadratic (LQ) model. The photon parameters, α and β, appear to be slightly anti-correlated, which might point toward an underlying biological mechanism. The RBE values derived from the survival curves support the known dependence of RBE on LET, on particle species and dose. A positive correlation of RBE with the ratio α/β of the photon LQ parameters is found at low doses, which unexpectedly changes to a negative correlation at high doses. Furthermore, we investigated the course of the β coefficient of the LQ model with increasing LET, finding typically a slight initial increase and a final falloff to zero. The observed fluctuations in RBE values of comparable experiments resemble overall RBE uncertainties, which is of relevance for treatment planning. The database can also be used for extensive testing of RBE models. We thus compare simulations with the local effect model to achieve this goal.
Keywords: relative biological effectiveness, cell survival, ions, local effect model, linear quadratic model
INTRODUCTION
Radiation cancer therapy with carbon ions has been applied successfully in Japan and Germany and will be used in several other locations all around the world in the near future [1–6]. In earlier trials at Berkeley, other ion beams from He to Ar were used for cancer treatments. One major rationale for the application of ion beams in radiotherapy is their enhanced effectiveness compared with conventional X-rays, in particular in the target region. This has given rise to intensified research on the understanding and on the predictability of the biological effect of ions compared with respect to photons, usually parameterized by the relative biological effectiveness (RBE) [7]. The RBE is an important factor to be considered in treatment planning for ion beam therapy, since the prescribed doses have to be correspondingly reduced as compared with the doses given in conventional photon therapy [8, 9].
Generally, the RBE depends on many factors such as the linear energy transfer (LET) at a given tissue depth, the particle species, the dose and the biological endpoint. Due to these complex dependencies, full systematic characterization typically requires meta-analyses based on a combination of different studies. The primary focus of this paper is therefore to compile a large collection of experimental results and to investigate it in order to exhibit further systematic analyses of the relevant quantities. For this purpose, we established a database of cell survival experiments with both photon and ion irradiation published in the literature.
Besides these systematic analyses, such a database is also ideally suited to testing and validating biophysical models that aim to predict the biological effects of ion beams. These models are important tools, for example, in treatment planning, where they are used to estimate the RBE in situations that are not directly experimentally accessible. For example, the local effect model (LEM) has been implemented in treatment planning for a pilot project performed at Gesellschaft für Schwerionenforschung (GSI) [10, 11]; and the potential application of the microdosimetric kinetic model [12, 13] is discussed at the HIMAC/NIRS.
A prerequisite for clinical application of these models is a thorough test and validation by means of in vitro experimental data. Survival experiments are particularly suitable here, as they are comparably easy to perform under well-defined experimental conditions. In the design of our database we have thus put particular emphasis on its applicability for the purpose of model tests and validation.
Assessment of the accuracy of a model requires information about the uncertainty of the experimental data. Most published experiments report statistical errors, which however represent only a lower limit concerning the uncertainty of the data. Unfortunately, there is no unique established way of reporting errors in cell survival values, and indeed a full uncertainty analysis would be demanding as both stochastic and systematic errors would have to be respected. The overall uncertainty can hence be better estimated based on the combination of larger sets of experimental data, for example, from different laboratories, obtained under otherwise identical conditions. For such a dataset, a measure of uncertainty can be derived empirically from the scatter of the data, which have been obtained from comparable situations. The large database presented in this paper thus is also ideally suited to analyze fluctuations from which the overall uncertainty of RBE can be assessed directly on purely experimental grounds. In previous attempts the use of a data collection to analyze systematic variations of RBE specifically for protons has been proven to be very fruitful [14].
In this publication, we report on the set up of a database containing results of more than 800 cell survival experiments from different laboratories all over the world, using different cell types and different ions at various energies. Throughout this paper, we call this collection ‘Particle Irradiation Data Ensemble,’ in short, PIDE. We used the database to reveal known and new systematics of the RBE and its related quantities. We (i) evaluated statistical properties of the photon linear-quadratic (LQ) parameters and found that they are slightly anti-correlated; (ii) we investigated the evolution of the quadratic coefficient β of the LQ model with LET, which is under current discussion; and (iii) we report on a survival-dependent systematic variation of the RBE with the photon α/β ratio. Moreover we demonstrate the capability of the database for RBE model validation.
MATERIALS AND METHODS
Conception of the database
The main task in the development of the database was to combine a variety of experimental results of ion irradiation experiments with in vitro cell lines including the early experiments from Berkeley, the huge datasets of studies from Japan and the experiments carried out in Europe. After a thorough literature survey, we introduced some restriction for the selection of the publications that we included in the data ensemble. One of these restrictions was that we only included publications for which the LQ parameters of the response to photons as reference radiation were available or derivable. This allows the determination of the RBE values to any survival level from the LQ parameters (provided the LQ model holds, which is still under debate for high doses [15–17]). We believe that we have covered in the database a good fraction of all published survival experiments in peer-reviewed journals under these restrictions.
Currently the PIDE contains 855 measured ion cell survival curves, taken from 77 publications (see Table 1). The cell lines under investigation range from radio-resistant cells with a shoulder, to radio-sensitive cells without a visible shoulder in the photon dose–response curve. Within all experiments, 182 different photon dose–response curves were used as a reference to calculate RBE values. In the experiments about 80 different cell lines were investigated. When investigating their properties, it becomes evident that cells of the same cell line may behave differently depending on experimental factors or age of the cell line. In fact, cell lines that are equal by origin and name, but maintained for years at different institutions might not show identical responses to radiation and thus have to be better distinguished by author/institution rather than pooled in the database.
Normal cells were used for 673 curves and tumour cell lines were used for 182 curves. In some cases mutated or specially treated cells with repair deficiencies were investigated. In 52 experiments, the cells were irradiated predominantly in a specified cell cycle phase, in the other 803 experiments the cells were irradiated in an asynchronous population. In 372 experiments human cell lines were used, in 483 experiments rodent cell lines were used. Among the latter, V79 cells have been studied most often and results were reported in 29 of the 77 publications included in the PIDE. Among all the experiments, 352 were carried out with carbon ions, 186 with lighter (p-B) and 317 with heavier ions (N to U). A total of 103 experiments were carried out with a shaped beam in a spread-out Bragg peak or the entrance channel, but the majority (752 experiments) were carried out under track segment conditions with monoenergetic ion beams. Throughout the text we use the term ‘monoenergetic’ whenever a beam is not a shaped beam to provide an extended peak. One should keep in mind that such a monoenergetic beam nevertheless may show an energy distribution and may be subject to fragmentation. This is in particular the case when a primary beam is decelerated by passive elements after exiting the accelerator. As can be seen from Table 1, the publications typically focus on one special aspect within all possible combinations of the factors listed above.
Table 1.
Content of the PIDE, sorted by publications
| No. | Author/year/ref. | No. s.c.a | Cell lines | Cell typeb | Cell cyclec | Cell origind | α/β (Gy) | Ion species | Irr. cond.e | LET (keV/µm)f | E (MeV/u)f | Phot.g | Remarksh |
|---|---|---|---|---|---|---|---|---|---|---|---|---|---|
| 1 | Chapman et al., 1977 [18] | 13 | V79 | n | s | r | 2.22 | 4He, 12C, 20Ne, 40Ar | s | 2.34–402.7 | 26.1–319.0 | 220 | LET given |
| 2 | Chapman et al., 1978 [19] | 9 | V79, T1 | n | a, s | h, r | 2.17–3.80 | 12C | s | 12.16–74.99 | 26.1–319.0 | 220 | LET given |
| 3 | Blakely et al., 1979 [20] | 24 | T1 | n | a | r | 2.13 | 12C, 20Ne, 40Ar | m | 11–419 | 10.7–389.0 | 220 | |
| 4 | Raju et al., 1991 [21] | 5 | CHO-10B, HS-23, C3H_10T1/2, V79, AG1522 | n | a | r | 4.33–20.0 | 4He | m | 121–136 | 0.65–0.8 | Co | |
| 5 | Goodhead et al., 1992 [22] | 10 | HeLa, HeLa S3, C3H 10 T1/2 | n | a | h, r | 5.39–30.0 | 1H, 4He | m | 20.27–23.915 | 1.16–8.8 | 250 | |
| 6 | Folkard et al., 1996 [23] | 10 | V79 | n | a | r | 2.71 | 1H, 2H, 3He, 4He, 12C, 16O | m | 10.1–105.8 | 0.465–3.66 | 240 | |
| 7 | Eguchi-Kasai et al., 1996 [24] | 22 | irs1, irs2, L5178Y, M10, LTA, SL3-147 | n | a | r | 0.06–31.1 | 4He, 12C, 20Ne | m | 18–327 | 3.1–123.2 | 200 | |
| 8 | Suzuki et al., 1997 [25] | 7 | HE20 | n | s | h | 0.67 | 20Ne | m | 63–335 | 14.3–120.3 | Cs | |
| 9 | Bettega et al., 1998 [26] | 8 | C3H 10T1/2 | n | a | r | 15.0 | 1H, 2H | m | 6.65–33.2 | 0.72–4.89 | Co | |
| 10 | Tsuboi et al., 1998 [27] | 20 | NB1RGB, ONS-76, A-172, U251MG, TK-1 | n, t | a | h | 0.13–6.89 | 12C | m | 20–105 | 17.4–144.0 | Cs | |
| 11 | Tsuchida et al., 1998 [28] | 6 | A172, TK1 | t | a | h | 2.23–2.98 | 12C | m | 20–80 | 24.1–144.0 | Cs | |
| 12 | Weyrather et al., 1999 [29] | 21 | V79, CHO-K1, xrs5 | n | a | r | 3.57–∞ | 12C | m | 13.7–482.7 | 2.4–266.4 | 250 | Corrected |
| 13 | Furusawa et al., 2000 [30] | 138 | V59, HSG, T1 | n | a | h, r | 0.52–9.2 | 3He, 12C, 20Ne | m | 18.5–654 | 1.27–131 | 200 | Values for α and D10 given; Corrected |
| 14 | Suzuki et al., 2000 [31] | 30 | NB1RGB, HFL-III, LC-1sq, A-549, C32TG, Marcus, U-251MGKO, SK-MG-1, KNS-89, KS-1, A-172, ONS-76, KNS-60, Becker, T98G, SF126 | n, t | a | h | 0.59–21.3 | 12C | m | 13.3–77.1 | 25.1–271.2 | 200 | Corrected |
| 15 | Belli et al., 2000 [32] | 12 | HF19, M10, SCC25, SQ20B | n, t | a | h | 7.65–∞ | 1H | m | 7.7–33 | 0.69–5.24 | Cs + Co | |
| 16 | Tsuruoka et al., 2005 [33] | 41 | NB1RGB | n | a | h | 17.47 | 12C, 20Ne, 28Si, 56Fe | m | 13–400 | 19.5–500 | 200 | Values for RBE10 given |
| 17 | Belli et al., 2008 [34] | 37 | HF19, M10, SCC25, SQ20B, V79 | n, t | a | h, r | 4.41–∞ | 12C | m, s | 13–303 | 4.5–290 | Cs + Co | <LETD> given |
| 18 | Belli et al., 1998 [35] | 6 | V79 | n | a | r | 2.80 | 1H | m | 7.7–34.6 | 0.57–5.01 | No X-ray energy given; Data in parts taken from Belli et al., 1993 [36] | |
| 19 | Hall et al., 1977 [37] | 3 | V79 | n | a | r | 3.24 | 40Ar | s | 110.9–409.2 | 48–330 | 250 | <LETD> given |
| 20 | Bird and Burki, 1975 [38] | 6 | V79 | n | a | r | 18.6 | 4He, 7Li, 11B, 12C, 20Ne, 40Ar | m | 19.1–2000 | 5.09–9.93 | 145 | Low X-ray energy; X-ray curve taken from Sinclair and Morton, 1966 [39] |
| 21 | v. Neubeck, 2009 [40] | 6 | RAT-1, IEC-6 | n, t | a | r | 6.69–15.9 | 12C | m | 13.3–163 | 9.9–270 | 250 | |
| 22 | Perris et al., 1986 [41] | 2 | V79 | n | a | r | 25.5 | 1H | m | 6–12 | 3–7.4 | Co | |
| 23 | Bettega et al., 1983 [42] | 3 | EUE | n | a | h | 211 | 1H | m | 1.83–5.8 | 8–31 | Co | Photon data taken from Bettega et al., 1979 [43] |
| 24 | Cox et al., 1977 [44] | 4 | V79, HF19 | n | a | h, r | 5.52–∞ | 4He | m | 20–68 | 1.9–8.8 | 250 | |
| 25 | Wouters et al., 1996 [45] | 11 | V79 | n | a | r | 2.73 | 1H | s | 2.33–6.23 | 6.8–22.8 | 250 | <LETD> given |
| 26 | Combs et al., 2009 [46] | 4 | U87-MG, LN229 | t | a | h | 4.53–6.52 | 12C | m, s | 103–170 | 9.8–18 | 250 | <LETD> given |
| 27 | Kitajima et al., 2010 [47] | 10 | SuSa, AT1OS | n | s | h | ∞ | 12C | m | 24–200 | 35–450 | 150 | Low X-ray energy; values for RBEα given |
| 28 | Blomquist et al., 1993 [48] | 2 | LS-147T, V79 | n, t | a | h, r | 3.65–∞ | 1H | s | 4 | 11.6 | Co | <LETD> given |
| 29 | Yang et al., 1985 [49] | 9 | C3H 10T1/2 | n | a | r | 0.36–13.4 | 12C, 20Ne, 28Si, 56Fe, 238U | m | 10.5–2080 | 103–990 | 225 | E and LET from remaining range |
| 30 | Miller et al., 1995 [50] | 10 | C3H 10T1/2 | n | a | r | 2.80 | 1H, 2H, 3He, 4He, 12C, 16O | m | 3.8–418 | 0.275–12.9 | 250 | |
| 31 | Czub et al., 2008 [51] | 4 | CHO | n | a | r | 8.5 | 12C, 20Ne | m | 438–1245 | 1.69-2.78 | Co | |
| 32 | Kamlah et al., 2011 [52] | 1 | A594 | t | a | h | 11.6 | 12C | m | 168 | 9.9 | 6 MV | |
| 33 | Aoki et al., 2000 [53] | 6 | V79 | n | a | r | 7.95 | 12C | m | 13–237 | 6.4–283 | 200 | |
| 34 | Han et al., 1998 [54] | 6 | SHE | n | a | r | 13.7 | 12C, 26Si | m | 13–400 | 18.5–283 | 250 | |
| 35 | Hamada et al., 2010 [55] | 8 | H1299 | t | a | h | 0.95 | 12C, 20Ne, 26Si, 40Ar, 56Fe | m | 13–200 | 20–600 | 200 | |
| 36 | Claesson et al., 2011 [56] | 6 | V79 | n | a, s | r | 4.33–∞ | 4He | m | 110 | 1.625 | 100 | Low X-ray energy |
| 37 | Wedenberg et al., 2010 [57] | 5 | T1 | n | a | h | 9.00 | 4He | m | 25–165 | 0.46–6.8 | 250 | |
| 38 | Miller et al., 1990 [58] | 1 | C3H 10T1/2 | n | a | h | 2.80 | 2H | m | 40 | 0.55 | Photon data taken from Miller, 1995 [50] | |
| 39 | Tobias et al., 1980 [59] | 2 | V79 | n | s | r | 11.5–21.3 | 40Ar | m | 370 | 55 | 220 | E and LET from remaining range |
| 40 | Cox and Masson, 1979 [60] | 7 | HF19 | n | a | h | ∞ | 4He, 11B, 14N | m | 20–470 | 1.24–10.3 | 250 | |
| 41 | Ito et al., 2006 [61] | 7 | HL-60 | t | a | h | 4.78 | 12C, 26Si, 56Fe | m | 20–440 | 26–126 | 4 MV | |
| 42 | Tilly et al., 1999 [62] | 3 | V79 | n | a | r | 3.73 | 4He, 14N | m | 6–165 | 14.4–39 | Co | |
| 43 | Thacker et al., 1979 [63] | 6 | V79 | n | a | r | 3.90 | 4He, 11B, 14N | m | 28–470 | 1.24–10.3 | Co | |
| 44 | Hirayama et al., 2009 [64] | 5 | V79 | n | a | r | 3.57 | 12C, 56Fe | m | 20–2106 | 16–416 | 200 | |
| 45 | Hirayama et al., 2005 [65] | 1 | CHO | n | a | r | 3.23 | 12C | m | 79.6 | 24 | 200 | |
| 46 | Curtis et al., 1982 [66] | 28 | R-1 | t | a | r | 2.26 | 12C, 20Ne, 40Ar | s | 11–750 | 19.5–428 | 225 | <LETD> given |
| 47 | Boehrnsen et al., 2002 [67] | 2 | V79 | n | a | r | 2.50 | 12C | m | 27.5–153 | 10.2–92.5 | 6 MV | |
| 48 | Fournier et al., 2001 [68] | 4 | AG1522B, PS1 | n | a | h | 13.5–25.6 | 12C, 48Ni | m | 16.6–2455 | 9.9–195 | 250 | |
| 49 | Wulf et al., 1985 [69] | 106 | B14FAF28, V79 | n | a | r | 11.7–14.3 | 12C, 16O, 40Ca, 40Ar, 48Ti, 56Fe, 58Ni, 84Kr, 132Xe, 142Nd, 208Pb, 238U | m | 150–15 800 | 0.1–400 | Values for cross- sections given; photon parameters taken from Wulf, 1983 [70] and Kraft, 1987 [71] | |
| 50 | Scholz, 2003 [72] | 8 | CHO, V79 | n | a | r | 3.58–11.4 | 12C, 16O, 20Ne, 238U | m | 13.3–16 500 | 5–396 | Photon parameters adapted from Weyrather et al., 1999 [29] | |
| 51 | Persson et al., 2002 [73] | 3 | AA | t | a | h | 0.98 | 10B | m | 40-160 | 6.6–36.6 | Co | |
| 52 | Yang and Tobias, 1984 [74] | 2 | C3H 10 T1/2 | n | a | r | 1.07–2.07 | 56Fe, 238U | m | 500–1900 | 300–960 | 225 | |
| 53 | Scholz et al., 1997 [10] | 8 | CHO | n | a | r | 6.43 | 12C, 16O | m | 13.5–265 | 11–395 | 250 | |
| 54 | Prise et al., 1990 [75] | 4 | V79 | n | a | r | 4.07 | 1H, 4He | m | 16.9–108 | 0.76–1.9 | 250 | |
| 55 | Terato et al., 2008 [76] | 4 | AA8 | n | a | r | 30.0 | 12C | m | 13–200 | 43–290 | Co | |
| 56 | Suzuki et al., 1996 [77] | 8 | HE | n | s | h | 0.66 | 12C | m | 22–230 | 6.6–126 | Cs | |
| 57 | Matsumoto et al., 2008 [78] | 6 | C32TG, Colo679, HMV-I, HMV-II, 92-1, MeWo | t | a | h | 3.29–68 | 12C | s | 50 | 43.4 | 200 | <LETD> given |
| 58 | Mehnati et al., 2005 [79] | 13 | CHO | n | a | r | 11.65 | 12C, 20Ne, 40Ar, 56Fe | m | 20–2000 | 13–144 | 200 | |
| 59 | Stenerloew et al., 1995 [80] | 10 | HTh7, B16, IGR, V79, LS-174T, U-343MG, DU-145 | n, t | a | h, r | 0.91–∞ | 4He, 14N | s,m | 40–125 | 3.82–20.3 | Co | Unclear if LET or <LETD> given |
| 60 | Okayasu et al., 2006 [81] | 10 | CHO, xrs6, xrs6-hamKu80, HFLIII, 180BR | n | a | h, r | 2.70–∞ | 12C, 56Fe | m | 70–200 | 28.5–430 | No X-ray energy given | |
| 61 | Tsuboi et al., 2007 [82] | 9 | U87MG, TK1 | n, t | a | h | 2.31–6.25 | 12C | m | 20–80 | 24–144 | Cs | |
| 62 | Todd, 1975 [83] | 10 | ChangHL, M3-1 | n | a | h, r | 0.64– 10.42 | 7Li, 11B, 12C, 14N, 16O, 20Ne, 40Ar | m | 55–1940 | 5.3–7 | 50 | Low X-ray energy |
| 63 | Hall et al., 1972 [84] | 1 | V79 | n | a | r | 41.1 | 4He | m | 106 | 1.3 | 210 | |
| 64 | Takahashi et al., 2000 [85] | 8 | A172, A172neo, A172mp53, TG98G | t | a | h | 0.14–0.92 | 4He, 12C | s | 70–156 | 0.51–28.5 | 150 | Low X-ray energy; <LETD> given |
| 65 | Takahashi et al., 2004 [86] | 12 | H1299wtp53, H1299tp53, H1299tp53-null | t | a | h | 0.00–2.56 | 12C | m | 30–100 | 18.5–83 | 200 | |
| 66 | Matsuzaki et al., 1998 [87] | 3 | OCUB-M, CRL-1500, YMB-1 | t | a | h | 4.45–21.3 | 12C | s | 80 | 24 | 200 | <LETD> given; corrected |
| 67 | Kronenberg et al., 2009 [88] | 1 | Aprt | n | a | r | ∞ | 56Fe | m | 151.4 | 1000 | 150 | Values for D0 given; low X-ray energy |
| 68 | Hamada et al., 2006 [89] | 6 | AG01522 | n | a | h | ∞ | 4He, 12C, 20Ne, 40Ar | m | 16.2–1610 | 7–25.5 | Co | Values for D0 given |
| 69 | Zhou et al., 2006 [90] | 1 | V79 | n | a | r | 3.63 | 12C | m | 100 | 18.5 | 200 | |
| 70 | Jenner et al., 1993 [91] | 1 | V79 | n | a | r | 2.2 | 4He | m | 120 | 0.81 | Co | |
| 71 | Furusawa et al., 2002 [92] | 2 | V79 | n | a | r | 7.15–11.4 | 40Ar, 58Fe | m | 86–442 | 115–575 | 150 | Low X-ray energy |
| 72 | Takahashi et al., 2001 [93] | 8 | SASmp53, SASneo | t | a | h | 3.77–10.0 | 12C | m | 30–150 | 11–83 | 150 | Low X-ray energy |
| 73 | Bettega et al., 2005 [94] | 5 | AG1522 | n | a | h | ∞ | 26Si, 48Ti, 56Fe | m | 56–442 | 200–1000 | Co | |
| 74 | Ibañez et al., 2009 [95] | 3 | B16-F0 | t | a | r | 2.17 | 1H, 6Li | m | 3.4–135 | 2.9–14.4 | Cs | |
| 75 | Hellweg et al., 2011 [96] | 2 | HEK | n | a | h | 2.55 | 13C | m | 33–73 | 28–72 | 150 | Low X-ray energy |
| 76 | Napolitano et al., 1992 [97] | 1 | C3H 10T1/2 | n | s | r | 9.0 | 4He | m | 177 | 0.45 | 80 | Low X-ray energy |
| 77 | Hill et al., 2004 [98] | 7 | V79-4, irs1, irs2, irs3, CHO-K1, xrs5 | n | a | r | 3.7–∞ | 4He | m | 121 | 3.26 | 250 |
Notes: For each publication, the first author, along with the year of publication, as well as the number of survival curves taken into the PIDE are given. Furthermore, summarizing properties of the used cells and radiation qualities are provided.
a No. s.c. = number of survival curves described in the publication.
b cell type: n = normal, t = tumor.
c cell cycle: a = asynchronous, s = synchronized in a particular phase of cell cycle.
d cell origin: h = human, r = rodent.
e irradiation conditions: m = monoenergetic, s = within a spread out Bragg peak.
f values given in italics if not given in the publications.
g X-ray energy in kVp or photon energy in MV for clinical accelerators if this unit is given, or Co = 60Co and Cs = 137Cs source.
h If linear quadratic parameters are not directly taken from figures or tables or from accessible survival values, the procedure is outlined here. Correction: shifting of one determined LQ parameters if the other is smaller than 0. Also other comments are given in this column. For spread out Bragg peaks, the quantities LET and 〈LETD〉 refer to track and dose averaged LET values, respectively.
Technically, for each of the 855 experiments, there is one entry in the PIDE, in which the LQ parameters of the ion response curve are listed along with other information such as LQ parameters of photon response, cell type, LET, energy, etc. The entries are stored separately for each publication in two text files, one of which contains information given in the publication and the other contains information taken from related publications or quantities that have been derived (such as calculated RBE values or LET values for a given particle energy). In this way, information contained in new publications can be easily added into the PIDE. Within an entry the information is stored in variables, which are given a name and a value (such as LET and 120 keV/µm, for example). Table 2 gives an overview of all quantities required for each entry. Additional variables may be defined at any time in any entry, for example, for calculated RBE values or, for later use, oxygenation status.
Table 2.
Required information for each experiment in the PIDE
| Quality | Content |
|---|---|
| ID | Running number labeling the publication |
| Paper | Short name of the publication, containing first author and year of publication |
| No | Running number labeling the entry within a publication |
| Ion | Ion species |
| Charge | Charge of ions |
| Irrmods | Irradiation modalities (monoenergetic or spread out Bragg peak) |
| LET | Linear energy transfer in water (in keV/µm, for irradiation in spread out Bragg peak dose mean or track averaged LET) |
| E | Specific energy of ions (in MeV/u, evaluated at the target) |
| Cell | Name of cell line |
| Phase | Information on cell cycle phase |
| Type | Tumor or normal cells |
| Genl | Genomic length of diploid cells (in 109 bp, 5.6 for rodent and 6 for human cells) |
| αX | Linear coefficient of LQ model (in Gy−1 for response to photon reference radiation) |
| βX | Quadratic coefficient of LQ model (in Gy−2 for response to photon reference radiation) |
| αI | Linear coefficient of LQ model (in Gy−1 for response to ion radiation) |
| βI | Quadratic coefficient of LQ model (in Gy−2 for response to ion radiation) |
The PIDE contains data obtained for a broad variety of experimental factors, both biological and physical in nature. However, the intention is not to pool all experiments. Rather the database allows one to easily extract a subset of experiments fulfilling certain requirements (such as all cells with a small α/β ratio irradiated with monoenergetic carbon ions) for which, for example, RBE dependence on further parameters (such as LET) can be investigated.
Sources of the data
Our requirements for the selection of the publications for the data ensemble were as follows. (i) We required the data included in the PIDE to be published in peer-reviewed journals or PhD theses. Both types of publications seem to be sufficiently reviewed, and in general accessible via libraries from anywhere. (ii) We only took publications into account in which data on ion radiation and photon radiation response were provided or where the latter were found in references or could be derived. For photon experiments generally only hard X-rays or 60Co or 137Cs γ-rays have been required as reference radiation. For RBE evaluations, the slightly differing effectiveness between different photon radiation qualities of these groups has been neglected. If X-rays with energies below 200 kVp were used, effectiveness could be enhanced. The corresponding publications have been indicated in Table 1. (iii) The radiation quality had to be described in the publication in sufficient detail, i.e. either LET (or track or dose-averaged LET for irradiation in a spread out Bragg peak), the specific energy on the target or the remaining range of primary particles was required to be reported in all publications included in the PIDE. The quantities not given explicitly in the publications appear in italics in Table 1. (iv) LQ parameters or related quantities (from which LQ parameters could be derived) had to be given either numerically or as figures (typically the survival curves) in the publications. If quantities other than LQ parameters or survival levels were presented in the publications, it is mentioned in Table 1. (v) Experiments with monoenergetic ions were excluded if track segment conditions were not fulfilled. (vi) Some additional information is requested. A list of all information for the required variables is given in Table 2.
Extraction of relevant parameters
Once the publications forming the basis of the PIDE were selected, the relevant information was extracted. Here the following procedures were applied:
LET and energy
If both LET and energy for a given ion species were given in a publication, both values were taken into the PIDE. If only LET or energy was given in a publication, its counterpart was determined from precalculated energy loss tables used within the treatment planning system TRiP98 [11, 99]. These encompass ions from protons to neon within the energy range of 0.1–1000 MeV/u. For ion species where no such tables are available, i.e. in particular for heavier ions that are not relevant in treatment planning, it was calculated using the computer code ATIMA developed at GSI, which performs energy loss calculations for charged particles in matter based on tabled cross sections [100]. Note that for a given energy value, slightly differing LET values may occur depending how the LET was obtained.
For irradiations in spread out bragg peak (SOBP) the dose-averaged LET was used as a representative quantity, if given in the publications. However, it should be noted that the dose-averaged LET is not always a good quantity to describe the radiation field and might be a misleading concept. This is in particular the case for SOBP with large depths and/or extensions, where the radiation field is a complex mix of LET components and hence the corresponding LET spectrum should be respected. Nevertheless, since these details cannot be represented in the database, we take (dose) average LET values as surrogates to reflect the complex radiation field.
LQ parameters of photon and ion dose–response curves
In about a third of all publications, numerical values for the LQ coefficients were presented, while in the majority the measured survival curves were shown in figures. These two cases will be discussed in more detail now. Note that in some rare cases different quantities such as RBE values or cross sections were given either numerically or in figures.
If LQ parameters were published as numbers they were simply copied into the PIDE. If other quantities were given as numbers, the corresponding LQ parameters were calculated. In some cases, one of the LQ parameters was reported or obtained with a negative value, which may occur due to either statistical fluctuations or systematic deviations from LQ behaviour. Then a purely linear or purely quadratic dose response (i.e. shifted β or α to zero) was assumed and the remaining LQ parameter was correspondingly shifted according to the formalism presented in the next section on the fit-induced anti-correlation between α and β. This formalism quantifies how a shift in one parameter approximately compensates for setting the other artificially to zero.
If no numerical values for the LQ parameters were presented but instead only the survival curves figures, the LQ parameters were derived from the graphs. For that purpose a computer program was developed and used to digitize the data points in the figures. Then the LQ parameters were been determined by fitting a second order polynomial with an ordinary χ2 fit to the effect, i.e. the negative logarithm of the survival. We are aware that there are more sophisticated methods to derive LQ parameters from a measured survival curve, which take into account the correlation of the fit parameters by means of their covariance. However, as these methods are rarely used and the resulting fit parameters do not differ too much, we applied the conventional fit procedure, in line with most of the publications that provide numerical values for LQ parameters. If by visual inspection the quadratic coefficient β could not be reliably determined by curve fitting (e.g. when there were only a few data points and the errors of the fit parameters were large) only a straight line fit was performed and β was set to zero. Similarly, if an LQ fit yielded one negative fit parameter, a purely linear or purely quadratic fit was used, which is analogous to the shifting of parameters as described above, when numerical values are given in the publications.
Cell cycle
If no statements were made it was assumed that the cells were irradiated as an asynchronous population.
Fit induced anti-correlation of LQ parameters
In the following section the anti-correlation of LQ parameters due to the fit procedure shall be investigated. Consider an LQ dose–response curve with non-vanishing coefficients α and β. If α is set artificially to zero one can ask how β must be changed to get an appropriate quadratic fit. Likewise, if β is set artificially to zero one can ask how α must be changed to get an appropriate linear fit.
Mathematically, this question can be answered to a good approximation analytically. We assume that all dose points are continuously distributed and introduce a generalized χ2 value on continuous functions. Let f1 and f2 be two functions, so the well known sum of least squares converts into an integral over least squares in the continuous formulation:
| (1) |
The integral has to be evaluated over some interval, and the χ2 value is then a distance measure for two functions on that interval.
For approximating an LQ curve with a purely quadratic one we have to evaluate:
 |
(2) |
where β′ is the shifted β parameter used to replace the original LQ parameters α and β. In Eq. (2) Dmax is the dose up to which the survival curve was recorded and is typically in the order of 5–10 Gy for experiments with photons and 3–7 Gy for ions.
Setting the derivative of χ2 with respect to β' to zero and solving for β′ results in:
| (3) |
Consequently, if α <0 we may lower the β term by means of that expression to compensate for α and thus get an estimator for the best purely quadratic fit.
In the opposite case where a purely linear fit is requested the corresponding equation reads:
| (4) |
Again, if β <0, which may happen ‘by accident’ when, for example, only a small number of dose points are available in an experiment, we may lower α by means of that expression to compensate for β and thus get an estimator for the best purely linear fit. Equations (3) and (4) were used to correct the LQ parameters in the PIDE if one of the parameters was given numerically as a negative value in the publications. The publications for which this procedure was applied were marked with ‘corrected’ in Table 1.
RESULTS
Photon dose response
To obtain an overview about the variety of cell lines forming the basis of the PIDE, we first looked at their photon response. Note that here with the term ‘cell line’, we understand not only the classification by name (such as V79) but also their sensitivity to radiation, as cell lines with the same name might show a different behaviour dependent on their history. Figure 1 shows frequency histograms of α and β among all cell lines included in the PIDE. While α shows a peak at relatively small values with a wide falloff beyond, the distribution of β is not so skewed and peaked at intermediate values. In addition the histogram of β shows a pronounced first bin, which reflects the fact that several cell lines show a purely linear response to photon radiation. Typically, α is found in the range 0.05–0.5 Gy−1 and β in the range 0.01–0.07 Gy−2. The mean values are < α > = 0.32 Gy−1 and < β > = 0.039 Gy−2, while the medians are αm = 0.20 Gy−1 and βm = 0.033 Gy−2. Here, the brackets < . > denote averaged quantities. However, these quantities have to be taken with care, as the underlying distributions are non-symmetric and therefore the means and medians do not reflect the most likely values of the LQ parameters, i.e. the maxima of the presented histograms.
Fig. 1.
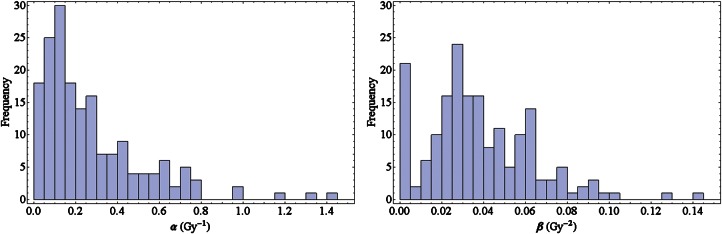
Histograms of the linear-quadratic parameters α (left) and β (right) for photon dose response curves of the cell lines of the experiments included in the PIDE.
For clinical applications, often the ratio α/β of the photon LQ parameters is of interest and is used to classify the tissue type. In Fig. 2 the histogram of this quantity is shown. Clearly, the typical spectrum of α/β up to 10 Gy is covered quite uniformly in the PIDE. Values beyond occur less often. However, there are also 18 cases where β is zero and hence the α/β ratio diverges.
Fig. 2.
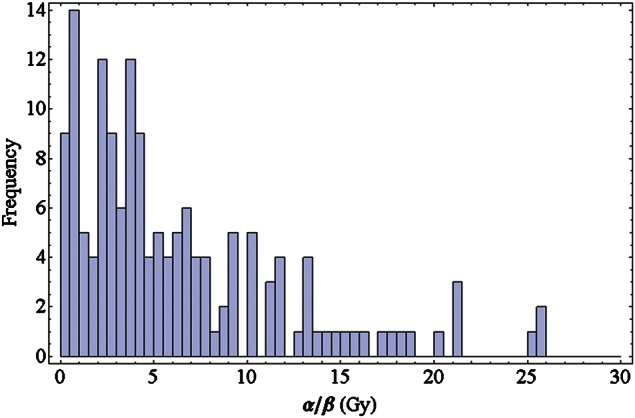
Histogram of the ratio α/β for photon dose–response curves of the cell lines used in experiments included in the PIDE.
In order to investigate the interdependence of the LQ parameters, Fig. 3 displays the quadratic LQ parameter β plotted against the linear parameter α. As a trend, survival curves with a very prominent β term typically are found for small α values. Likewise, very large values of α occur mostly at rather small values of β. In particular the cell lines without a β component have a steep exponential survival curve, i.e. show a large α. This trend suggests the existence of a small anti-correlation between the LQ parameters. Indeed, a linear regression reveals a negative slope of (–0.0204 ± 0.0056) Gy−1, where the uncertainty is given by the standard error of the fit parameters. Figure 3 contains the corresponding linear regression line. The fit parameter errors make up a 68% confidence interval, but even the corresponding 95% confidence interval only covers negative slopes (from –0.0314 to –0.0093), thus indicating significance to that confidence level. As a further check, we performed a hypothesis test on the correlation coefficient between α and β. The coefficient is r = –0.262 and the P-value is P = 0.0002, which shows that it significantly differs from zero on a 95% confidence level.
Fig. 3.
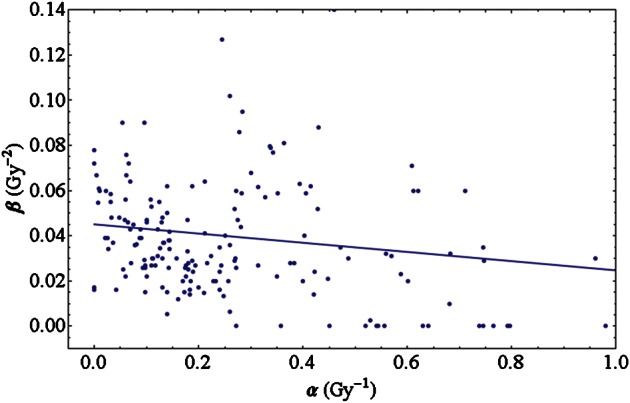
Photon linear-quadratic parameters of the cell lines of the experiments included in the PIDE plotted against each other. Higher values of β occur for small values of α only. The straight line emerges from a linear fit to the data points.
Dose response to ion irradiation
In addition to the quantities that play a role for photon irradiation, the LET is another factor to take into account for particle irradiation. All the following analysis has been performed using information from experiments with monoenergetic beams only, to avoid peculiarities due to broad LET distributions as present in extended Bragg peaks.
Cell type specificity of RBE
For the investigation of ion dose responses in the PIDE, we calculated RBE values from the LQ parameters. Note that these may deviate from directly measured RBE values (i.e. the ratio of doses needed for a fixed effect), in particular for higher doses where it is under discussion as to whether the LQ model is valid any more [15, 16]. To investigate the impact of LET on radio-sensitivity we show the RBE plotted against LET for different particle species in Fig. 4. We restricted the analysis to the RBEα and RBE10 corresponding to the initial slope (upper row) and 10% survival level (lower row), respectively. All cells were classified into two classes of low and high photon α/β ratios with values below or above 4 Gy, respectively (left and right columns, respectively). The latter distinction is somewhat arbitrary, and pooling the data in classes of intervals of α/β is a questionable procedure, as RBE generally depends on this quantity. However, as the scatter of the RBE values even for small intervals of α/β is quite large, categorizing into two classes is appropriate at least for demonstrating the dependence on α/β in a plot. Below, this dependence is investigated in more detail. For individual cell lines, systematics of this kind have been frequently evaluated [29, 30]. It was found that (i) the characteristics provide a maximum in RBE dependent on the particle species, where heavier particles have the maximum at higher LET values; (ii) that lighter particles provide higher RBEs for a fixed LET; and (iii) that the RBE decreases with increasing dose, i.e. with decreasing survival level. All findings are confirmed with the PIDE. While these trends might not be detectable due to fluctuations when only a few survival curves are considered, they are clearly observed in the present data ensemble.
Fig. 4.

RBE for monoenergetic ion beams in the limit of full survival level (upper row) and 10% survival level (lower row) vs. LET for experiments with shouldered (left column, α/β = 1–4 Gy) and less shouldered (right column, α/β = 4–30 Gy) photon dose–response curves. The colors refer to different ion species (p: red; He: blue; C: gray; Ne: orange; heavier ions than Ne: green). Note the different scales of RBE in the upper and lower row. Clearly, lighter particles show a maximum at lower LETs and have higher RBE values for a given LET.
LET dependence of β
There is an on-going discussion about the evolution of the β-term with increasing LET [101], debating whether β increases or decreases with rising LET. The ratio β/βγ, where βγ denotes the value of β for photon radiation, is an interesting quantity to look at because, at low LET where the radiation becomes photon like, this ratio converts to one. In Fig. 5 this ratio is plotted against LET for monoenergetic ions. The figure includes different ion species with the same colour coding as in Fig. 4.
Fig. 5.
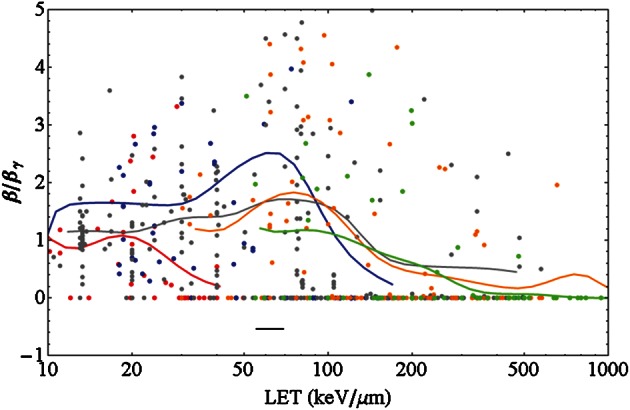
Ratio of the linear-quadratic parameter β of ions to that of photons vs. LET for monoenergetic ions for different ion species with color coding as in Fig. 4. The solid lines are running averages generated by a convolution of the data points with a Gaussian function of width of 0.1 in the decadic logarithmic scale of LET values in keV/µm (i.e. a tenth of the interval between 10 and 100 keV/µm, see the black horizontal bar for an indication of that width). Lighter particles show a vanishing β at lower LET.
The data shown are pooled for all photon α/β ratios, and it was checked that in contrast to the α term β depends only slightly on α/β. For intermediate and high LET values many data show a vanishing β term. For all ions a running average curve is also provided in the plot. It was calculated by summing contributions from all data points with a Gaussian weighting, i.e. for a given LET the running average is mostly determined by data points close to that LET (on the logarithmic scale), while data points further away have a smaller impact on the running average. The general trend, an increase at low LETs followed by a decrease at higher LETs, is obvious and is seen for all ion species except for protons, where the initial increase is not that obvious. Similar to the RBE maximum, the falloff for β is shifted to higher LET values for heavier ions. However, it should be noted that the fluctuations of the data points around these average curves are huge, as usually β is much harder to fix in a fit procedure than α.
Relevance of dose level and α/β ratio for RBE
In Fig. 6 we show RBE values for monoenergetic carbon ions within an LET window of 70–130 keV/µm. This range of LETs is typically found in a spread out Bragg peak, and the results may be henceforth regarded to be representative. The RBE for the initial slope (often referred to as RBEα) and 10% survival level (RBE10) are plotted vs. the inverse α/β ratio, i.e. β/α. This way of plotting [102] is motivated, as the dependence of RBE on that quantity is consistent with a linear relationship, as can be shown by a significance analysis. Note that for large values of β/α the corresponding α/β ratio as used in Fig. 4 will be small. Again, in order to keep errors reasonably small, α/β values from 1–30 Gy have been taken into account for analysis. Data outside this interval have been excluded because the associated errors for α and/or β are enormous and the RBE values might not be sufficiently reliable. Interestingly, while for small doses the RBE increases with β/α, we find a slight decrease for doses corresponding to 10% survival. The slope for the fit to RBEα is (5.1 ± 1.6) Gy and for RBE10 (–0.96 ± 0.52) Gy, where the errors are the standard error of the fit parameter.
Fig. 6.
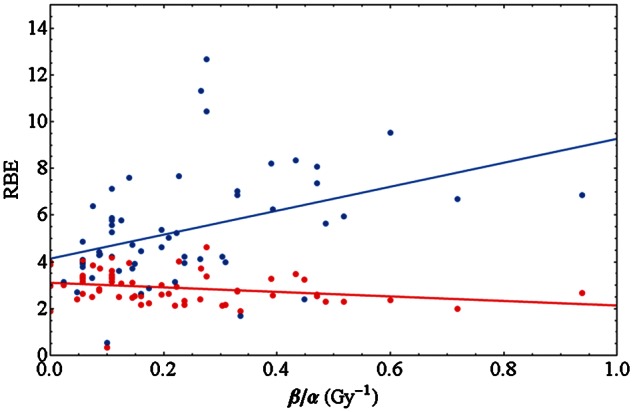
RBEα derived from the initial slope of survival curves (blue) and RBE10 for 10% survival (red) for experiments with monoenergetic carbon ions in the LET range 70–130 keV/µm vs the inverse of the photon LQ parameter ratio α/β. While for low doses the RBE increases with β/α, a decrease is observed for high doses. The data shown are restricted to α/β = 1–30 Gy. The solid lines are linear fits to the data points.
Model validation
One goal of the set up of the database was to establish systematic comparisons of biophysical models for the RBE with experimental data. As a start we present here a first comparison of the RBE dependence on tissue type as seen in experiments and as predicted by the LEM. The simulations have been carried out with the most recent version of the LEM [103, 104], in which the calculation of the effect is based on the spatial distribution of double strand breaks of the DNA. All relevant parameters describing the amorphous track structure of the ions and the size of the damage sites have been chosen as in Friedrich et al. [104]. For all cells, an average nuclear radius of 5 µm has been assumed, which is a reasonable first order estimate. In Fig. 7 the same data points as in Fig. 6 are shown, along with LEM simulations for three different LETs where the photon parameter β = 0.03 Gy−2 has been fixed while α varies. The restriction of β is an important issue: it is artificial and, and β has been chosen as close to the median value (0.033 Gy−2) of all cell lines in the PIDE. We must state here that fixing β is an approach only for revealing trends of the RBE from simulations with the LEM. A more thorough approach for the calculation of individual RBEs should take into account the LET and the photon parameters separately for each experiment, i.e. individual simulations would be performed with the specific LQ parameters α and β. Here, however, we can not expect the simulation to reflect the RBE of each individual cell line with high exactitude, but rather we have obtained an estimate for the behaviour of the ensemble of cell lines. The threshold dose Dt above which the LQ model was assumed to enter into a linear dose response [10] was chosen as Dt = 4 Gy + 1.1 α/β. The latter relationship has been found empirically to match survival data with LEM simulations. An increase in Dt with α/β has also been suggested in a study by Astrahan [105] based on experimental motivation. The LEM clearly reveals the general systematics, i.e. the increase (decrease) of the RBE with β/α for high (low) survival levels. Moreover, for 10% survival LEM predicts a small maximum at β/α = 0.1 Gy−1, which, however, is neither in contrast with nor reflected significantly by the data.
Fig. 7.
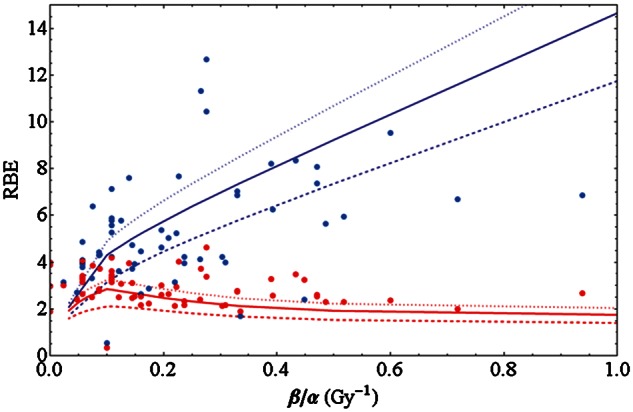
Data as in Fig. 6 along with simulations of the LEM for LETs of 70, 100 and 130 keV/µm (dashed, solid and dotted lines, respectively, see text for details.
Regarding the evolution of the β term presented above, we compared the prediction of several RBE models with an individual data set, where no cell line-dependent fluctuations of β are expected. Figure 8 shows the ratio β/βγ for HSG and V79 cells irradiated with carbon ions as measured by Furusawa et al. [30]. Again it becomes evident that for lower LET values the ratio exceeds one, while it finally decreases to zero. We indicated in the figure model predictions of the LEM, the repair–misrepair–fixation (RMF) model [106] as published recently by Frese et al. [107], and the microdosimetric kinetic model (MKM). Interestingly, none of the models is able to correctly reproduce the experimental findings. The LEM reveals a monotonically decreasing characteristic with increasing LET, while the RMF predicts a continuously increasing β term. The MKM predicts no changes in β/βγ. Consequently for lower LET the LEM underestimates β, and for high LET the RMF fails to reproduce the transition to a vanishing β. The MKM suffers from both shortcomings but reveals good predictions in the intermediate LET regime. Using the PIDE model, comparisons with larger sets of data can be carried out easily and it is a useful tool to exploit the limits of RBE models.
Fig. 8.
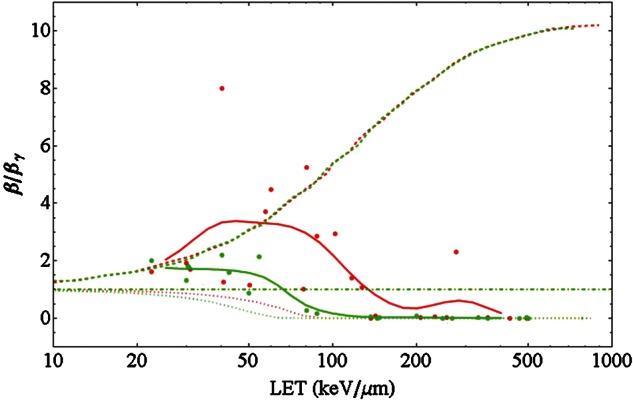
Ratio of the LQ parameter β of carbon ions to that of photons vs. LET for two individual cell lines, V79 cells (red) and HSG cells (green), as measured by Furusawa et al. [30]. As in Fig. 5 the thick lines are obtained as a running average of the data points. The dashed, dotted and dashed–dotted lines show model predictions of the RMF (reproduced from [107] model, the LEM and the MKM, respectively. The photon parameters used for the LEM calculations are α = 0.184 Gy−1, β = 0.02 Gy−2 and the threshold dose [10, 105] Dt = 17 Gy for V79 cells and α = 0.313 Gy−1, β = 0.0615 Gy−2 and Dt = 7.5 Gy for HSG cells.
DISCUSSION
As the PIDE comprises a large set of experiments, one may suspect that the variety of α and β values for photon dose responses is representative for all mammalian cell lines. Before discussing the properties of the particle dose–response curves, we first concentrate here on the photon properties.
Photon dose response
From Fig. 1 it is evident that both LQ parameters have a peaked distribution. However, despite the peak for very small or vanishing β, the distribution of β values is less skewed and more peaked at intermediate values, compared with the distribution of α. Consequently, the variation in the radio-sensitivity observed in cell lines is most likely due to the variability of α. Taking the average <β> as a representative quadratic parameter may be misleading, as can be seen by regarding the α/β ratio: as here β occurs in the denominator, small β values lead to large ratios as can be seen in Fig. 2. Applying <β> instead will result in artificially smaller α/β ratios, see Friedrich et al. [108] for details.
The large first bin of the distribution of β values is mainly reflecting the fact that many publications are concerned with repair-deficient cell lines. These cells lack the capability for repair of DNA lesions and show a linear or an almost linear dose response to low LET radiation. While this peak in the distribution seems to be non-generic because of the specific selection of cell lines, we believe the gross part of the distribution to be representative for cultured mammalian cells in general. This statement is a conjecture. However, if it holds, then the distributions shown in Fig. 1 can be used to define typical LQ parameter values for cultured cells as well as the corresponding typical intervals LQ parameters cover.
Fig. 3 suggests an anti-correlation between the LQ parameters α and β. Besides a simple expansion in powers of the dose there are several mechanistic interpretations of the LQ model in the literature [109], which give meaning to these parameters. Similarly, the LQ model emerges as a low dose approximation of many other survival models [110]. From this point of view it is interesting to note that a negative correlation observed in Fig. 3 would imply that the linear and quadratic components of the LQ model do not refer to totally independent processes. The anti-correlation is significant as judged by the standard error of the fit function. It is also observed in other data sets of survival curves after photon irradiation [111, 112]. The reason for this anti-correlation is still unclear. However, it can be excluded that the dependence between α and β is because of the inherent anti-correlation induced by the LQ least square fit procedure, where one parameter accounts for the other, as this only applies to multiple survival curves taken from one and the same assay. For independent survival curves no correlation is expected at all by the fit procedure. We hence believe that this observation is either because of the particular selection of cell lines studied in the literature or because there is a biological reason for the observed anti-correlation. If the latter was true the question arises as to whether this finding will influence the mechanistic interpretation of survival models. One possible explanation is a saturation of damage in organizational substructures of mega base pair size of the chromatin. We discuss the considerations about such a mechanism in a separate publication [113].
Dose response to ion irradiation
For the ion dose–response curves, the characteristics of RBE vs. LET in Fig. 4 summarizes the findings from cell survival studies during the last 50 years. Note that though fluctuations in RBE are huge, a dependence of RBE on particle species and α/β is clearly present. Having this in mind we regard our work as an extension to the plots presented in Ando and Kase [114] where the RBE was presented as a function of LET only.
As a consequence, when modeling the RBE for therapy, its dependence on particle species and the α/β ratio has to be respected. These findings do not support the conclusions drawn in Sørensen et al. [115], where a collection of survival data is also considered and the authors conclude that the dependence of RBE on the particle species and the cell type is small and might be neglected for a 10% survival level. However, although a considerable scatter of the individual data points around a hypothetic ‘best fit’ curve is observed, the average RBE10 of helium ions (blue data points) turns out to exceed the one for neon ions (orange data points) for a given LET by a factor of almost two, and the maxima of RBE–LET relationships are shifted to higher LETs for heavier particles. This clearly proves that a reduction to taking the LET as the only predictor for RBE is an oversimplification of the picture. Even if one respects that the scatter of data points is large, the necessity to discriminate not only by LET but also by particle species and α/β ratios holds for therapy applications, where the RBE is desired to be known to an accuracy level of about 10% to keep the variations in tumor control reasonably low. Nevertheless the observed scatter of the data for the same particles and comparable α/β ratio corresponds to an uncertainty in RBE. This is also an important issue for the assessment of treatment plans, where the data ensemble might help to estimate the uncertainty of RBE values.
In the literature, the behavior of the LQ parameter β with varying LET is still unclear. For neutron radiation, whose radiation response is believed to be mediated by protons as secondary particles, there are indications for an increase of β with LET [116]. Other authors do not find such obvious systematics [30]. Using the data from PIDE presented in Fig. 5 an initial increase of β for low LET is suggested (except for protons), followed by a clear rapid falloff at higher LETs. Facing these partially contradictory statements one has to keep in mind that the extracted values for β are the result of a fit and therefore subject to fit errors. For instance, if a survival curve consists of a small number of dose points or an inappropriate fit interval is used, it is hardly feasible to obtain a β term with good accuracy. Currently no error analysis has been carried out with the PIDE. It is on our agenda, and maybe the question of how β varies with LET can be answered more clearly then. A clarification on this point would again be of great interest with respect to RBE models.
The trend curves in Fig. 5 show an increase in β with LET followed by a rapid falloff down to zero. These features might be understood qualitatively in a microscopic picture: The enhanced radiation response with dose is due to the track-to-track interaction (‘intertrack effect’) of different ions passing through a cell nucleus. This means that the β term for particle radiation emerges as a consequence of overlapping particle tracks. For high energy particles the track diameter is largest, while the local doses are rather low. When lowering the energy and thereby raising the LET, two competing processes occur: first, the inhomogeneity of the microscopic dose distribution increases, as the track radii get smaller and the energy lost by the passing particle is distributed within a smaller volume, and moreover this amount of lost energy is larger due to the increased LET. Hence the number of induced lesions within a particle track is enhanced, and thereby potentially also the rates of lesions emerging from track to track interaction are enhanced. However, on the other hand there is a second, competing process, as due to the smaller track radii the geometrical probability for tracks to overlap gets smaller. Moreover, due to the higher LET, for a given dose the overall fluence is smaller, again leading to a mitigation of overlapping of different ion tracks. For light particles and not-too-high LET the first process is more important, while for heavier particles and/or higher LETs the second one dominates the picture. Consequently, β rises first and then decreases with rising LET. At even larger LET values where one ion passing through a cell nucleus is sufficient to ‘overkill’ the cell, i.e. more energy than needed for cell death is deposited, there is a further argument that no β term occurs: even if tracks overlap, the consequence in terms of cell death will be just the same and no additional effect is expected, because any hit causes cell death. The same characteristics are also seen in individual cell lines, as demonstrated in Fig. 8, which is supportive of the interpretation given above.
An interesting feature in the ion dose–response curves is the increasing or decreasing course of RBE with β/α, depending on the survival level. This behavior is significant. In Fig. 6 it can be seen that for high doses (at 10% survival) where a negative slope is observed in the fit line, ion irradiation to cells with a high α/β ratio, often labeled as radio-sensitive (with respect to photon irradiation), is more effective than to cells with a small α/β ratio, which are usually labeled as radio-resistant. This is counterintuitive and we do not have an explanation for this finding yet.
For clinical applications this observation suggests two implications, provided these findings are still valid for tissues just as for cell survival assays: first, tissues with a high α/β ratio provide larger RBEs for sufficient high doses compared with tissues with smaller α/β ratios. Due to that, patients with tumors with high α/β ratios surrounded by normal tissues with smaller α/β ratios will benefit more from hypofractionated regimens than from normal fractionation schemes. This feature would constitute an additional rationale for carbon ion therapy for these tumor entities. A potential biological benefit of a small fraction number was also demonstrated with in vivo experiments [116]. On the other hand, if tumors with a low α/β ratio are embedded in normal tissues with high α/β ratios, hypofractionation would be less advantageous. Second, at intermediate doses there is a survival range (∼0.5–0.8) where RBE values are rather insensitive to the tissue type, i.e. to the α/β ratio. One may question the impact of these findings for biological treatment planning, but obviously in the entrance, where low doses are desired, RBE has to be taken into account as a tissue-dependent quantity.
In Fig. 7 we also present the first steps of the comparison of the experimental data in the PIDE with the LEM. Note that this comparison is carried out on a very basic level here, as the simulations have been carried out for a unique β term, while the exact properties of the individual experiments have been neglected. A ‘point by point’ simulation is an additional open task, where we hope to further elucidate the potential and limits of the LEM. Besides that, it is impressive to see that a less detailed simulation is capable of reproducing the increase and decrease in RBE with β/α for high and low survival levels, respectively, with reasonable accuracy. Moreover, if the peak predicted by the LEM simulations for the 10% survival level reflects reality (which cannot be assessed based on the available data), there will be a maximum RBE corresponding to α/β ≈ 10 Gy. Again questioning the meaning for clinical application the existence of such a peak would suggest that carbon ion therapy for tumors with that α/β ratio is particularly useful when applied as a hypofractionated regimen.
While the LEM is based on the considerations within the formalism of amorphous track structure and predicts a variation of β with LET [10], the MKM [12, 13] assumes a fixed β value for all LET. A ‘saturation correction’ at very high LET in the ‘overkill effect’ is taken into account in both models, but acts only on the α term in the MKM, leaving β constant even at high LET values. As can be seen in Fig. 8 the LEM does reveal a sudden decrease of the β term and even predicts the correct ordering, i.e. for HSG cells the falloff takes place at lower LET compared with V79 cells. While the ordering is correct, the absolute LET values for the decrease in β are not predicted correctly. Furthermore, the β term is underestimated for the lower to intermediate LET range. For obtaining the simulation results shown, we used an economic LEM algorithm, deriving the properties of the cell line after ion irradiation from the action of single hits [10]. A full Monte Carlo simulation of the damage induction processes involved in the LEM helps to partially overcome these shortcomings, allowing also a small initial increase of β/βγ [104]. We plan to discuss this improvement in more detail in a separate publication. The RMF model (in combination with a Monte Carlo model for simulating aspects of track structure) predicts continuously increasing characteristics, which does not seem to be dependent on the cell line. In particular for the high LET regime this leads to a large overestimate of the β values. Possible reasons are discussed by the founders of the model [106]. To summarize, none of the models is able to predict the characteristics of the β term in full correspondence with the data, justifying the ongoing concentrated development in RBE models. However, in the context of the focus of this paper it becomes clear that databases generally are a powerful tool for model testing. As has been shown here the PIDE can be used conveniently to exploit the limits of RBE-predicting models. Likewise, the fluctuations in RBE observed in the database give insight into the accuracy level one can expect when applying RBE models to individual survival experiments [104].
Finally, from the discussed examples it becomes clear that the database is a powerful tool for revealing systematic properties of quantities relevant in radiobiology and therapy that may be hard to detect when reviewing a limited number of experiments only. We propose the PIDE as a standard data collection to benchmark RBE models and suggest that it is also suitable for comparing different models. From the PIDE one also can identify biological and/or physical parameters for which not so much experimental information has been available up to now and consequently further experimental work would be desirable, such as for Li, Be and B ions or for higher α/β values. We plan to share the content of the PIDE with the community and put the data on the research section (modelling group) of the website of the GSI biophysics department, where they can be downloaded after contacting the authors to obtain access. In the future we plan to maintain the PIDE continuously by inputting more data. For that reason, we invite the researchers in the field to make us aware of any suitable dataset that is missing in the PIDE.
FUNDING
This work was partially supported by Siemens Healthcare, Erlangen, Germany.
ACKNOWLEDGEMENTS
We gratefully thank G. Kraft for useful help with the literature survey. We also thank E. Scifoni for valuable remarks during manuscript preparation.
REFERENCES
- 1.Amaldi U, Kraft G. Radiotherapy with beams of carbon ions. Rep Progr Phys. 2005;68:1861–82. [Google Scholar]
- 2.Kraft G. Tumor therapy with heavy charged particles. Prog Part Nucl Phys. 2000;45:S473–S544. [Google Scholar]
- 3.Tsujii H, Kamada T, Baba M, et al. Clinical advantages of carbon-ion radiotherapy. New J Phys. 2008;10 075009. [Google Scholar]
- 4.Kitagawa A, Fujita T, Murumatsu M, et al. Review on heavy ion radiotherapy facilities and related ion sources. Rev Sci Instrum. 2010;81 doi: 10.1063/1.3268510. 02B909. [DOI] [PubMed] [Google Scholar]
- 5.Schardt D, Elsässer T, Schulz-Ertner D. Heavy-ion tumor therapy: physical and radiobiological benefits. Rev Mod Phys. 2010;82:383–425. [Google Scholar]
- 6.Durante M, Loeffler JS. Charged particles in radiation oncology. Nat Rev Clin Oncol. 2010;7:37–43. doi: 10.1038/nrclinonc.2009.183. [DOI] [PubMed] [Google Scholar]
- 7.IAEA. Relative biological effectiveness in ion beam therapy. 2008 IAEA Technical Reports Series 461. [Google Scholar]
- 8.Emami B, Lyman J, Brown A, et al. Tolerance of normal tissue to therapeutic irradiation. Int J Radiat Oncol Biol Phys. 1991;21:109–22. doi: 10.1016/0360-3016(91)90171-y. [DOI] [PubMed] [Google Scholar]
- 9.Withers HR, Taylor JMG, Maciejewski B. The hazard of accelerated tumor clonogen repopulation during radiotherapy. Acta Oncol. 1988;27:131–46. doi: 10.3109/02841868809090333. [DOI] [PubMed] [Google Scholar]
- 10.Scholz M, Kellerer AM, Kraft-Weyrather W, et al. Computation of cell survival in heavy ion beams for therapy. The model and its approximation. Radiat Environ Biophys. 1997;36:59–66. doi: 10.1007/s004110050055. [DOI] [PubMed] [Google Scholar]
- 11.Krämer M, Scholz M. Treatment planning for heavy-ion radiotherapy: calculation and optimization of biologically effective dose. Phys Med Biol. 2000;45:3319–30. doi: 10.1088/0031-9155/45/11/314. [DOI] [PubMed] [Google Scholar]
- 12.Hawkins RB. A statistical theory of cell killing by radiation of varying linear energy transfer. Radiat Res. 1994;140:366–74. [PubMed] [Google Scholar]
- 13.Hawkins RB. A microdosimetric kinetic model for the effect of non-Poisson distribution of lethal lesions on the variation of RBE with LET. Radiat Res. 2003;160:61–9. doi: 10.1667/rr3010. [DOI] [PubMed] [Google Scholar]
- 14.Paganetti H, Niemierko A, Ancukiewicz M, et al. Relative biological effectiveness (RBE) values for proton beam therapy. Int J Radiat Biol Phys. 2002;53:407–21. doi: 10.1016/s0360-3016(02)02754-2. [DOI] [PubMed] [Google Scholar]
- 15.Guerrero M, Li XA. Extending the linear-quadratic model for large fraction doses pertinent to stereotactic radiotherapy. Phys Med Biol. 2004;49:4825–35. doi: 10.1088/0031-9155/49/20/012. [DOI] [PubMed] [Google Scholar]
- 16.Kirkpatrick JP, Brenner DJ, Orton CG. The linear-quadratic model is inappropriate to model high dose per fraction effects in radiosurgery. Med Phys. 2009;38:3381–4. doi: 10.1118/1.3157095. [DOI] [PubMed] [Google Scholar]
- 17.Brenner DJ. The linear-quadratic model is an appropriate methodology for determining isoeffective doses at large dose per fraction. Semin Radiat Oncol. 2008;18:234–9. doi: 10.1016/j.semradonc.2008.04.004. [DOI] [PMC free article] [PubMed] [Google Scholar]
- 18.Chapman JD, Blakely EA, Smith KC, et al. Radiation biophysical studies with mammalian cells and a modulated carbon ion beam. Radiat Res. 1978;74:101–11. [PubMed] [Google Scholar]
- 19.Chapman JD, Blakely EA, Smith KC, et al. Radiobiological characterization of the inactivating events produced in mammalian cells by helium and heavy ions. Int J Radiat Oncol Biol Phys. 1977;3:97–102. doi: 10.1016/0360-3016(77)90234-6. [DOI] [PubMed] [Google Scholar]
- 20.Blakely EA, Tobias CA, Yang TCH, et al. Inactivation of human kidney cells by high-energy monoenergetic heavy-ion beams. Radiat Res. 1979;80:122–60. [PubMed] [Google Scholar]
- 21.Raju MR, Eisen Y, Carpenter S, et al. Radiobiology of α particles. Radiat Res. 1991;128:204–9. [PubMed] [Google Scholar]
- 22.Goodhead DT, Belli M, Mill AJ, et al. Direct comparison between protons and alpha-particles of the same LET. I: irradiation methods and inactivation of asynchronous V79, HeLa and C3HT1/2 cells. Int J Radiat Biol. 1992;61:611–24. doi: 10.1080/09553009214551421. [DOI] [PubMed] [Google Scholar]
- 23.Folkard M, Prise KM, Voijnovic B, et al. Inactivation of V79 cells by low-energy protons, deuterons and helium-3 ions. Int J Radiat Biol. 1996;69:729–38. doi: 10.1080/095530096145472. [DOI] [PubMed] [Google Scholar]
- 24.Eguchi-Kasai K, Murakami M, Itsukaichi H, et al. The role of DNA repair on cell killing by charged particles. Adv Space Res. 1996;18:109–18. doi: 10.1016/0273-1177(95)00797-i. [DOI] [PubMed] [Google Scholar]
- 25.Suzuki M, Kase Y, Kanai T, et al. LET dependence of cell death and chromatin-break induction in normal human cells irradiated by neon-ion beams. Int J Radiat Biol. 1997;72:497–503. doi: 10.1080/095530097142997. [DOI] [PubMed] [Google Scholar]
- 26.Bettega D, Calzolari P, Marchesini R, et al. Inactivation of C3H10T1/2 cells by low energy protons and deuterons. Int J Radiat Biol. 1998;73:303–9. doi: 10.1080/095530098142400. [DOI] [PubMed] [Google Scholar]
- 27.Tsuboi K, Tsuchida Y, Nose T, et al. Cytotoxic effect of accelerated carbon beams on glioblastoma cell lines with p53 mutation: clonogenic survival and cell-cycle analysis. Int J Radiat Biol. 1998;74:71–9. doi: 10.1080/095530098141744. [DOI] [PubMed] [Google Scholar]
- 28.Tsuchida Y, Tsuboi K, Ohyama H, et al. Cell death induced by high-linear-energy transfer carbon beams in human glioblastoma cell lines. Brain Tumor Pathol. 1998;15:71–6. doi: 10.1007/BF02478886. [DOI] [PubMed] [Google Scholar]
- 29.Weyrather WK, Ritter S, Scholz M, et al. RBE for carbon track-segment irradiation in cell lines of differing repair capacity. Int J Radiat Biol. 1999;75:1357–64. doi: 10.1080/095530099139232. [DOI] [PubMed] [Google Scholar]
- 30.Furusawa Y, Fukutsu K, Aoki M, et al. Inactivation of aerobic and hypoxic cells from three different cell lines by accelerated 3He-, 12C- and 20Ne beams. Radiat Res. 2000;154:485–96. doi: 10.1667/0033-7587(2000)154[0485:ioaahc]2.0.co;2. [DOI] [PubMed] [Google Scholar]
- 31.Suzuki M, Kase Y, Yamaguchi H, et al. Relative biological effectiveness for cell-killing effect on various human cell lines irradiated with heavy-ion medical accelerator in Chiba (HIMAC) carbon-ion beams. Int J Radiat Oncol Biol Phys. 2000;48:241–50. doi: 10.1016/s0360-3016(00)00568-x. [DOI] [PubMed] [Google Scholar]
- 32.Belli M, Bettega D, Calzolari P, et al. Inactivation of human normal and tumour cells irradiated with low energy protons. Int J Radiat Biol. 2000;76:831–9. doi: 10.1080/09553000050028995. [DOI] [PubMed] [Google Scholar]
- 33.Tsuruoka C, Suzuki M, Fujitaka K, et al. LET and ion species dependence for cell killing in normal human skin fibroblasts. Radiat Res. 2005;163:494–500. doi: 10.1667/rr3360. [DOI] [PubMed] [Google Scholar]
- 34.Belli M, Bettega D, Calzolari P, et al. Effectiveness of monoenergetic and spread-out Bragg peak carbon-ions for inactivation of various normal and tumour human cell lines. J Radiat Res. 2008;49:597–607. doi: 10.1269/jrr.08052. [DOI] [PubMed] [Google Scholar]
- 35.Belli M, Cera F, Cherubini R, et al. RBE-LET relationships for cell inactivation and mutation induced by low energy protons in V79 cells: further results at the LNL facility. Int J Radiat Biol. 1998;74:501–9. doi: 10.1080/095530098141375. [DOI] [PubMed] [Google Scholar]
- 36.Belli M, Cera F, Cherubini R, et al. Inactivation and mutation induction in V79 cells by low energy protons: re-evaluation of the results at the LNL facility. Int J Radiat Biol. 1993;63:331–7. doi: 10.1080/09553009314550441. [DOI] [PubMed] [Google Scholar]
- 37.Hall EJ, Bird RP, Rossi HH, et al. Biophysical studies with high-energy argon ions 2. Determinations of the relative biological effectiveness, the oxygen enhancement ratio, and the cell cycle response. Radiat Res. 1977;70:469–79. [PubMed] [Google Scholar]
- 38.Bird RP, Burki HJ. Survival of synchronized Chinese hamster cells exposed to radiation of different linear-energy transfer. Int J Radiat Biol. 1975;27:105–20. doi: 10.1080/09553007514550121. [DOI] [PubMed] [Google Scholar]
- 39.Sinclair WK, Morton RA. X-ray sensitivity during the cell generation cycle of cultured Chinese hamster cells. Radiat Res. 1966;29:450–74. [PubMed] [Google Scholar]
- 40.Von Neubeck C. Radiobiological experiments for carbon ion prostate cancer therapy: interplay of normal and tumor cells in co-culture and measurement of the oxygen enhancement ratio. PhD thesis, Technische Universität Darmstadt. 2009 [Google Scholar]
- 41.Perris A, Pialoglou P, Katsanos AA, et al. Biological effectiveness of low energy protons. I. Survival of Chinese hamster cells. Int J Radiat Biol. 1986;50:1093–101. doi: 10.1080/09553008614551481. [DOI] [PubMed] [Google Scholar]
- 42.Bettega D, Tallone Lombardi L. Physical and radiobiological parameters of proton beams up to 31 MeV. Nuovo Cim. 1983;2D:907–16. [Google Scholar]
- 43.Bettega D, Birattari C, Bombana M, et al. Relative biological effectiveness for protons of energies up to 31MeV. Radiat Res. 1979;77:85–97. [PubMed] [Google Scholar]
- 44.Cox R, Thacker J, Goodhead DT. Inactivation and mutation of cultured mammalian cells by aluminium characteristic ultrasoft X-rays. II. Dose-responses of Chinese hamster and human diploid cells to aluminium X-rays and radiations of different LET. Int J Radiat Biol. 1977;31:561–76. doi: 10.1080/09553007714550661. [DOI] [PubMed] [Google Scholar]
- 45.Wouters BG, Lam GKY, Oelfke U, et al. Measurements of relative biological effectiveness of the 70 MeV proton beam at TRIUMF using Chinese hamster V79 cells and the high-precision cell sorter assay. Radiat Res. 1996;146:159–70. [PubMed] [Google Scholar]
- 46.Combs SE, Bohl J, Elsässer T, et al. Radiobiological evaluation and correlation with the local effect model (LEM) of carbon ion radiation therapy and temozolomide in glioblastoma cell lines. Int J Radiat Biol. 2009;85:126–36. doi: 10.1080/09553000802641151. [DOI] [PubMed] [Google Scholar]
- 47.Kitajima S, Nakamura H, Adachi M, et al. AT cells show dissimilar hypersensitivity to heavy-ion and X-rays irradiation. J Radiat Res. 2010;51:251–5. doi: 10.1269/jrr.09069. [DOI] [PubMed] [Google Scholar]
- 48.Blomquist E, Russell KR, Stenerlöw B, et al. Relative biological effectiveness of intermediate energy protons. Comparisons with 60Co gamma-radiation using two cell lines. Radiother Oncol. 1993;28:44–51. doi: 10.1016/0167-8140(93)90184-a. [DOI] [PubMed] [Google Scholar]
- 49.Yang TCH, Craise LM, Mei MT, et al. Neoplastic cell transformation by heavy charged particles. Radiat Res. 1985;104:S177–S187. [PubMed] [Google Scholar]
- 50.Miller RC, Marino SA, Brenner DJ, et al. The biological effectiveness of radon-progeny alpha particles. II. Oncogenic transformation as a function of linear energy transfer. Radiat Res. 1995;142:54–60. [PubMed] [Google Scholar]
- 51.Czub J, Banaś D, Błaszczyk A, et al. Biological effectiveness of 12C and 20Ne ions with very high LET. Int J Radiat Biol. 2008;84:821–9. doi: 10.1080/09553000802389652. [DOI] [PubMed] [Google Scholar]
- 52.Kamlah F, Hanze J, Arenz A, et al. Comparison of the effects of carbon ion and photon irradiation on the angiogenic response in human lung adenocarcinoma cells. Int J Radiat Oncol Biol Phys. 2011;80:1541–9. doi: 10.1016/j.ijrobp.2011.03.033. [DOI] [PubMed] [Google Scholar]
- 53.Aoki M, Furusawa Y, Yamada T. LET dependency of heavy-ion induced apoptosis in V79 cells. J Radiat Res. 2000;41:163–75. doi: 10.1269/jrr.41.163. [DOI] [PubMed] [Google Scholar]
- 54.Han ZB, Suzuki H, Suzuki F, et al. Relative biological effectiveness of accelerated heavy ions for induction of morphological transformation in Syrian hamster embryo cells. J Radiat Res. 1998;39:193–201. doi: 10.1269/jrr.39.193. [DOI] [PubMed] [Google Scholar]
- 55.Hamada N, Imaoka T, Masunaga S, et al. Recent advances in the biology of heavy-ion cancer therapy. J Radiat Res. 2010;51:365–83. doi: 10.1269/jrr.09137. [DOI] [PubMed] [Google Scholar]
- 56.Claesson K, Magnander K, Kahu H, et al. RBE of α-particles from 211At for complex DNA damage and cell survival in relation to cell cycle position. Int J Radiat Biol. 2011;87:72–84. doi: 10.3109/09553002.2011.538127. [DOI] [PubMed] [Google Scholar]
- 57.Wedenberg M, Lind BK, Toma-Daşu I, et al. Analytical description of the LET dependence of cell survival using the repairable-conditionally repairable damage model. Radiat Res. 2010;174:517–25. doi: 10.1667/RR2045.1. [DOI] [PubMed] [Google Scholar]
- 58.Miller RC, Brenner DJ, Randers-Pehrson G, et al. The effects of the temporal distribution of dose on oncogenic transformation by neutrons and charged particles of intermediate LET. Radiat Res. 1990;14:S62–S68. [PubMed] [Google Scholar]
- 59.Tobias CA, Blakely EA, Ngo FQH, et al. The repair-misrepair model of cell survival. In: Meyn RE, Withers HR, editors. Radiation Biology in Cancer Research. New York: Raven press; 1980. pp. 195–230. [Google Scholar]
- 60.Cox R, Masson WK. Mutation, inactivation of cultured mammalian cells exposed to beams of accelerated heavy ions III. Human diploid fibroblasts. Int J Radiat Biol. 1979;36:149–60. doi: 10.1080/09553007914550901. [DOI] [PubMed] [Google Scholar]
- 61.Ito A, Nakano H, Kusano Y, et al. Contribution of indirect action to radiation-induced mammalian cell inactivation: dependence on photon energy and heavy-ion LET. Radiat Res. 2006;165:703–12. doi: 10.1667/RR3557.1. [DOI] [PubMed] [Google Scholar]
- 62.Tilly N, Brahme A, Carlsson J, et al. Comparison of cell survival models for mixed LET radiation. Int J Radiat Biol. 1999;75:233–43. doi: 10.1080/095530099140690. [DOI] [PubMed] [Google Scholar]
- 63.Thacker J, Stretch A, Stephens MA. Mutation, inactivation of cultured mammalian cells exposed to beams of accelerated heavy ions II. Chinese hamster V79 cells. Int J Biol. 1979;36:137–48. doi: 10.1080/09553007914550891. [DOI] [PubMed] [Google Scholar]
- 64.Hirayama R, Ito A, Tomita M, et al. Contributions of direct and indirect actions in cell killing by high-LET radiations. Radiat Res. 2009;171:212–18. doi: 10.1667/RR1490.1. [DOI] [PubMed] [Google Scholar]
- 65.Hirayama R, Furusawa Y, Fukawa T, et al. Repair kinetics of DNA-DSB induced by X-rays or carbon ions under oxic and hypoxic conditions. J Radiat Res. 2005;46:325–32. doi: 10.1269/jrr.46.325. [DOI] [PubMed] [Google Scholar]
- 66.Curtis SB, Schilling WA, Tenforde TS, et al. Survival of oxygenated and hypoxic tumor cells in the extended-peak regions of heavy charged-particle beams. Radiat Res. 1982;90:292–309. [PubMed] [Google Scholar]
- 67.Böhrnsen G, Weber KJ, Scholz M. Measurement of biological effects of high-energy carbon ions at low doses using a semi-automated cell detection system. Int J Radiat Biol. 2002;78:259–66. doi: 10.1080/09553000110110293. [DOI] [PubMed] [Google Scholar]
- 68.Fournier C, Scholz M, Weyrather WK, et al. Changes of fibrosis-related parameters after high- and low-LET irradiations of fibroblasts. Int J Radiat Biol. 2001;77:713–22. doi: 10.1080/095530000110045025. [DOI] [PubMed] [Google Scholar]
- 69.Wulf H, Kraft-Weyrather W, Miltenburger HG, et al. Heavy-ion effects on mammalian cells: inactivation measurements with different cell lines. Radiat Res. 1985;104:S122–S134. [PubMed] [Google Scholar]
- 70.Wulf H. Der Einfluss von Schwerionenstrahlen auf das Überleben und Wachstum von Säugetierzellen in vitro. PhD thesis, Technische Hochschule Darmstadt. 1983 [Google Scholar]
- 71.Kraft G. Biologische Effekte schwerer Ionen In. In: zum Winkel K, editor. Wirkungssteigerung der Strahlentherapie maligner Tumoren. Heidelberg: Springer; 1987. [Google Scholar]
- 72.Scholz M. Effects of ion radiation on cells and tissues. Adv Polymer Science. 2003;162:95–155. [Google Scholar]
- 73.Persson LM, Edgren MR, Stenerlöw B, et al. Relative biological effectiveness of boron ions human melanoma cells. Int J Radiat Biol. 2002;78:743–8. doi: 10.1080/09553000210140091. [DOI] [PubMed] [Google Scholar]
- 74.Yang TC, Tobias CA. Neoplastic cell transformation by energetic heavy ions and its modification with chemical agents. Adv Space Res. 1984;4:207–18. doi: 10.1016/0273-1177(84)90243-6. [DOI] [PubMed] [Google Scholar]
- 75.Prise KM, Folkard M, Davies S, et al. The irradiation of V79 mammalian cells by protons with energies below 2 MeV. Part II. Measurement of oxygen enhancement ratios and DNA damage. Int J Radiat Biol. 1990;58:261–77. doi: 10.1080/09553009014551611. [DOI] [PubMed] [Google Scholar]
- 76.Terato H, Tanaka R, Nakaarai Y, et al. Quantitative analysis of isolated and clustered DNA damage induced by gamma-rays, carbon ion beams, and iron ion beams. J Radiat Res. 2008;49:133–46. doi: 10.1269/jrr.07089. [DOI] [PubMed] [Google Scholar]
- 77.Suzuki M, Watanabe M, Kanai Y, et al. LET dependence of cell death, mutation induction and chromatin damage in human cells irradiated with accelerated carbon ions. Adv Space Res. 1996;18:127–36. doi: 10.1016/0273-1177(95)00799-k. [DOI] [PubMed] [Google Scholar]
- 78.Matsumoto Y, Iwakawa M, Furusawa Y, et al. Gene expression analysis in human malignant melanoma cell lines exposed to carbon beams. Int J Radiat Biol. 2008;84:299–314. doi: 10.1080/09553000801953334. [DOI] [PubMed] [Google Scholar]
- 79.Mehnati P, Morimoto S, Yatagai F, Exploration of, et al. ‘over kill effect’ of high-LET Ar- and Fe-ions by evaluating the fraction of non-hit cell and interphase death. J Radiat Res. 2005;46:343–50. doi: 10.1269/jrr.46.343. [DOI] [PubMed] [Google Scholar]
- 80.Stenerlöw B, Petterson OA, Essand M, et al. Irregular variations in radiation sensitivity when the linear energy transfer is increased. Radiother Oncol. 1995;36:133–42. doi: 10.1016/0167-8140(95)01591-4. [DOI] [PubMed] [Google Scholar]
- 81.Okayasu R, Okada M, Okabe A, et al. Repair of DNA damage induced by accelerated heavy ions in mammalian cells proficient and deficient in the non-homologous end-joining pathway. Radiat Res. 2006;165:59–67. doi: 10.1667/rr3489.1. [DOI] [PubMed] [Google Scholar]
- 82.Tsuboi K, Moritake T, Tsuchida Y, et al. Cell cycle checkpoint and apoptosis induction in glioblastoma cells and fibroblasts irradiated with carbon beam. J Radiat Res. 2007;48:317–25. doi: 10.1269/jrr.06081. [DOI] [PubMed] [Google Scholar]
- 83.Todd PW. Heavy-ion irradiation of human and Chinese hamster cells in vitro. Radiat Res. 1975;61:288–97. [PubMed] [Google Scholar]
- 84.Hall EJ, Gross W, Dvorak RF, et al. Survival curves and age response functions for Chinese hamster cells exposed to X-rays or high-LET alpha-particles. Radiat Res. 1972;52:88–98. [PubMed] [Google Scholar]
- 85.Takahashi A, Ohnishi K, Tsuji K, et al. WAF1 accumulation by carbon-ion beam and α-particle irradiation in human glioblastoma cultures cells. Int J Radiat Biol. 2000;76:335–41. doi: 10.1080/095530000138673. [DOI] [PubMed] [Google Scholar]
- 86.Takahashi A, Matsumoto H, Yuki K, et al. High-LET radiation enhanced apoptosis but not necrosis regardless of pp53 status. Int J Radiat Oncol Biol Phys. 2004;60:591–7. doi: 10.1016/j.ijrobp.2004.05.062. [DOI] [PubMed] [Google Scholar]
- 87.Matsuzaki H, Miyamoto T, Miyazawa Y, et al. Biological effects of heavy ion beam on human breast cancers. Breast Cancer. 1998;5:261–8. doi: 10.1007/BF02966706. [DOI] [PubMed] [Google Scholar]
- 88.Kronenberg A, Gauny S, Kwoh E, et al. Comparative analysis of cell killing and autosomal mutation in mouse kidney epithelium exposed to 1 GeV/nucleon iron ions in vitro or in situ. Radiat Res. 2009;172:550–7. doi: 10.1667/RR1804.1. [DOI] [PubMed] [Google Scholar]
- 89.Hamada N, Funayama T, Wada S, et al. LET-dependent survival of irradiated normal human fibroblasts and their descendants. Radiat Res. 2006;166:24–30. doi: 10.1667/RR3579.1. [DOI] [PubMed] [Google Scholar]
- 90.Zhou G, Wang P, Tao L, et al. Protective effect of melatonin against low- and high-LET irradiation. J Radiat Res. 2006;47:175–8. doi: 10.1269/jrr.47.175. [DOI] [PubMed] [Google Scholar]
- 91.Jenner TJ, deLara CM, O'Neill P, et al. Induction and rejoining of DNA double-strand breaks in V79-4 mammalian cells following γ- and α-irradiation. Int J Radiat Biol. 1993;64:265–73. doi: 10.1080/09553009314551421. [DOI] [PubMed] [Google Scholar]
- 92.Furusawa Y, Aoki M, Durante M. Simultaneous exposure of mammalian cells to heavy ions and X-rays. Adv Space Res. 2002;30:877–84. doi: 10.1016/s0273-1177(02)00409-x. [DOI] [PubMed] [Google Scholar]
- 93.Takahashi A, Ohnishi K, Ota I, et al. p53–dependent thermal enhancement of cellular sensitivity in human squamous cell carcinoma in relation to LET. Int J Radiat Biol. 2001;77:1043–51. doi: 10.1080/09553000110066095. [DOI] [PubMed] [Google Scholar]
- 94.Bettega D, Calzolari P, Doneda L, et al. Early and delayed reproductive death in human cells exposed to high energy iron ion beams. Adv Space Res. 2005;35:280–5. doi: 10.1016/j.asr.2005.01.060. [DOI] [PubMed] [Google Scholar]
- 95.Ibañez IL, Bracalente C, Molinari BL, et al. Induction and rejoining of DNA double strand breaks assessed by H2AX phosphorylation in melanoma cells irradiated with proton and lithium beams. Int J Radiat Oncol Biol Phys. 2009;74:1226–35. doi: 10.1016/j.ijrobp.2009.02.070. [DOI] [PubMed] [Google Scholar]
- 96.Hellweg CE, Baumstark-Khan C, Schmitz C, et al. Carbon-ion-induced activation of the NF-κB pathway. Radiat Res. 2011;175:424–31. doi: 10.1667/RR2423.1. [DOI] [PubMed] [Google Scholar]
- 97.Napolitano M, Durante M, Grossi GF, et al. Inactivation of C3H 10T1/2 cells by monoenergetic high LEt alpha-particles. Int J Radiat Biol. 1992;61:813–20. doi: 10.1080/09553009214551691. [DOI] [PubMed] [Google Scholar]
- 98.Hill MA, Herdman MT, Stevens DL, et al. Relative sensitivities of repair-deficient mammalian cells for clonogenic survival after α-particle irradiation. Radiat Res. 2004;162:667–76. doi: 10.1667/rr3265. [DOI] [PubMed] [Google Scholar]
- 99.Krämer M, Jäkel O, Haberer T, et al. Treatment planning for heavy-ion radiotherapy: physical beam model and dose optimization. Phys Med Biol. 2000;45:3299–317. doi: 10.1088/0031-9155/45/11/313. [DOI] [PubMed] [Google Scholar]
- 100.Geissel H, Weick H, Scheidenberger C, et al. Experimental studies of heavy-ions slowing down in matter. Nucl Instr and Meth B. 2002;195:3–54. [Google Scholar]
- 101.Jones B. The apparent increase in the β-parameter of the linear quadratic model with increased linear energy transfer during fast neutron irradiation. Br J Radiol. 2009;83:433–6. doi: 10.1259/bjr/68792966. [DOI] [PMC free article] [PubMed] [Google Scholar]
- 102.Weyrather WK. Medical applications of accelerated ions. Lect Notes Phys. 2004;651:469–90. [Google Scholar]
- 103.Elsässer T, Weyrather WK, Friedrich T, et al. Quantification of the relative biological effectiveness for ion beam radiotherapy: direct experimental comparison of proton and carbon ion beams and a novel approach for treatment planning. Int J Radiat Oncol Biol Phys. 2010;78:1177–83. doi: 10.1016/j.ijrobp.2010.05.014. [DOI] [PubMed] [Google Scholar]
- 104.Friedrich T, Scholz U, Elsässer T, et al. Calculation of the biological effects of ion beams based on the microscopic spatial damage distribution pattern. Int J Radiat Biol. 2012;88:115–22. doi: 10.3109/09553002.2011.611213. [DOI] [PubMed] [Google Scholar]
- 105.Astrahan M. Some implications of linear-quadratic-linear radiation dose-response with regard to hypofractionation. Med Phys. 2008;35:4161–72. doi: 10.1118/1.2969065. [DOI] [PubMed] [Google Scholar]
- 106.Carlson DJ, Stewart RD, Semenenko VA, et al. Combined use of Monte Carlo DNA damage simulations and deterministic repair models to examine putative mechanisms of cell killing. Radiat Res. 2008;169:447–59. doi: 10.1667/RR1046.1. [DOI] [PubMed] [Google Scholar]
- 107.Frese MC, Yu VK, Stewart RD, Carlson DJ. A mechanism-based approach to predict the relative biological effectiveness of protons and carbon ions in radiation therapy. Int J Radiat Oncol Biol Phys. 2012;83:442–50. doi: 10.1016/j.ijrobp.2011.06.1983. [DOI] [PubMed] [Google Scholar]
- 108.Friedrich T, Weyrather W, Elsässer T, et al. Accuracy of RBE: experimental and theoretical considerations. Radiat Environ Biophys. 2010;49:345–9. doi: 10.1007/s00411-010-0298-9. [DOI] [PubMed] [Google Scholar]
- 109.Sachs RK, Hahnfeld PJ, Brenner DJ. The link between low-LET dose-response relations and the underlying kinetics of damage production/repair/misrepair. Int J Radiat Biol. 1997;72:351–74. doi: 10.1080/095530097143149. [DOI] [PubMed] [Google Scholar]
- 110.Brenner DJ, Hlatky LR, Hahnfeldt PJ, et al. The linear-quadratic model and most other common radiobiological models result in similar predictions of time-dose relationships. Radiat Res. 1998;150:83–91. [PubMed] [Google Scholar]
- 111.Fertil B, Malaise EP. Intrinsic radiosensitivity of human cell lines is correlated radioresponsiveness of human tumors: analysis of 101 published survival curves. Int J Radiat Oncol Biol Phys. 1985;11:1699–707. doi: 10.1016/0360-3016(85)90223-8. [DOI] [PubMed] [Google Scholar]
- 112.Steel GG, Peacock JH. Why are some human tumours more radiosensitive than others? Radiother Oncol. 1989;15:63–72. doi: 10.1016/0167-8140(89)90119-9. [DOI] [PubMed] [Google Scholar]
- 113.Friedrich T, Durante M, Scholz M. Modelling cell survival after photon irradiation based on double strand break clustering in megabase pair chromatin loops. Radiat Res. 2012;178:385–94. doi: 10.1667/RR2964.1. [DOI] [PubMed] [Google Scholar]
- 114.Ando K, Kase Y. Biological characteristics of carbon ion-therapy. Int J Radiat Biol. 2009;85:715–28. doi: 10.1080/09553000903072470. [DOI] [PubMed] [Google Scholar]
- 115.Sørensen BS, Overgaard J, Bassler N. In vitro RBE-LET dependence for multiple particle types. Acta Oncol. 2011;50:757–62. doi: 10.3109/0284186X.2011.582518. [DOI] [PubMed] [Google Scholar]
- 116.Ando K. Biological gain of carbon-ion radiotherapy for the early response of tumor growth delay and against early response of skin reaction in mice. J Radiat Res. 2005;46:51–7. doi: 10.1269/jrr.46.51. [DOI] [PubMed] [Google Scholar]