

Abstract
Alkylating agent chemotherapy for malignant disease results in myelosuppression which significantly limits dose-escalation and potential clinical efficacy. Drug resistance gene therapy with mutant MGMT (P140K) gene-modified hematopoietic stem cells may circumvent this problem but has not been evaluated clinically. Here we show efficient, polyclonal engraftment of P140K-modified hematopoietic cells in patients with unmethylated MGMT promoter glioblastomas with apparently normal BM after well-tolerated, nonmyeloablative conditioning with BCNU. Increases in P140K-modified cells after post-transplant chemotherapy including temozolomide and O6-benzylguanine indicate protection and selection of gene-modified hematopoietic repopulating cells. Longitudinal retroviral integration site (RIS) analysis identified over 12,000 unique RIS in the first three patients with multiple clones present in PB of each patient throughout multiple chemotherapy treatments. To assess safety, RIS distribution was monitored over time and chemotherapy treatments. Two patients exhibited emergence of prominent clones harboring RIS associated with the intronic coding region of PRDM16 or the 3′ UTR of HMGA2 genes with no adverse clinical outcomes. All three patients surpassed the median survival for patients with unmethlyated MGMT promoter glioblastomas, with one patient alive and progression-free more than two years since diagnosis. We conclude that transplantation of P140K-expressing hematopoietic cells mediates chemoprotection and selection, potentially maximizing chemotherapy administration in the treatment of cancer and providing a strategy for increasing gene-corrected/therapeutic cell levels in patients with genetic or infectious diseases.
INTRODUCTION
Drug resistance gene therapy in hematopoietic stem cells (HSCs) has been proposed to confer protection of these cells and differentiated progeny from chemotherapy-associated toxicity (chemoprotection), as well as to mediate selection of gene-modified cells following transplantation (in vivo selection) to improve efficacy in hematological genetic or infectious diseases where transgene expression alone does not provide selective advantage (i.e. anti-HIV strategies and correction of hemoglobinopathies). An appropriate platform to simultaneously test these two drug-resistance gene therapy applications, in vivo selection and chemoprotection, is the cancer patient population in need of new strategies to reduce chemotherapy-associated myelotoxicity. One such cancer patient population in dire need of new therapies includes those diagnosed with brain malignancies (glioblastoma).
Although considerable efforts have been made to increase survival in glioblastoma patients, prognosis remains poor, despite aggressive therapy including surgery, radiation therapy combined with temozolomide chemotherapy (TMZ) and adjuvant TMZ chemotherapy. Survival is further compromised in patients harboring an unmethylated promoter for the methylguanine methyltransferase (MGMT) gene, indicating increased MGMT activity in tumor cells, which reduces cytotoxicity of alkylating chemotherapies like TMZ by repairing TMZ-induced DNA damage. O6-benzylguanine (O6BG) is an irreversible nucleoside inhibitor of MGMT postulated to increase efficacy of alkylating agents including TMZ; however, in Phase I and II studies combining O6BG with either N,N′-bis(2-chloroethyl)-N-nitroso-urea (BCNU) or TMZ, significant hematopoietic toxicity was observed, leading to dose reductions and/or discontinuation of chemotherapy (1–3). We and others have demonstrated preclinical utility of the O6BG-resistant MGMT mutant, P140K, both in vitro and in vivo, when expressed by hematopoietic progenitor and stem cells, to protect the hematopoietic system from toxicity associated with combined O6BG/alkylator chemotherapy (4–7).
Here we report results from the first 3 patients (herein anonymously identified as “P1,” “P2,” and “P3,” respectively) enrolled and treated on the current study. We determined the feasibility of infusing P140K gene-modified hematopoietic cells into these glioblastoma patients following nonmyeloablative BCNU conditioning. Following successful engraftment, we studied the level and clonality of gene-modified cells and the ability to administer chemotherapy consisting of O6BG and TMZ.
RESULTS
We performed CD34 enrichment of granulocyte colony stimulating factor (G-CSF)-mobilized peripheral blood (PB) followed by transduction of these cells with a Phoenix-Gibbon ape leukemia virus (GALV) pseudotyped gammaretrovirus P140K-expressing vector (Table 1 and fig. S1). Three patients (table S1) were treated with 600 mg/m2 BCNU between 48 and 52 hours before infusion of gene-modified cells for two reasons: (1) BCNU is an FDA-approved, blood-brain-barrier-permeable chemotherapeutic for use in glioblastoma patients and, (2) prior studies have shown feasibility of dose-intense BCNU with stem cell support in glioblastoma patients up to 1200 mg/m2 (8–10), suggesting that this single agent would facilitate engraftment of transplanted, gene-modified cells while maintaining stable disease during transplant recovery. Following BCNU administration and infusion of gene-modified cells, no significant BCNU-related toxicity was observed. Hematopoietic suppression associated with BCNU conditioning was moderate: no patient demonstrated an absolute neutrophil count (ANC) below 100/mm3 and no ANCs <500/mm3 persisted for more than 3 days in any patient (Fig. 1A). Patients received 8.9 × 10⁶ (P1), 21.9 × 10⁶ (P2) and 7.5 × 10⁶ (P3) cells/kg. Despite differences in total cell dose, all three patients demonstrated hematopoietic recovery from BCNU, indicated by ANC ≥ 1500/mm3 and platelet (PLT) count ≥ 100,000/mm3 within 28–35 days following infusion of gene-modified cells.
Table 1.
Efficiency of CD34+ Transduction with P140K-expressing, GALV-pseudotyped Retrovirus
| Patient | % MGMT+ Cells* (Day 3 After Transduction) | % MGMT+ Cells* (Day 10 After Transduction) | CFCs (per 100,000 Cells) | MND+ CFCs (%) |
|---|---|---|---|---|
| 1 | 51.9 | 34.9 | 2,600 | 70.6 |
| 2 | 59 | 44.7 | 13,500 | 79 |
| 3 | 64.4 | 51.6 | 21,600 | 74 |
As determined by intracellular MGMT staining of maintained liquid cultures assessed by flow cytometry (see also fig. S1).
Figure 1. Engraftment and persistence of P140K gene-modified cells.

(A) ANC, lymphocyte and PLT counts in PB as a function of time and chemotherapy. Cell counts on y-axis in thousand per cubic millimeter (mm3) at various time points post-transplantation of gene-modified cells (x-axis). Closed squares (■) represent PLTs, open circles (○) represent ANCs and closed diamonds (◆) represent lymphocytes. Dashed lines (--) represent retreatment threshold of PLTs (upper dashed line) and ANC (lower dashed line). (B) Gene marking in circulating WBC subsets. Graphs represent average proviral copy number per genome as determined by real-time PCR (y-axis), at various time points post-transplantation (x-axis) in bulk WBCs (closed squares; ■) CD13+ or CD15+ granulocytes (open circles; ○) and CD3+ lymphocytes (closed diamonds;◆). In both panels, inverted open triangles (△) indicate cycles of O6BG/TMZ chemotherapy. Closed triangle (▲) in P1 graph represents single dose-escalated cycle of TMZ (590 mg/m2).
All three patients demonstrated gene-modified cells in both PB granulocytes and lymphocytes by real-time polymerase chain reaction (PCR) up to 14 months after transplant (Fig. 1B). Transient increases in granulocyte marking corresponded with transient increases observed in white blood cell (WBC) populations in the same patient at the same time point (Fig. 1B). Varying levels of provirus were detected in enriched CD3+ T-cells among the three patients, but always at lower levels than that observed in WBCs or granulocytes, consistent with a non-myeloablative conditioning regimen.
These 3 patients received a total of 9, 3 and 4 cycles of combination chemotherapy including O6BG and TMZ, respectively. Pharmacokinetic studies of TMZ revealed an achieved physiological dose and metabolism equivalent to the range observed in pediatric patients who received the same dose and regimen of O6BG and TMZ (table S2) (11). As shown in Fig. 1B, increases in average proviral copy number were observed in WBCs and granulocytes in each patient following each chemotherapy cycle. Hematopoietic recovery was observed in each patient (Fig. 1A). Patient 1 (P1) demonstrated consistent recovery of both PLTs and ANC to retreatment thresholds (1500 ANC/mm3 and 100,000 platelets/mm3) within 28–42 days following each cycle, but experienced a retreatment delay between cycles 2 and 3 due to clinical evaluation for pseudoprogression (supplementary discussion). Patient 2 (P2) initially demonstrated drops in both ANC and PLT counts through cycle 2, but not below an ANC of 830/mm3 and PLT count of 86,000/mm3 (Fig. 1A). Importantly, following cycle 3 ANC and PLT counts never dropped below retreatment thresholds, demonstrating chemoprotection of both hematopoietic compartments. Patient 3 (P3) also demonstrated drops in both ANC and PLTs following initial cycles of O6BG/TMZ chemotherapy, with ANC and platelet nadirs of 1,240/mm3 and 21,000/mm3, respectively (Fig. 1A); however, following cycle 2, no drop in ANC below retreatment thresholds was observed in this patient, indicating chemoprotection of the myeloid compartment.
Southern blot analysis of patient WBC DNA using a 522-bp probe corresponding to the P140K transgene sequence demonstrated proviral DNA in all patients at 9 months post-transplantation (Fig. 2A). Western blot analysis of protein from patient WBCs demonstrated persistent MGMT expression compared with non-transplanted human WBCs (Fig. 2B). Furthermore, band intensity corresponded with average proviral copy number per genome as assessed by real-time PCR of WBC DNA at the same study time point (corresponding proviral copy numbers: 0.24 (P1), 0.74 (P2) and 0.67 (P3)). Increases in provirus+ PB CD34+ colony forming cells (CFCs) were observed in all 3 patients following chemotherapy, although this enrichment was slower to manifest in P1 (Fig. 2C). The number of provirus integrants per cell in each patient at 8–9 months following transplant was determined by dividing the percentage of gene-modified PB WBCs calculated by quantitative PCR by the percentage of CD34+ CFCs positive for provirus observed at the same time point (% gene-modified WBCs = provirus copy number determined by PCR × 100%; assuming one provirus copy per cell). Based on this calculation, the lowest theoretical value possible should be 1.0 vector integrants per cell. Between 262 and 318 days following transplant, calculated vector integrants per cell in P1, P2 and P3, respectively, were 0.68, 0.94 and 0.91 based on PB WBC marking levels of 18.3%, 63.6% and 85.2%, and CFC marking levels of 27%, 67.6% and 93.6%. These data suggest that most cells contained a single provirus integrant; however, the value of 0.68 observed in P1 is outside the margin of error for this calculation.
Figure 2. Detection of P140K gene sequence and MGMT protein expression in patient hematopoietic cells following transplantation.

(A) Southern blot analysis for P140K gene sequence in DNA. Positive control is DNA isolated from P140K-GFP expressing primate WBCs. Standards represent DNA isolated from WBCs of the same primate, sorted for GFP by flow cytometry and mixed with GFP−WBC DNA. Negative control is WBC DNA collected from a non-transplanted human donor. Patient samples represent DNA isolated from WBCs at nine months post-transplantation. (B) MGMT expression in total protein lysates from patient WBCs at 4 months post-transplantation as assessed by western blotting. Positive control is purified P140K protein from the vector producing line generated for this study, negative control is total protein from WBCs from a non-transplanted human donor. (C) Colony forming assays from PB CD34+ cells demonstrate repopulating cells harboring gene modification. Photographs illustrate representative colonies derived from PB CD34+ cells from P1, P2 and P3. Bar graph shows percentage of colonies positive for MND provirus at multiple time points for each patient. Numbers above each bar represent the number of O6BG/TMZ chemotherapy cycles received prior to colony forming assay time point. Each bar value is based on a minimum of 20 colonies assessed by PCR.
Given persistent gene marking suggesting modification of long-term repopulating cells, we conducted longitudinal retrovirus integration site (RIS) analysis in patients receiving P140K gene-modified cells in attempt to identify any selective advantage for gene-modified clones over time or following repeated O6BG/TMZ regimens. We were able to identify over 12,000 unique retrovirus integration sites (RISs) in the 3 patients (table S3), and employed a capture frequency analysis (12) as a semi-quantitative assay to identify potentially dominant clones. At every time point we identified those unique RIS that were sequenced most frequently, ranked the top 10, and grouped remaining unique RIS into a large pool referred to as ‘All others’ (Fig. 3A–C).
Figure 3. Longitudinal RIS analysis of P140K gene-modified hematopoietic cells before and after O6BG/TMZ chemotherapy.

All unique RIS are plotted based on the number of times the RIS was sequenced (capture frequency) and normalized to the percentage of total RIS captured at each time point for each patient, P1 (A), P2 (B), and P3 (C). The gray portion of each bar represents the percentage of corresponding to all but the Top #10 most frequently captured RIS (”All others”). The most frequent RISs, Top 1 to Top 10 (Top 1= the most frequently captured and Top 10= the 10th most frequently captured), are represented by the white boxed lower portions of the bar graph and are designated by the chromosome and adjusted position below the respective bar graph. The first RIS identified chronologically as more frequent at a given time point that was also identified at a later time point as more frequent was colored gold in all of the corresponding bar graphs where it was identified and shaded gold below the associated bar graph. The same labeling procedure was done for the second RIS identified (blue) and third RIS identified (purple). For dominant RIS, “Hematopoietic Contribution of Dominant Clone(s) (%)” was calculated by multiplying the total gene marking (solid black line with closed circles) assuming the “Average Proviral Copy Number” as a percentage (i.e. 0.1 is 10%) by the “Relative Sequence Capture (%)” of the dominant clone and plotted as a dashed line with closed circles for the gold shaded RIS and a dashed line with open squares for blue shaded RIS (P1 only). All DNA was isolated for analysis from PB except where identified as BM. Asterisk (panel A) identifies a purple shaded box that cannot be easily visualized.
In P2, the most frequent (top 10 captured) RISs were different at each time point, and no top 10 RIS re-emerged as a most frequent RIS in any subsequent time point. However, in P1 and P3, there were multiple RISs detected in PB and bone marrow (BM) WBCs that emerged as the top 10 most frequently captured RISs at multiple, sequential time points (Fig. 3A and 3C, gold, blue and violet shading). RIS PCR product analysis confirmed that emergence of these captured sites was not due to PCR bias based on the diverse array of varying DNA fragment lengths (fig. S2 A–C) (13). These clones were defined as “dominant” based on their identification as top 10 most frequently captured RIS in ≥2 consecutive time points following transplant. Despite the identification of these dominant clones, clinical evaluation of BM and PB did not identify any evidence of myelodysplastic syndrome (MDS) or leukemia in either patient during this time and both patients displayed normal BM cytogenetics.
In P1, 3 dominant clones were identified. These RISs demonstrated different capture frequency profiles, suggesting they represent individual clones rather than a single clone with multiple provirus integrants. Two of the clones exhibited RISs mapping to the same intronic region between exons 1 and 2 of the PR-domain-containing 16 (PRDM16) gene (Fig. 3A gold and blue shaded quadrants) and the third to an intronic region in SET binding protein 1 (SETBP1) (Fig. 3A violet shaded quadrant) similar to clones reported in a gene therapy trial for X-linked chronic granulomatous disease (X-CGD) (14). Focusing on PRDM16 locus-associated RISs because of persistent clonal contribution, PCR-based clone tracking in WBC DNA over time demonstrated sustained presence of both clones at multiple time points following initial RIS identification (Fig. 4A). Additionally, clone tracking PCR in CD15+ granulocytes and CD3+ lymphocytes at day 472 post transplant detected both RISs in these differentiated hematopoietic subsets (fig. S4A) suggestive of HSC origin(s).
Figure 4. Longitudinal clone tracking and analysis of RIS-associated gene transcript expression.

Panels A and B: Agarose gel electrophoresis of PCR products obtained using primer sets specific for either PRDM16 Clone 3087539 or PRDM16 Clone 2988812 (A), HMGA2 Clone 3087539 (B), the MND provirus backbone as a control for presence of gene modified cells or β-Actin as a control for DNA template integrity in the PCR reaction. Bands observed at a different molecular weight in the topmost panel were determined to be an artifact of the PCR reaction by sequencing analysis. Panels C and D: Agarose gel electrophoresis of PCR products obtained using primer sets for PRDM16 transcript spanning the exon 16:exon 17 junction (C), HMGA2 transcript spanning the exon 4:exon 5 junction (D), MGMT transcripts or GAPDH transcripts (housekeeping gene control).
The 2 dominant clones identified in P3 both mapped to the 3′ untranslated region (UTR) in exon 5 of the high mobility group A2 (HMGA2) gene. While retrovirus integration associated with the HMGA2 gene has been reported in gene therapy trials to treat β-thalassemia and Wiskott Aldrich Syndrome (WAS) (15,16), RISs identified in these two studies mapped to the 3rd exon of the HMGA2 gene. The dominant clone, HMGA2 66,358,053, which persisted over an extended period of time, HMGA2 (Fig. 3C gold shaded quadrants), appeared in RIS analysis initially at day 124 following transplant, emerged as a top 10 capture at day 230 post-transplant (following chemotherapy cycle 3) and persisted as a top 10 capture thereafter (total of 432 days of follow-up) (Fig. 3C). This was confirmed by PCR-based clone tracking in PB WBC DNA (Fig. 4B). Additionally, clone tracking PCR in ficoll-purified granulocytes and CD3+ lymphocytes at day 396 after transplant detected clonal sequence in these differentiated hematopoietic subsets (fig. S4B), again suggesting HSC origin.
As insertional activation of RIS-proximal genes has been associated with oncogenic transformation in prior trials for X-linked severe combined immunodeficiency syndrome (SCID-X1), CGD and WAS (17–19), PRDM16 and HMGA2 transcript expression were evaluated in WBCs from P1 and P3, respectively (Fig. 4C–D). For PRDM16, a primer set spanning the exon16:exon17 junction was used in a conventional PCR reaction with complimentary DNA (cDNA) reverse-transcribed from PB WBC RNA. Agarose gel resolution of PCR products demonstrated no PRDM16 transcript prior to emergence of the two dominant clones in P1 (Fig. 4C). Transcripts appear at day 200 following transplant (corresponding with emergence of PRDM16 3,087,541 as a top 10 capture in RIS analyses), disappear for the subsequent time point (day 241), and then reappear at day 234 with persistent detection through day 509 in both PB and BM samples. As transcription from the provirus promoter is thought to induce activity of the nearby proto-oncogene promoter during insertional transactivation, we also examined MGMT transcripts in the same PB WBC samples. While the primer set used in these reactions does not distinguish wild-type MGMT from P140K, PB WBCs typically do not express detectable levels of wild-type MGMT (20,21). Here, we found that MGMT transcript was detected at several time points prior to detection of PRDM16 expression and correlated with PRDM16 expression, with the exception of the day 384 BM WBC sample (Fig. 4C).
Regarding HMGA2 expression in P3, using reverse-transcriptase PCR methods and a primer set corresponding to the exon4:exon5 junction of the HMGA2 mRNA, we found that HMGA2 transcripts were detectable in PB WBCs at a single time point (day 181) prior to emergence of HMGA2 66,358,053 as a top 10 capture, then remained undetectable until day 262, 32 days after detection of HMGA2 66,358,053 as a top 10 capture in RIS studies (Fig. 4D). Increased transcript expression persisted through follow-up (543 days). In P3, MGMT transcript expression was detectable prior to clonal emergence and correlated with HMGA2 expression at all time points examined.
DISCUSSION
Here we demonstrate efficient, high-level engraftment of P140K gene-modified hematopoietic cells in glioblastoma patients following well-tolerated, nonmyeloablative conditioning with BCNU. We show persistence of P140K gene-modified cells in multiple hematopoietic lineages after several rounds of combination O6BG and TMZ chemotherapy. We observed transient increases in PB P140K gene-modified cells following each round of chemotherapy in all 3 patients, with 2-fold increases in circulating gene-modified CD34+ progenitors in 2 of 3 patients after only 2 rounds of drug treatment. Multiple clones contributed to hematopoietic repopulation and survived multiple rounds of chemotherapy. Most importantly, chemotherapy was well-tolerated in all patients, with acceptable hematopoietic toxicity and no significant extramedullary toxicity. All 3 patients treated surpassed the median survival for glioblastoma patients with unmethylated MGMT promoter status in tumor cells (12 months), with 2 out of 3 patients displaying stable disease at 12 months from diagnosis and 1 patient displaying no evidence for disease progression (Fig. 5) (22).
Figure 5. Evidence for stable disease in two patients at one year post-diagnosis.
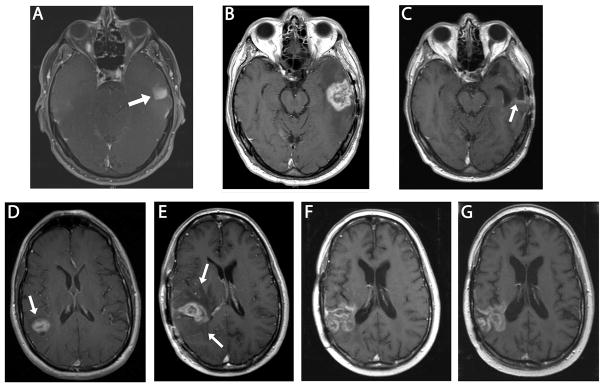
Upper Series: MRI of the brain (P1). Axial T1 post gadolinium sequences at the level of midbrain. (A) Area of enhancement seen in left temporal lobe at initial presentation (arrow). Gross total resection was performed and histology confirmed glioblastoma, World Health Organization (WHO) Grade IV. (B) Area of enhancement and surrounding edema in left temporal lobe 6 months following diagnosis (interpreted as pseudoprogression). (C) Stable disease with faint area of linear enhancement at posterior margin of the resection cavity (arrow) 12 months following initial diagnosis (6 months following 2nd craniotomy) after 4 additional cycles of O6BG/TMZ chemotherapy. Lower series: MRI of the brain (P3). Axial T1 post gadolinium images. (D) Enhancing lesion in right parietal lobe (arrow) at initial presentation. (E) First post-radiation scan, enlargement of the enhancing area and associated vasogenic edema (arrow heads) are present (interpreted as possible pseudoprogression). (F) Six months from original diagnosis, after 2 cycles of O6BG/TMZ chemotherapy, area of enhancement has enlarged but surrounding edema has diminished and patient was clinically stable. (G) Eleven months from original diagnosis, after 2 additional doses of O6BG/TMZ chemotherapy. Stable area of contrast enhancement.
All patients demonstrated recovery from BCNU, engraftment of P140K gene-modified cells and maintenance of stable disease during the transplant portion of this study, supporting the clinical feasibility of this approach. Notably, the BCNU dose administered (600 mg/m2) for conditioning was lower than dose ranges used as chemotherapy for glioma in previous studies of high-dose BCNU (8–10,23), and resulted in only mild to moderate myelosuppression. Furthermore, no significant BCNU-related toxicity has been observed in any patient to date.
The clinical benefit of P140K-modifed hematopoietic cells should manifest in protection of blood cells from otherwise toxic doses of chemotherapy (chemoprotection). Here, we interpret chemoprotection as a decrease in, or lack of, myelosuppression following O6BG/TMZ chemotherapy with recovery to retreatment criteria between 28–42 days since the prior cycle and, possibly, the ability to tolerate escalated doses of TMZ. In this study, patients were treated with the O6BG dose and regimen previously described to maximize TMZ sensitization in gliomas by prolonged MGMT depletion (24) and also employed in Phase I and II studies of O6BG with TMZ described earlier (2,3). In these studies, the maximum tolerated dose (MTD) for single dose TMZ was established as 472 mg/m2 based on observed hematopoietic toxicity when given in combination with O6BG infusion. In the Phase I study, Quinn et al. (2005) reported that the average number of chemotherapy cycles received by patients treated with a TMZ dose of 472 mg/m2 with an identical O6BG administration schedule and 28-day cycle length, without the benefit of P140K-transduced hematopoietic cells, was 1.5 cycles (n = 7 patients; Range: 1–4 cycles). In the Phase II study, numbers of chemotherapy cycles are not reported; however, a 47% incidence of neutropenia and a 12% incidence of thrombocytopenia were reported in patients receiving the same chemotherapy regimen described herein. We report an average of 5.3 cycles per patient in the context of P140K-modified hematopoietic cells (n=3; Range 3–9 cycles). Each patient displayed different hematopoietic recovery kinetics following chemotherapy, but chemoprotection, as determined by the reduced frequency of Grade 4 hematologic toxicities and recovery of blood cell counts following each cycle, was observed.
Evaluation and subsequent surgery confirming pseudoprogression in P1 delayed administration of a dose escalated cycle. This led to a decrease in marking before the administration of cycle 3 and likely explains hematopoietic toxicity observed with this cycle. It is likely that cells responsible for short-term engraftment, (observed chemoprotection in cycles 1 and 2), were exhausted and the proportion of gene-modified long-term repopulating cells was lower and/or still quiescent at this time. Indeed, declines in both WBC gene marking and gene-modified circulating CD34+ CFCs occurred over this time period (Fig. 1). A similar decline in P140K-modified murine 32D cells was observed in culture in the absence of selective pressure exerted by O6BG and BCNU (7). It is also possible that the number of modified stem cells transplanted was lower in this patient given the lower colony forming content compared to P2 and P3. Whether this is the result of suboptimal conditions for HSC collection, gene modification or engraftment of true, pluripotent HSCs following non-myeloablative conditioning is unknown. Importantly, P1 was able to receive 6 additional cycles, for a total of 9 cycles, possibly the highest number of O6BG/TMZ cycles given at this TMZ dose to patients with glioblastoma. Declining gene marking observed in P1 both during the delayed chemotherapy cycle and following chemotherapy discontinuation could suggest that retrovirus transduction or P140K transgene expression is not neutral to hematopoietic stem cells in the absence of selective pressure. However, we observed sustained gene marking in P2 and P3 for many months following study discontinuation, suggesting this decline in gene marking is not due to transduction or P140K expression, but instead due to either inter-patient variations in gene-modified HSCs transplanted, engrafted or repopulating for sustained, long-term hematopoiesis following this high number of chemotherapy cycles (>2 times that received by P2 or P3). These data demonstrate a correlation between the level of P140K gene-modified cells and chemoprotection observed with this chemotherapy regimen, consistent with our previously published studies in the dog (4) and nonhuman primate (5).
Disease progression in P2 at 9 months since diagnosis prevented study continuation, despite robust multilineage chemoprotection. Stable gene marking observed in WBCs, without additional alkylating agent chemotherapy, more than 6 months since trial discontinuation confirms sustained long-term repopulating potential of gene-modified cells in this patient.
BM analysis in P3 following cycle 3 revealed hypocellularity (supplemental discussion); however, no evidence of myelodysplastic syndrome or an underlying platelet defect and, importantly, no cytogenetic abnormalities, were observed. Prolonged thrombocytopenia has been observed in conjunction with TMZ administration in multiple reports; but patients rarely recover PLT counts in these instances (25–27). It is possible that engraftment of committed PLT progenitors was decreased in this patient considering the lower cell dose received; however, lack of transgene expression or drug-induced thrombocytopenia independent of MGMT activity in this cell type cannot be ruled out.
The relative hematopoietic chemoprotection following treatment with O6BG/TMZ as a function of gene marking described above correlates well with prior nonhuman primate studies conducted in our laboratory (5). In the prior studies, following transplantation with HSCs gene-modified with a gammaretrovirus expressing P140K, O6BG/TMZ regimens resulted in very similar outcomes, robust multilineage chemoprotection when gene marking levels were >20% of PB WBCs and transient increases in gene marking. We were not able to achieve stable increases in gene marking in these animals until application of the drug combination of O6BG/BCNU, likely due to different mechanisms of cytotoxicity including formation of secondary DNA adducts (i.e. BCNU-induced DNA interstrand cross-links). Furthermore, nonhuman primates in these studies received chemotherapy after gene-marking levels stabilized following transplant (>200 days), whereas patients reported here received chemotherapy at 1 month after infusion of gene-modified cells. This suggests that either the toxicity of the alkylating agent used or the timing of alkylating agent administration relative to engraftment of gene-modified cells could play a role in the in vivo selection kinetics of P140K-containing cells.
The biological outcome of drug-resistant, retrovirus gene-modified HSCs must be critically examined because gene-modified cells have a selective growth/survival advantage, albeit transient, during chemotherapy. In prior clinical trials utilizing gene-modified cells with an intrinsic growth advantage (X-SCID), a reduced clonal repertoire was observed that eventually led to frank leukemia (28). We have currently identified over 12,000 unique RIS in the 3 patients described herein, with multiple clones identified in PB of each subject at each time point examined. We have identified a number of RIS that we continue to monitor individually (i.e. PRDM16 [P1, 2 unique RIS], and HMGA2 [P3]), while at the same time continuing global longitudinal analysis. Interestingly, the emergence of PRDM16 dominant clones at a time point after transplant where the majority of short-term repopulating cells should have been eliminated from circulation and long-term repopulating HSCs take over repopulation (100–250 days after transplant) raises the possibility of initial oligoclonal reconstitution by a gene-modified HSC or pronounced reduction of the initial polycolonal population to a more oligoclonal population as a result of chemotherapy. Importantly, the gene-modified clones with RIS in the PRDM16 (P1) and HMAG2 (P3) loci that showed the most robust expansion were detected in purified populations of both granulocytes and CD3+ cells (fig. S4), suggesting gene-modified HSC origins with differentiation capacity. Currently, we cannot rule out the presence of RIS-mediated expansion of longer-lived granulocyte progenitors in these patients, or the possibility that RISs associated with these loci could be implicated in extension of the normal HSC lifespan. To approximate hematopoietic contribution of gene-modified dominant clones, we multiplied the overall gene marking assessed by quantitative PCR by the percentage a given clone contributed to the gene-modified pool assessed by the capture frequency analysis (Fig. 3A,C solid black lines and dashed lines). Using this calculation, we determined that despite the increased contribution of PRDM16-associated clones to the detectable gene-modified cell pool in P1, PRDM16 overall hematopoietic contribution dropped due to overall loss of gene-modified cells (discussed above). Interestingly, the dominant gene-modified clone with an RIS in the HMGA2 locus in P3 expanded and stabilized in both the detectable gene-modified WBC population and overall hematopoietic contribution, similar to observations reported in a gene therapy clinical trial to treat β-thalassemia patients which resulted in HMGA2 activation (15).
The time frame following transplant in which the two PRDM16 clones observed in P1 became consistently dominant is slightly longer than that observed in an X-CGD patient with similar dominant clones (14). In contrast to the X-CGD studies, we found increased PRDM16 transcript expression in WBCs from this patient, which persisted even after the contribution of gene-modified cells declined to less than 1% of PB WBCs. While the specific gammaretroviral vector used in these studies may play a role in this difference, sustained PRDM16 expression after substantial decline in gene marking suggests that PRDM16 expression may be mutually exclusive of gene marking in this patient; however, persistence of a few cells of clonal origin with dramatically up-regulated PRDM16 expression cannot be ruled out. Comparative genomic hybridization analysis of 3397 loci, including PRDM16, was performed on a clinical BM sample from P1 at day 509 after transplant but found no abnormalities in the DNA of this specimen at any of the loci tested.
The time frame in which the dominant HMGA2 clone emerged in P3 was consistent with that observed in a patient with β-thalassemia who exhibited clonal predominance associated with an HMGA2-proximal insertion (15). In contrast to the previously reported RIS in the HMGA2 locus, the RIS reported herein maps to exon 5 in the 3′ UTR of the HMGA2 gene, rather than the third exon RIS reported in the β-thalassemia trial (16). While we also report increased HMGA2 transcript expression associated with clonal prevalence, we do not suspect truncation of the HMGA2 transcript based on the site of integration, as well as upon our studies examining the exon4:exon5 junction of the processed mRNA. While expression of full-length HMGA2 has been associated with several types of malignancies (29–31), we did not observe evidence for leukemogenesis in P3 during the duration of study, as observed in healthy gene therapy recipients enrolled in an X-SCID trial who demonstrated HMGA2-proximal clonal insertions that elicited clonal expansion (32). Further molecular evaluation and biological consequences of dominant PRDM16 and HMGA2 clones observed in this study are currently underway. Importantly, no morphologic or cytogenetic abnormalities were observed in BM from these patients following clonal emergence, perhaps owing to the lack of additional genetic or biologic abnormalities present in these patients prior to the introduction of gene-modified cells.
Given reported MGMT expression in other cancer types (33), this study predicts the value of P140K gene therapy in multiple clinical settings where O6BG may be utilized to potentiate alkylating chemotherapy efficacy. In addition, these studies provide a basis for P140K as a drug-resistance strategy to increase gene-modified cells to therapeutic thresholds in patients with genetic diseases or for HSC gene therapy strategies for HIV/AIDS to increase gene-modified “protected” lymphocytes.
In conclusion, these data support continued development of P140K-modified hematopoietic progenitors as a chemoprotective strategy in cancers, including glioblastoma, where benefit from combined O6BG/DNA alkylating agent chemotherapy has been hindered by hematopoietic toxicity. Lack of extramedullary toxicity in study patients suggests that this approach will allow for administration of multiple cycles of this chemotherapy, possibly at higher, more effective, doses potentially leading to better treatment outcomes.
MATERIALS AND METHODS
Patient selection
This study was approved by an Institutional Review Board (Fred Hutchinson Cancer Research Center), the U.S. Food and Drug Administration (FDA) and the National Cancer Institute (NCI) Cancer Therapeutics Evaluation Program (CTEP) and conformed to NIH Guidelines for research involving recombinant DNA molecules. Informed consent was obtained from all patients. Patients diagnosed with glioblastoma multiforme following ≥50% initial surgical resection of the primary lesion were consented to have their brain tumor tissue tested for MGMT promoter methylation status using previously described methods (34). Patients with unmethylated tumor MGMT promoter status were considered eligible.
Study design
Patients underwent standard radiotherapy without concomitant TMZ. Following radiotherapy, patients received daily G-CSF (Filgrastim; 16μg/kg/day) subcutaneously for 5 consecutive days to mobilize CD34+ HSCs. On the fourth and fifth days of mobilization, leukapheresis was performed. Following collection, patients received intravenous BCNU (Carmustine; 600mg/m2) as both conditioning prior to transplant and chemotherapy for residual disease 48–56 hours prior to cell infusion. Recovery from BCNU, (ANC ≥ 1,500/mm3, platelet count ≥ 100,000, hemoglobin >8 g/dL, aspartate aminotransferase (SGOT) < 2.5 times upper limit of normal (ULN), total bilirubin < 1.5 times ULN, creatinine < 1.5 times ULN and all other toxicities resolved to Grade I (based on CTCAEv3.0) or baseline), initiated 28-day cycles of O6BG/TMZ chemotherapy. O6BG was administered intravenously over 1 hour at a dose of 120 mg/m2, then continuously for 2 days (30 mg/m2/day). Temozolomide was administered orally within 1 hour of completing bolus O6BG infusion. This dosing regimen is identical to that used in Phase I and II studies by Quinn and colleagues in which hematopoietic toxicity was the most frequent adverse event observed (2,3). The initial dose of TMZ administered was 472 mg/m2, the maximum tolerated dose (MTD) defined in the aforementioned studies, with allowance for dose escalation of TMZ in 25% increments to a maximum of 925 mg/m2. Retreatment criteria were identical to BCNU recovery criteria listed above. Additional criteria for TMZ dose escalation included ANC within normal range (>1,800/mm3) and >1% gene modified granulocytes detectable in PB.
Production of P140K gene-modified CD34+ hematopoietic cells
Following leukapheresis, cell product was subjected to CD34 selection using a CliniMACS immunomagnetic system (Miltenyi Biotec, Bisley, United Kingdom). CD34+ cells were transduced with a Phoenix-GALV pseudotyped gammaretrovirus vector expressing P140K (see supplemental methods) as previously described (5). Clinical vector was produced by National Gene Vector Laboratories (NGVL; Indiana University). Ex vivo processing was performed under GMP conditions either within the Fred Hutchinson Cancer Research Center Cell Production Facility or the University of Washington Gene and Cell Therapy Laboratory.
Colony-forming assays
WBCs were CD34 enriched by immunomagnetic separation (Miltenyi Biotec, Bisley, United Kingdom) and cultured in methylcellulose (Stem Cell Technologies, Vancouver, British Columbia) as previously described (35). Resulting colonies were scored, isolated and analyzed by PCR for proviral sequences.
Quantitative real-time PCR (TaqMan)
Gene marking was analyzed by TaqMan 5′ nuclease quantitative real-time PCR assay as previously described (5) with the following modification: DNA was analyzed in duplicate with an MND-specific primer/probe combination (MNDF: 5′-TCT GTC TTT GTG CGT GTT TGT G-3′: MNDR: 5′-GTC CGC CAG ATA CAG AGC TAG TTA G-3′ (IDT, Coralville IA); probe MND-P: 5′-CGG CAT CTA ATG TTT GCG CCT GC-3′ (ABI, Branchburg, NJ)). Retrovirus-specific standards consisted of diluted DNA extracted from cell lines transduced with a single copy of a MND-containing retrovirus vector.
Analysis of hematopoietic subsets
WBCs were either sorted using a BD FACSAria (Becton Dickinson, San Jose, CA) or were subjected to immunomagnetic bead separation using an AutoMACS device (Miltenyi Biotec, Auburn, CA). For flow-based sorting, WBCs were simultaneously labeled with fluorescence-conjugated monoclonal antibodies specific to CD13 and CD3 (BD Biosciences, Franklin Lakes, NJ). Forward and side light scatter discerned total cell population and labeled cells were classified by 2-color flow cytometry. Side light scatter was used to further distinguish bulk CD3+ and CD13+ WBCs. For immunomagnetic separations, cells were incubated with either CD15-conjugated or CD3-conjugated magnetic beads (Miltenyi) and were enriched using the AutoMACS device per the manufacturer’s protocol.
Western blot analysis
Completed using standard procedures (36). Antibodies used included anti-human MGMT (Kamiya Biomedical, Tukwila, WA) and goat anti-mouse IgG1 conjugated to horseradish peroxidase (BD Biosciences).
Southern blot analysis
Completed using standard procedures (37). A 522bp fragment from the cis-acting region of the integrated provirus was excised from patient WBC DNA and a radiolabeled probe spanning the P140K transgene was used for detection. Green-fluorescence protein (GFP)+ WBCs from a macaque transplanted with P140K-GFP gene-modifed HSCs were sorted by flow cytometry. GFP+ WBC DNA was then mixed at different ratios with GFP−WBC DNA to generate standards.
Modified genome sequencing (MGS)-PCR for detection of retrovirus integration sites
We adapted a whole genome sequencing approach for RIS amplification, replacing restriction enzyme digestion with nebulization, randomly shearing DNA to avoid restriction site bias (for rationale and expanded methods, see supplemental methods). Briefly, 3 μg of DNA is nebulized with pressurized nitrogen for 30 seconds. Fragmented DNA is isolated, polished, and modified linkers are ligated following manufacturers protocol (454/Roche-GS 20 DNA library preparation kit). About 100–200 ng of double stranded (ds)DNA is then amplified in sequential nested exponential PCR reactions (Primer pair #1: LTR-specific MND-PST-1-5′-biotin-ATC CTG TTT GGC CCA TAT TCT CCT G-3′ and linker specific LC1 1-5′-GAC CCG GGA GAT CTG AAT TC-3′) and (Primer pair #2: LTR-specific AMP-MND-(Barcode)-PST-2A: 5′-CGT ATC GCC TCC CTC GCG CCA TCA G (Barcode) CAA ACC TAC AGG TGG GGT CT-3′ and linker specific AMP-LC2-BT- 5′-CTA TGC GCC TTG CCA GCC CGC TCA GGA TCT GAA TTC AGT GGC ACA G -3′). LTR-specific primer MND-PST-1 is biotin-tagged to capture/wash specific products from the first nested PCR, DNA is diluted 1:100 in H2O prior to second nested PCR with barcoded LTR-specific and modified linker-specific primers fused to sequences for compatibility to 454/Roche-based titanium pyrosequencing. PCR products are visualized on agarose gel and DNA fragments ranging from ~400–800bp are gel purified from a 2% agarose gel and sequenced by massively paralleled pyrosequencing procedure available from 454/Roche following standard procedures.
Processing retrovirus integration sites
For PCR-based LTR-chromosome junctions, DNA sequences were processed as follows: valid integration sites were scored after locating retrovirus LTR intervening human genomic DNA and linker cassette sequence. The resulting junction sequences were aligned to version 1 of the human genome using a stand-alone version of BLAT (38) that generates a BLAST alignment score. PERL programs were also used to compare localized integration sites to various chromosomal features by using tables available from the UCSC database (39). A random data set of 10,000 genomic positions was generated as a control data set previously described (40).
Genomic mapping of retrovirus integration sites
To analyze clustering around proto-oncogene TSS we used similar sets of random genomic positions of the same size as our gammaretrovirus LTR-chromosome junction databases. PERL programs were used to determine the frequencies of integrants near a list of unique proto-oncogenes compiled from the Sanger Institute Cancer Gene Census (http:www.sanger.ac.uk/genetics/CGP/Census/) and the Mouse Retrovirus Tagged Cancer Gene Database (http://rtcgd.ncifcrf.gov/).To automate the search process, Locuslink identification numbers have been converted to a RefSeq designation using and the Database for Annotation, Visualization and Integrated Discovery (DAVID) version 2.1 (http://david.abcc.ncifcrf.gov/) and compared to RefSeq genes that contained gammaretroviral integration sites within their transcribed regions or within up to 50 kb upstream or downstream of the transcript start site. Statistical significance was determined using the chi2 test to compare vector integration site frequencies with those of randomly generated genomic positions, and p values less than 0.05 were considered significant.
Supplementary Material
Table S1. Individual Patient Data
Table S2. Pharmacokinetics of TMZ
Table S3. Unique RIS in GBM Patients
Table S4. CIS in GBM Patients
Table S5. Over-represented Gene Classes Near RIS
Fig. S1 Efficient transduction of CD34+ hematopoietic cells with a P140K-expressing PhGALV-pseudotyped gammaretrovirus
Fig. S2. RIS distribution at the PRDM16 and HMGA2 loci
Fig. S3. Shear site analyses of dominant clones
Fig. S4. Clonal tracking by PCR in mature WBC lineages
Acknowledgments
We would like to thank Dr. Kenneth Cornetta and the Indiana University Virus Production Facility for production of the clinical grade virus used in this study, Dr. Pamela S. Becker for assisting initiation of the reported study, as well as Dr. Jeanine McCune and Linda Risler for assistance with pharmacokinetic analyses, Dr. Frederic Bushman for assistance with RIS analyses and interpretation RIS data and Dr. Martin Wohlfahrt for assistance with Southern blot analyses. Allie Evans, Christina Ironside, Sum Ying Chiu, Nathaniel Williams and Garrick Horn are acknowledged for technical assistance in conduct of this work. We would also like to thank the Gene and Cell Therapy Laboratory of the University of Washington, the Cell Processing Facility of the Fred Hutchinson Cancer Research Center, and the Cellular Therapy Laboratory of the Seattle Cancer Care Alliance for support during post-collection processing and transduction. We also thank all clinical service teams involved in conduct of this study including the Neuro-oncology and Infusion Service teams of the University of Washington Medical Center and Seattle Cancer Care Alliance, the Neurological Surgery and Radiation Oncology teams of the University of Washington Medical Center and the Gold Autologous Transplant Team of the Seattle Cancer Care Alliance. We also thank Dr. Alvaro Hernandez, Chris Wright and staff at the High-Throughput Sequencing and Genotyping Unit at the Roy J. Carver Biotechnology Center at the University of Illinois at Urbana-Champaign for providing support and pyrosequencing services for RIS analysis. We also appreciate Helen Crawford and Bonnie Larson’s assistance in preparing the manuscript.
Funding: The authors are grateful for research funding from the National Institutes of Health, Bethesda, MD grants R01CA114218, P30DK056465, K01DK076973, and R01HL074162. H.-P. Kiem is a Markey Molecular Medicine Investigator and the recipient of the José Carreras/ E. Donnall Thomas Endowed Chair for Cancer Research. The content is solely the responsibility of the authors and does not necessarily represent the official views of the National Institutes of Health nor its subsidiary Institutes and Centers.
Footnotes
Authors’ contributions: J.E.A. contributed to trial design, patient recruiting, enrollment and treatment on trial, supervised and performed manufacturing of cell products, gene marking assays, clone tracking assays, sample processing and distribution, coordinated clinical, laboratory and regulatory processes, interpreted the data and wrote the manuscript. B.C.B. contributed to trial design, optimized cell manufacturing processes and correlative in vitro and large animal studies, conceived, developed and qualified the vector production system as well as gene marking, clone tracking and global RIS assays, supervised and performed manufacturing of cell products and global RIS assays, interpreted the data and wrote the manuscript. G.D.T. performed bioinformatic analyses of RIS data and participated in interpretation of RIS data. T.N. performed correlative preclinical studies, participated in study design and conceived and constructed the clinical vector. J.K.R. contributed to trial design, patient recruiting, enrollment, treatment on trial and follow-up. D.L.S. contributed to trial design, patient recruiting, enrollment, treatment on trial and follow-up. M.M.M. contributed to trial design, patient recruiting, enrollment, treatment on trial and follow-up and interpreted clinical response. H.-P.K. conceived and designed the trial, coordinated and supervised clinical, laboratory and regulatory processes, interpreted the data and wrote the manuscript.
Competing interests: M.M.M. received honoraria from Schering-Plough. There are no other disclosures.
Accession numbers: Not applicable.
REFERENCES and NOTES
- 1.Friedman HS, Pluda J, Quinn JA, Ewesuedo RB, Long L, Friedman AH, Cokgor I, Colvin OM, Haglund MM, Ashley DM, Rich JN, Sampson J, Pegg AE, Moschel RC, McLendon RE, Provenzale JM, Stewart ES, Tourt-Uhlig S, Garcia-Turner AM, Herndon JE, Bigner DD, Dolan ME. Phase I trial of carmustine plus O6-benzylguanine for patients with recurrent or progressive malignant glioma. J Clin Oncol. 2000;18:3522–3528. doi: 10.1200/JCO.2000.18.20.3522. [DOI] [PubMed] [Google Scholar]
- 2.Quinn JA, Desjardins A, Weingart J, Brem H, Dolan ME, Delaney SM, Vredenburgh J, Rich J, Friedman AH, Reardon DA, Sampson JH, Pegg AE, Moschel RC, Birch R, McLendon RE, Provenzale JM, Gururangan S, Dancey JE, Maxwell J, Tourt-Uhlig S, Herndon JE, Bigner DD, Friedman HS. Phase I trial of temozolomide plus O6-benzylguanine for patients with recurrent or progressive malignant glioma. J Clin Oncol. 2005;23:7178–7187. doi: 10.1200/JCO.2005.06.502. [DOI] [PubMed] [Google Scholar]
- 3.Quinn JA, Jiang SX, Reardon DA, Desjardins A, Vredenburgh JJ, Rich JN, Gururangan S, Friedman AH, Bigner DD, Sampson JH, McLendon RE, Herndon JE, Walker A, Friedman HS. Phase II trial of temozolomide plus o6-benzylguanine in adults with recurrent, temozolomide-resistant malignant glioma. J Clin Oncol. 2009;27:1262–1267. doi: 10.1200/JCO.2008.18.8417. [DOI] [PMC free article] [PubMed] [Google Scholar]
- 4.Beard BC, Sud R, Keyser KA, Ironside C, Neff T, Gerull S, Trobridge GD, Kiem HP. Long-term polyclonal and multilineage engraftment of methylguanine methyltransferase P140K gene-modified dog hematopoietic cells in primary and secondary recipients. Blood. 2009;113:5094–5103. doi: 10.1182/blood-2008-09-176412. [DOI] [PMC free article] [PubMed] [Google Scholar]
- 5.Beard BC, Trobridge GD, Ironside C, McCune JS, Adair JE, Kiem HP. Efficient and stable MGMT-mediated selection of long-term repopulating stem cells in nonhuman primates. J Clin Invest. 2010;120:2345–2354. doi: 10.1172/JCI40767. [DOI] [PMC free article] [PubMed] [Google Scholar]
- 6.Ragg S, Xu-Welliver M, Bailey J, D’Souza M, Cooper R, Chandra S, Seshadri R, Pegg AE, Williams DA. Direct reversal of DNA damage by mutant methyltransferase protein protects mice against dose-intensified chemotherapy and leads to in vivo selection of hematopoietic stem cells. Cancer Res. 2000;60:5187–5195. [PubMed] [Google Scholar]
- 7.Schambach A, Baum C. Vector design for expression of O6-methylguanine-DNA methyltransferase in hematopoietic cells (Review) DNA Repair. 2007;6:1187–1196. doi: 10.1016/j.dnarep.2007.03.017. [DOI] [PMC free article] [PubMed] [Google Scholar]
- 8.Mortimer JE, Hewlett JS, Bay J, Livingston RB. High dose BCNU with autologous bone marrow rescue in the treatment of recurrent malignant gliomas. J Neurooncol. 1983;1:269–273. doi: 10.1007/BF00165611. [DOI] [PubMed] [Google Scholar]
- 9.Johnson DB, Thompson JM, Corwin JA, Mosley KR, Smith MT, los Reyes RA, Daly MB, Petty AM, Lamaster D, Pierson WP, Ruxer RL, Leff RS, Messerschmidt GL. Prolongation of survival for high-grade malignant gliomas with adjuvant high-dose BCNU and autologous bone marrow transplantation. J Clin Oncol. 1987;5:783–789. doi: 10.1200/JCO.1987.5.5.783. [DOI] [PubMed] [Google Scholar]
- 10.Durando X, Lemaire JJ, Tortochaux J, Van Praagh I, Kwiatkowski F, Vincent C, Bailly C, Verrelle P, Irthum B, Chazal J, Bay JO. High-dose BCNU followed by autologous hematopoietic stem cell transplantation in supratentorial high-grade malignant gliomas: a retrospective analysis of 114 patients. Bone Marrow Transplant. 2003;31:559–564. doi: 10.1038/sj.bmt.1703889. [DOI] [PubMed] [Google Scholar]
- 11.Broniscer A, Gururangan S, MacDonald TJ, Goldman S, Packer RJ, Stewart CF, Wallace D, Danks MK, Friedman HS, Poussaint TY, Kun LE, Boyett JM, Gajjar A. Phase I trial of single-dose temozolomide and continuous administration of o6-benzylguanine in children with brain tumors: a pediatric brain tumor consortium report. Clin Cancer Res. 2007;13:6712–6718. doi: 10.1158/1078-0432.CCR-07-1016. [DOI] [PubMed] [Google Scholar]
- 12.Cartier N, Hacein-Bey-Abina S, Bartholomae CC, Veres G, Schmidt M, Kutschera I, Vidaud M, Abel U, Dal Cortivo L, Caccavelli L, Mahlaoui N, Kiermer V, Mittelstaedt D, Bellesme C, Lahlou N, Lefrere F, Blanche S, Audit M, Payen E, Leboulch P, l’Homme B, Bougneres P, von Kalle C, Fischer A, Cavazzana-Calvo M, Aubourg P. Hematopoietic stem cell gene therapy with a lentiviral vector in X-linked adrenoleukodystrophy. Science. 2009;326:818–823. doi: 10.1126/science.1171242. [DOI] [PubMed] [Google Scholar]
- 13.Berry CC, Gillett NA, Melamed A, Gormley N, Bangham CR, Bushman F. Estimating abundances of retroviral insertion sites form DNA fragment length data. Bioinformatics. doi: 10.1093/bioinformatics/bts004. prepublished online January 11, 2012. [DOI] [PMC free article] [PubMed] [Google Scholar]
- 14.Ott MG, Schmidt M, Schwarzwaelder K, Stein S, Siler U, Koehl U, Glimm H, Kuhlcke K, Schilz A, Kunkel H, Naundorf S, Brinkmann A, Deichmann A, Fischer M, Ball C, Pilz I, Dunbar C, Du Y, Jenkins NA, Copeland NG, Luthi U, Hassan M, Thrasher AJ, Hoelzer D, von Kalle C, Seger R, Grez M. Correction of X-linked chronic granulomatous disease by gene therapy, augmented by insertional activation of MDS1-EVI1, PRDM16 or SETBP1. Nat Med. 2006;12:401–409. doi: 10.1038/nm1393. [DOI] [PubMed] [Google Scholar]
- 15.Cavazzana-Calvo M, Payen E, Negre O, Wang G, Hehir K, Fusil F, Down J, Denaro M, Brady T, Westerman K, Cavallesco R, Gillet-Legrand B, Caccavelli L, Sgarra R, Maouche-Chretien L, Bernaudin F, Girot R, Dorazio R, Mulder GJ, Polack A, Bank A, Soulier J, Larghero J, Kabbara N, Dalle B, Gourmel B, Socie G, Chretien S, Cartier N, Aubourg P, Fischer A, Cornetta K, Galacteros F, Beuzard Y, Gluckman E, Bushman F, Hacein-Bey-Abina S, Leboulch P. Transfusion independence and HMGA2 activation after gene therapy of human -thalassaemia. Nature. 2010;467:318–322. doi: 10.1038/nature09328. [DOI] [PMC free article] [PubMed] [Google Scholar]
- 16.Boztug K, Schmidt M, Schwarzer A, Banerjee PP, Avedillo I, Dewey RA, Böhm M, Nowrouzi A, Ball CR, Glimm H, Naundorf S, Kühlcke K, Blasczyk R, Kondratenko I, Maródi L, Orange JS, von Kalle C, Klein C. Stem-cell gene therapy for the Wiskott-Aldrich syndrome. N Engl J Med. 2010;363:1918–1927. doi: 10.1056/NEJMoa1003548. [DOI] [PMC free article] [PubMed] [Google Scholar]
- 17.Hacein-Bey-Abina S, Garrigue A, Wang GP, Soulier J, Lim A, Morillon E, Clappier E, Caccavelli L, Delabesse E, Beldjord K, Asnafi V, Macintyre E, Dal Cortivo L, Radford I, Brousse N, Sigaux F, Moshous D, Hauer J, Borkhardt A, Belohradsky BH, Wintergerst U, Velez MC, Leiva L, Sorensen R, Wulffraat N, Blanche S, Bushman FD, Fischer A, Cavazzana-Calvo M. Insertional oncogenesis in 4 patients after retrovirus-mediated gene therapy of SCID-X1. J Clin Invest. 2008;118:3132–3142. doi: 10.1172/JCI35700. [DOI] [PMC free article] [PubMed] [Google Scholar]
- 18.Stein S, Ott MG, Schultze-Strasser S, Jauch A, Burwinkel B, Kinner A, Schmidt M, Kramer A, Schwable J, Glimm H, Koehl U, Preiss C, Ball C, Martin H, Gohring G, Schwarzwaelder K, Hofmann WK, Karakaya K, Tchatchou S, Yang R, Reinecke P, Kuhlcke K, Schlegelberger B, Thrasher AJ, Hoelzer D, Seger R, von Kalle C, Grez M. Genomic instability and myelodysplasia with monosomy 7 consequent to EVI1 activation after gene therapy for chronic granulomatous disease. Nat Med. 2010;16:198–204. doi: 10.1038/nm.2088. [DOI] [PubMed] [Google Scholar]
- 19.Avedillo D, Zychlinski ID, Coci EG, Galla M, Modlich U, Dewey RA, Schwarzer A, Maetzig T, Mpofu N, Jaeckel E, Boztug K, Baum C, Klein C, Schambach A. Development of novel efficient SIN vectors with improved safety features for Wiskott-Aldrich syndrome stem cell based gene therapy. Molecular Pharmaceutics. 2011;8:1525–1537. doi: 10.1021/mp200132u. [DOI] [PubMed] [Google Scholar]
- 20.Gerson SL, Miller K, Berger NA. O6 alkylguanine-DNA alkyltransferase activity in human myeloid cells. J Clin Invest. 1985;76:2106–2114. doi: 10.1172/JCI112215. [DOI] [PMC free article] [PubMed] [Google Scholar]
- 21.Gerson SL, Phillips W, Kastan M, Dumenco LL, Donovan C. Human CD34+ hematopoietic progenitors have low, cytokine-unresponsive O6-alkylguanine-DNA alkyltransferase and are sensitive to O6-benzylguanine plus BCNU. Blood. 1996;88:1649–1655. [PubMed] [Google Scholar]
- 22.Stupp R, Hegi ME, Mason WP, van den Bent MJ, Taphoorn MJ, Janzer RC, Ludwin SK, Allgeier A, Fisher B, Belanger K, Hau P, Brandes AA, Gijtenbeek J, Marosi C, Vecht CJ, Mokhtari K, Wesseling P, Villa S, Eisenhauer E, Gorlia T, Weller M, Lacombe D, Cairncross JG, Mirimanoff RO. Effects of radiotherapy with concomitant and adjuvant temozolomide versus radiotherapy alone on survival in glioblastoma in a randomised phase III study: 5-year analysis of the EORTC-NCIC trial. Lancet Oncol. 2009;10:459–466. doi: 10.1016/S1470-2045(09)70025-7. [DOI] [PubMed] [Google Scholar]
- 23.Phillips GL, Wolff SN, Fay JW, Herzig RH, Lazarus HM, Schold C, Herzig GP. Intensive 1,3-bis (2-chloroethyl)-1-nitrosourea (BCNU) monochemotherapy and autologous marrow transplantation for malignant glioma. J Clin Oncol. 1986;4:639–645. doi: 10.1200/JCO.1986.4.5.639. [DOI] [PubMed] [Google Scholar]
- 24.Hirose Y, Kreklau EL, Erickson LC, Berger MS, Pieper RO. Delayed repletion of O6-methylguanine-DNA methyltransferase resulting in failure to protect the human glioblastoma cell line SF767 from temozolomide-induced cytotoxicity. Journal of Neurosurgery. 2003;98:591–598. doi: 10.3171/jns.2003.98.3.0591. [DOI] [PubMed] [Google Scholar]
- 25.Sure D, Dunn I, Norden A, Anderson WS. Intracerebral hemorrhage secondary to thrombocytopenia in a patient treated with temozolomide. Clinical Neurology and Neurosurgery. 2010;112:741–742. doi: 10.1016/j.clineuro.2010.04.005. [DOI] [PubMed] [Google Scholar]
- 26.Nagane M, Nozue K, Shimizu S, Waha A, Miyazaki H, Kurita H, Homori M, Fujioka Y, Shiokawa Y. Prolonged and severe thrombocytopenia with pancytopenia induced by radiation-combined temozolomide therapy in a patient with newly diagnosed glioblastoma--analysis of O6-methylguanine-DNA methyltransferase status. J Neurooncol. 2009;92:227–232. doi: 10.1007/s11060-008-9754-7. [DOI] [PubMed] [Google Scholar]
- 27.Gerber DE, Grossman SA, Zeltzman M, Parisi MA, Kleinberg L. The impact of thrombocytopenia from temozolomide and radiation in newly diagnosed adults with high-grade gliomas. Neuro-oncol. 2007;9:47–52. doi: 10.1215/15228517-2006-024. [DOI] [PMC free article] [PubMed] [Google Scholar]
- 28.Hacein-Bey-Abina S, von Kalle C, Schmidt M, Le Deist F, Wulffraat N, McIntyre E, Radford I, Villeval JL, Fraser CC, Cavazzana-Calvo M, Fischer A. A serious adverse event after successful gene therapy for X-linked severe combined immunodeficiency. N Engl J Med. 2003;348:255–256. doi: 10.1056/NEJM200301163480314. [DOI] [PubMed] [Google Scholar]
- 29.Cleynen I, Van de Ven WJ. The HMGA proteins: a myriad of functions (Review) International Journal of Oncology. 2008;32:289–305. [PubMed] [Google Scholar]
- 30.Godley LA. HMGA2 levels in CML: reflective of miRNA gene regulation in a hematopoietic tumor? Leuk Lymphoma. 2007;48:1898–1899. doi: 10.1080/10428190701644348. [DOI] [PubMed] [Google Scholar]
- 31.Meyer B, Krisponeit D, Junghanss C, Murua EH, Bullerdiek J. Quantitative expression analysis in peripheral blood of patients with chronic myeloid leukaemia: correlation between HMGA2 expression and white blood cell count. Leuk Lymphoma. 2007;48:2008–2013. doi: 10.1080/10428190701559116. [DOI] [PubMed] [Google Scholar]
- 32.Wang GP, Berry CC, Malani N, Leboulch P, Fischer A, Hacein-Bey-Abina S, Cavazzana-Calvo M, Bushman FD. Dynamics of gene-modified progenitor cells analyzed by tracking retroviral integration sites in a human SCID-X1 gene therapy trial. Blood. 2010;115:4356–4366. doi: 10.1182/blood-2009-12-257352. [DOI] [PMC free article] [PubMed] [Google Scholar]
- 33.Hegi ME, Sciuscio D, Murat A, Levivier M, Stupp R. Epigenetic deregulation of DNA repair and its potential for therapy (Review) Clin Cancer Res. 2009;15:5026–5031. doi: 10.1158/1078-0432.CCR-08-1169. [DOI] [PubMed] [Google Scholar]
- 34.Vlassenbroeck I, Califice S, Diserens AC, Migliavacca E, Straub J, Di S, Moreau IF, Hamou MF, Renard I, Delorenzi M, Flamion B, DiGuiseppi J, Bierau K, Hegi ME. Validation of real-time methylation-specific PCR to determine O6-methylguanine-DNA methyltransferase gene promoter methylation in glioma. Journal of Molecular Diagnostics. 2008;10:332–337. doi: 10.2353/jmoldx.2008.070169. [DOI] [PMC free article] [PubMed] [Google Scholar]
- 35.Beard BC, Mezquita P, Morris JC, Kiem HP. Efficient transduction and engraftment of G-CSF-mobilized peripheral blood CD34+ cells in nonhuman primates using GALV-psuedotyped gammaretroviral vectors. Molecular Therapy. 2006;14:212–217. doi: 10.1016/j.ymthe.2006.01.016. [DOI] [PubMed] [Google Scholar]
- 36.Yoshino A, Ogino A, Yachi K, Ohta T, Fukushima T, Watanabe T, Katayama Y, Okamoto Y, Naruse N, Sano E, Tsumoto K. Gene expression profiling predicts response to temozolomide in malignant gliomas. International Journal of Oncology. 2010;36:1367–1377. doi: 10.3892/ijo_00000621. [DOI] [PubMed] [Google Scholar]
- 37.Southern EM. Detection of specific sequences among DNA fragments separated by gel electrophoresis. J Mol Biol. 1975;98:503–517. doi: 10.1016/s0022-2836(75)80083-0. [DOI] [PubMed] [Google Scholar]
- 38.Kent WJ. BLAT--the BLAST-like alignment tool. Genome Res. 2002;12:656–664. doi: 10.1101/gr.229202. [DOI] [PMC free article] [PubMed] [Google Scholar]
- 39.Karolchik D, Baertsch R, Diekhans M, Furey TS, Hinrichs A, Lu YT, Roskin KM, Schwartz M, Sugnet CW, Thomas DJ, Weber RJ, Haussler D, Kent WJ University of California Santa Cruz. The UCSC Genome Browser Database. Nucleic Acids Res. 2003;31:51–54. doi: 10.1093/nar/gkg129. [DOI] [PMC free article] [PubMed] [Google Scholar]
- 40.Trobridge GD, Miller DG, Jacobs MA, Allen JM, Kiem HP, Kaul R, Russell DW. Foamy virus vector integration sites in normal human cells. PNAS. 2006;103:1498–1503. doi: 10.1073/pnas.0510046103. [DOI] [PMC free article] [PubMed] [Google Scholar]
Associated Data
This section collects any data citations, data availability statements, or supplementary materials included in this article.
Supplementary Materials
Table S1. Individual Patient Data
Table S2. Pharmacokinetics of TMZ
Table S3. Unique RIS in GBM Patients
Table S4. CIS in GBM Patients
Table S5. Over-represented Gene Classes Near RIS
Fig. S1 Efficient transduction of CD34+ hematopoietic cells with a P140K-expressing PhGALV-pseudotyped gammaretrovirus
Fig. S2. RIS distribution at the PRDM16 and HMGA2 loci
Fig. S3. Shear site analyses of dominant clones
Fig. S4. Clonal tracking by PCR in mature WBC lineages