Abstract
The ability to increase the concentration of target analytes in a fixed sample volume can potentially lower the limit of detection for many biosensing techniques, and thus is key in sample preparation for infectious disease diagnosis. Concentration by evaporation is an effective method to achieve target enrichment. However, concentrating human samples, including blood and plasma, by evaporation-based methods is made challenging by high concentrations of proteins and electrolytes. Dehydration of the proteins causes the sample to turn into a gel, hindering further analysis. At the same time, decreasing the volume increases the overall concentration of electrolytes, causing bacterial or viral particle lysis, and making them more difficult to detect in affinity-based biosensors. Thus, we fabricated a microfluidic chip that incorporates both dialysis and concentration in a single design. The chip dialyzes the proteins from the plasma, while maintaining an appropriate concentration of electrolytes and concentrating the sample targets. The process to concentrate plasma or serum samples by a factor of 10 takes less than 30 minutes.
As a proof-of-concept, we demonstrated the chip using a defective Human Immunodeficiency Virus (HIV). To distinguish patients on antiretroviral therapy who are failing therapy from those who are not, a diagnostic must be able to detect HIV in plasma down to at least 1000 particles per milliliter. For a number of technical reasons, it is difficult to get on-chip PCR reactions to reach this level of sensitivity, so concentration of HIV from lower viral load samples has the potential to improve the sensitivity of many types of molecular point-of-care viral load tests.
I. INTRODUCTION
Sample preparation is a crucial step in biological sample analysis, irrespective of the chosen analysis method. This process usually involves multiple steps, and can include cell culture, concentration, purification, nucleic acids extraction, etc. In this paper, we will focus on sample concentration and purification for point-of-care diagnostics of infectious diseases. We define sample concentration as the actual increase in target concentration in a fixed sample volume. Recently, many techniques have been demonstrated to increase and purify the number of analytes in clinical samples, including:dielectrophoresis, column chromatography, magnetic bead-based separation, continuous flow deterministic arrays, and porous filter membranes [1,2]. The advantages of these methods include the ability to work with whole blood (porous filter membrane) and a good resolution (column chromatography, magnetic beads-based separation). Potential limitations of these methods include relatively high cost; incompatibility with many types of biosensors, because of carrying fluid salt concentrations; low throughput; the requirement for complicated procedures, resources and trained personnel; and, most importantly, the requirement to work with diluted samples. To overcome some of these issues, we previously developed a concentration chip based on evaporation. The chip is capable of concentrating sample analytes up to a factor of 10 in less than 30 minutes, and it can be assembled and operated using only very simple pumps and/or vacuum. The original design was tested using bacteria samples diluted in phosphate buffered saline (PBS) [3]. Human blood plasma samples could only be concentrated in this device by a factor of 3, after which the sample became gel-like due to the increase in plasma protein concentration. Moreover, the sample electrolytes became significantly elevated in the concentrated volume, lysing whole virus particles and making it impossible to detect them by using affinity-based biosensors. Therefore, we modified the chip to incorporate a dialysis process in parallel with the concentration process to purify and concentrate the sample at the same time, while maintaining physiological electrolyte concentrations. The new design increases the overall concentration factor to 10 and keeps the virus particles intact and available for detection by affinity-based biosensors. This chip will provide a simple, inexpensive, robust, and rapid way to enrich the sample for diagnostics at the point of care, with potential applications in low-resource settings. Further, it can be incorporated with downstream biosensors to form a complete detection platform in which the input sample will be plasma.
Here we describe the fabrication of the dialysis/concentration chips and their performance using human plasma sample spiked with defective HIV at different concentrations. The motivation for choosing HIV is the need to measure the viral load of HIV patients having less than 1000 copies/ml. The standard-of-care HIV viral load tests are all PCR based and require a fully laboratory and trained technicians to perform. Many field based viral load tests are in development [4], and would all likely benefit from a fast upstream viral concentration module. There are several instances in which a fast viral load test would be clinically beneficial. For example, in perinatal cases, when HIV viral load is above 1000 copies/ml, mothers are advised to have a cesarean section to lower the chance of HIV transmission to the child [5]. Viral load also helps to determine whether HIV patients are responding to antiretroviral therapies; here the clinically-relevant threshold viral load is 200 copies/ml, after 4–8 weeks of treatment [6]. However, sensitivity is often an issue with the current tests for viral load in both HIV, especially for viral loads less than 200 copies/ml (HIV [6]). These tests are also expensive up to $160 in the US [7] and in developing countries, a single test can cost $40–100 [8], making patients reluctant to adhere to a regular testing regimen. In addition, current tests take 4–6 hours, or, for developing countries, as many as a few days, due to limited resources and lack of trained personnel. The high cost and long turnaround time of these tests are due to multiple processes (reverse transcription PCR and DNA hybridization). Less expensive tests exist, but are not sensitive enough for many clinical situations. Thus, our simple, cost effective sample concentration chip could increase their sensitivity while reducing expense and time to result.
II. EXPERIMENTAL METHODS
A. Device design and fabrication
Dialysis-only on a chip
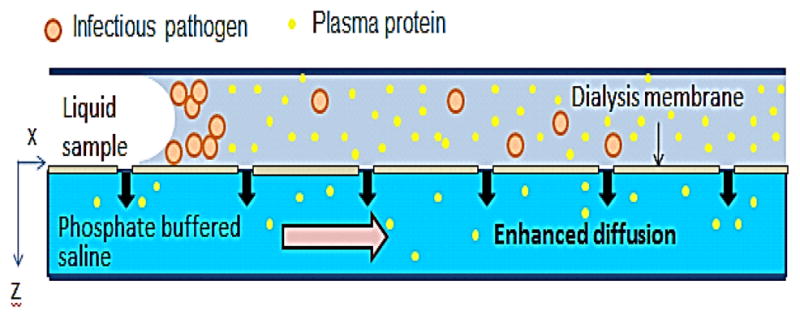
The chip was made from TempPlate RT select optically clear film (TCF) (2921–7800, USA Scientific, Ocala, FL), patterned using a cutter plotter (Graphtec America, Irvine, CA), then glued to a hydrophilic polycarbonate membrane (PCT0059030, Sterlitech, Kent, WA) for dialysis using superglue. The channel was sealed off with an SAF layer with through holes for the inlet and outlet. Fig. 1 shows how all the layers were assembled in the experiment (side view).
Figure 1.

A cross section of the dialysis device.
Dialysis and concentration on a chip
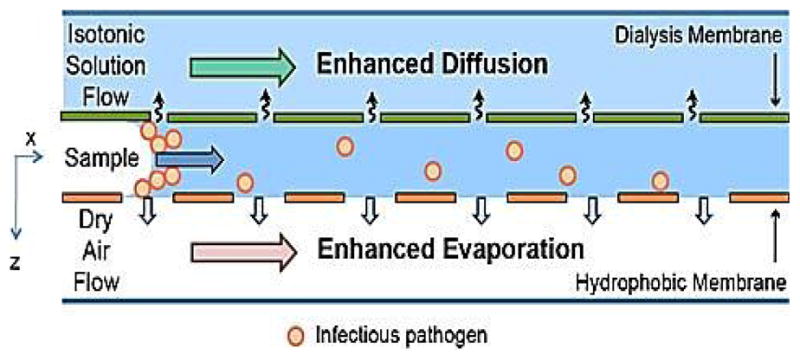
The chip for simultaneous dialysis and concentration comprised three parts: the microchannel and two membranes, one for evaporation and one for dialysis. The channel is made from TCF as for the dialysis-only device. One side of the channel is glued to a polycarbonate membrane with 50 nm diameter pores to enhance diffusion through dialysis; the other side of the channel is adhered to a hydrophobic polypropylene membrane (PP0114225, Sterlitech, Kent, WA) with 100 nm diameter pores to enhance evaporation. Fig. 2 shows a side view of the device. In this chip design, dialysis and concentration processes are run in parallel and take a total of 30 minutes to complete.
Figure 2.

A cross section of the dialysis-concentration hybrid chip.
B. Virus preparation and handling
Human plasma was spiked with defective HIV-1 subtype B (Seracare Life Sciences, Milford, MA). Human plasma is prepared by spinning whole blood at 900 rpm for 15 minutes at 4C and stored at the same temperature. The viral stock solution was 108 copies/ml and was stored at −80C. The experimental sample was prepared by serially diluting the stock solution to the desired concentration (60000 and 7,000 copies/ml) in plasma.
C. Experiments with dialysis/concentration
On-chip Dialysis
To characterize the dialysis-only device, we used human plasma spiked with fluorescent polystyrene beads, 100nm in diameter (Invitrogen, Eugene, OR). The membrane side of the chip was exposed to 1X PBS that was freshly prepared for each experiment from NaCl, KCl, Na2HPO4, and KH2O4 (Sigma, St. Louis, MO). We characterized the chip at different flow rates of dialysate (10 ml/min, 20 ml/min, and 30 ml/min) and durations of dialysis (10 minutes, 20 minutes, and 30 minutes) to find the optimal conditions. The plasma protein concentration and the recovery percentage of fluorescent beads were measured by Nanodrop 2000c (ThermoScientific, Wilmington, DE). The chip was also tested with influenza A viral particles to measure the loss of the virus particles to the membrane.
On-chip Dialysis and Concentration
The overall efficiency of the combined dialysis/concentration microfluidic chip was tested with defective HIV-1 plasma samples; we defined recovery efficiency as the ratio of viruses concentrated from the initial volume (700 μl) to the final volume (100 μl). The experiments were conducted in a Biosafety level 2 facility. The chips were operated in a fixture that consists of one chamber for dialysis process and another chamber for evaporation. Each chamber had both inlets and outlets to allow the flow of air and dialysate. For dialysis, the dialysate was 1X PBS, circulated below the polycarbonate membrane side of the chip using a peristaltic pump at a flow rate of 40 ml/min. For evaporation, a vacuum pump was connected to the inlet of the evaporation chamber to create airflow on top of the polypropylene membrane at the pressure 30 in Hg. The two processes ran in parallel, reducing the duration of experiment to 20 minutes.
A. Recovery efficiency analysis
The concentrated samples were collected from the chips using a pipette, and then viral RNA was extracted immediately using a QIAamp Viral RNA Mini kit (Qiagen, Valencia, CA). The control and serially diluted samples were extracted using the same kit to ensure consistency between experiments.
The viral RNA samples were quantified using Agilent Brilliant II QRT-PCR 1- step Core kit (Agilent Technologies, Santa Clara, CA). The samples are quantified using Applied Biosystems 7500 Real Time PCR system (Applied Biosystems, Foster, CA). The following sets of forward and reverse primers (Integrated DNA Technologies, Coralville, IA) were used:
G98 oligo:
5′-ATGCGAACCCAGATTGTAAGAC-3′
G25 oligo:
5′ GCTCATTGCTTCAGCCAAAACTCTTGC- 3′
These primers amplify the gag gene target in HIV. The total volume for each reaction well was 25 μl. The sample was run for 1 hour at 42°C for the reverse transcription (RT) followed by PCR for 45 cycles. Each sample had three replicates with RT reagents and two replicates without the RT reagents (-RT controls). The standards were made by serial dilution of the stock solution (108 copies/ml) to 107, 106, 105, 104, and 103 copies/ml.
III. RESULTS
B. Dialysis on a chip
First, we characterized the dialysis-only device at different flow rates of dialysate and durations of dialysis, to find the optimal dialysis conditions.
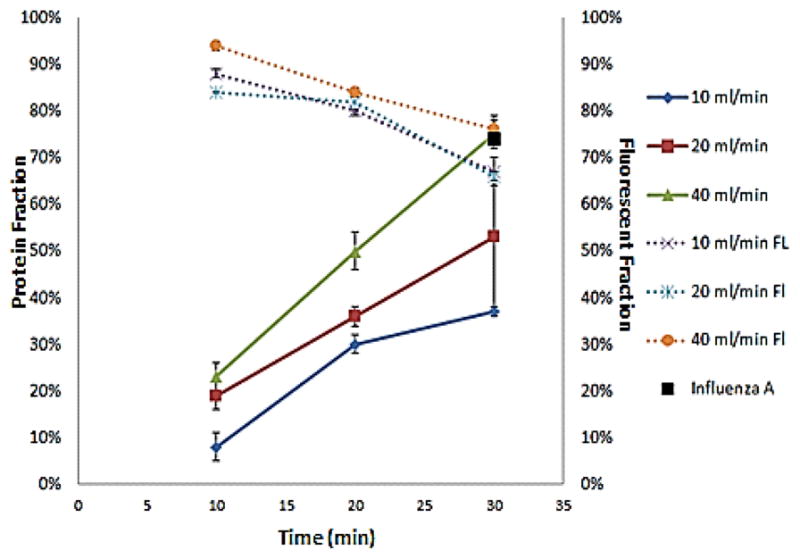
Figure 3 shows that as the flow rate increases the percentage of protein extracted increases. Similarly, when the duration of dialysis process increases, the percentage of protein extracted increases. On the other hand, the recovery percentage of fluorescent beads decreases as the duration of the experiment increases. The flow rate does not affect the percentage of recovery. The overall mass transfer rate of plasma proteins through the membrane is 2.5–6.3 μg/s experimentally. The error bar for each condition is in the range of 1–3%, except for the condition 20ml/min for 30 minutes, where a larger variation was observed. The experiment with influenza A was carried out to quantify the loss of virus particles to the membrane after 30 minutes at the flow rate of the dialysate 40 ml/min. We measured a 73% recovery, which is similar to the recovery of the fluorescent beads for the same conditions (Fig. 3).
Figure 3.

The graph shows the percentage of protein extracted from the sample (left y-axis) and the recovery percentage of fluorescent beads (right y-axis) as a function of the duration of the experiment (10 minutes, 20 minutes, and 30 minutes). Each line represents a different flow rate of the dialysate (10 ml/min, 20 ml/min, and 40 ml/min). The black point represents the experiment with influenza A.
C. Simultaneous on-chip Dialysis and Concentration
The dialysis and concentration processes were incorporated into one device. The combined device was tested with human plasma sample spiked with HIV at different concentrations (~60000 copies/ml and ~7000 copies/ml). The data were analyzed by real time RT-PCR and summarized in Tables I and II. The Volume Concentration Factor (VCF), defined as the initial volume divided by the final volume, ranged from 7–10, see Table I.
TABLE I.
SUMMARY OF VOLUME CONCENTRATION
| Sample Number | Initial Volume | Final Volume | Volume Concentration Factor |
|---|---|---|---|
| 1 | 800 | 100 | 10 |
| 2 | 750 | 100 | 7.5 |
| 3 | 750 | 100 | 7.5 |
TABLE II.
SUMMARY OF RECOVERY AND EFFECTIVE CONCENTRATION FACTORS
| Initial Sample (copies/ml) | Measured Sample | Recovery Percentage | Effective Concentration Factor |
|---|---|---|---|
| 58076 | 427678 | 80 | 8 |
| 58076 | 392015 | 89 | 6.7 |
| 6987 | 38628 | 74 | 5.6 |
The percentage recovery varied from 75–90%, yielding an Effective Concentration Factor (ECF = Recovery × VCF). See Table II.
IV. DISCUSSION
From the results in Tables I and II, we showed that we can effectively concentrate a serum sample and quantify it using a downstream assay (conventional RT-PCR in this case). The blood samples required only one centrifugation before going to the chip. Moreover, the loss of viral particles during concentration was still acceptable (10–25%) for concentration factors greater than 7.
In continuing work, the device must be proven to work for lower initial HIV concentrations (1000 copies/ml). We will also explore enhancing the recovery by reducing loss of virus to the walls by using different surface treatments. Overall, the combined dialysis/concentration microfluidic chip promises a new, rapid, robust, and inexpensive way for sample concentration of undiluted human plasma to improve significantly the limit of detection of PCR on chip. With further development, it can be potentially used in limited-resources regions.
Acknowledgments
This work was supported by the National Institutes of Health under Grant 1RO1AI096159-01 and Center for Nanoscience and Nanotechnology, Boston University.
Contributor Information
Nga T. Ho, Email: nho2311@bu.edu, Boston University, Department of Biomedical Engineering
Andy Fan, Email: fana@bu.edu, Boston University, Department of Biomedical Engineering.
Catherine M. Klapperich, Email: catherin@bu.edu, Boston University, Departments of Mechanical and Biomedical Engineering, phone: 617-358-0253, fax: 617-353-6766
Mario Cabodi, Email: cabodi@bu.edu, Boston University, Department of Biomedical Engineering, phone: 617-358-1793, fax: 617-353-7271.
References
- 1.Pamme N, et al. Continuous flow separations in microfluidic devices. Lab on a chip. 2007;7(11):1644–1659. doi: 10.1039/b712784g. [DOI] [PubMed] [Google Scholar]
- 2.Wei H, et al. Particle sorting using a porous membrane in a microfluidic device. Lab on a chip. 11(10):238–245. doi: 10.1039/c0lc00121j. [DOI] [PubMed] [Google Scholar]
- 3.Zhang JY, et al. Rapid point-of-care concentration of bacteria in a disposable microfluidic device using meniscus dragging effect. Lab on a chip. 2010;10(8):3265–3270. doi: 10.1039/c0lc00051e. [DOI] [PMC free article] [PubMed] [Google Scholar]
- 4.Fiscus SA, et al. HIV-1 Viral Load Assays for Resource-Limited Settings. PLoSMed. 2006;3(10):e417. doi: 10.1371/journal.pmed.0030417. [DOI] [PMC free article] [PubMed] [Google Scholar]
- 5.Cooper ER, et al. Combination antiretroviral strategies for the treatment of pregnant HIV-1-infected women and prevention of perinatal HIV-1 transmission. Journal of Acquired Immune Deficiency Syndromes. 2002;29(5):484–494. doi: 10.1097/00126334-200204150-00009. [DOI] [PubMed] [Google Scholar]
- 6.Plasma HIV RNA Testing. Available from: http://www.aidsinfo.nih.gov/guidelines/html/1/adult-and-adolescent-treatment-guidelines/5/plasma-hiv-rna-testing/
- 7.Calmy A, et al. HIV viral load monitoring in resource-limited regions: Optional or necessary? Clinical Infectious Diseases. 2007;44(1):128–134. doi: 10.1086/510073. [DOI] [PubMed] [Google Scholar]
- 8.Menzies N, et al. The costs and effectiveness of four HIV counseling and testing strategies in Uganda. Aids. 2009;23(3):395–401. doi: 10.1097/QAD.0b013e328321e40b. [DOI] [PubMed] [Google Scholar]


