Abstract
Metabolic imaging of hyperpolarized [1-13C]pyruvate co-polarized with [13C]urea by dynamic nuclear polarization with rapid dissolution is a promising new method for assessing tumor metabolism and perfusion simultaneously in vivo. Novel pulse sequences are required to enable dynamic imaging of multiple 13C spectral lines with high spatiotemporal resolution. The goal of this study was to investigate a new frequency-specific approach for rapid metabolic imaging of multiple 13C resonances using the spectral selectivity of steady state free precession pulse trains. Methods developed in simulations were implemented in a dynamic frequency-cycled balanced SSFP pulse sequence on a 14.1T animal MRI scanner. This acquisition was tested in thermal and hyperpolarized phantom imaging studies, and in a transgenic mouse with prostate cancer.
Introduction
Aperiodic train of RF pulses has a frequency response that is periodic with 1 / TR, resulting in frequency-dependent signal modulation if TR is less than or on the order of T2[1]. Although the spectral selectivity of steady state free precession (SSFP) pulse trains has been variously utilized in 1H imaging applications [2–4], hyperpolarized 13C imaging applications have yet to exploit it. In the prior 13C studies, either a single metabolically inactive agent was imaged (i.e. for angiography or perfusion imaging)[5–8], or a uniform excitation profile was assumed for multiple resonances, requiring reconstruction by Dixon-type multi-echo methods[9]. The characteristic sparse spectra with long T2 relaxation times of hyperpolarized 13C studies suggest use of the SSFP frequency response for rapid spectrally selective imaging of multiple resonances. In this work, we propose a novel frequency-specific approach to hyperpolarized 13C metabolic imaging utilizing SSFP.
Metabolic imaging of [1-13C]pyruvate co-polarized with [13C]urea, enabled by new rapid dissolution methods for dynamic nuclear polarization (DNP)[10], is a promising new method for characterization of tumor metabolism and perfusion simultaneously in vivo [11, 12]. Several previous clinical studies with other imaging modalities have shown that a perfusion-metabolism mismatch is associated with adverse disease features in certain human cancers[13–15]. To investigate the significance of the perfusion-metabolism mismatch using hyperpolarized 13C agents, novel pulse sequences are required to enable metabolic imaging with high spatiotemporal resolution. The goal of this study was to demonstrate the feasibility of using frequency specific SSFP for dynamic imaging of co-polarized [1-13C]pyruvate and[13C]urea in vivo.
Methods
Theory and Simulations
The transient frequency response of hyperpolarized magnetization to a series of RF pulses was modeled and computed in simulation. The hyperpolarized case differs from the thermal case in that no traditional steady state is reached. T1 recovery was eliminated, and decaying T1 and T2 relaxation processes were also ignored, assuming a relatively short pulse train. Under these assumptions along with the small flip angle or Fourier approximation[16], the transverse magnetization formed in response to a transverse RF magnetic field B1(t) is
where Δω is the offset from transmit frequency, M0 is the initial longitudinal magnetization, and γ is the gyromagnetic ratio. Then for a periodic pulse train with spacing TR, the transverse magnetization after n pulses is
where α is the flip angle of each individual pulse.
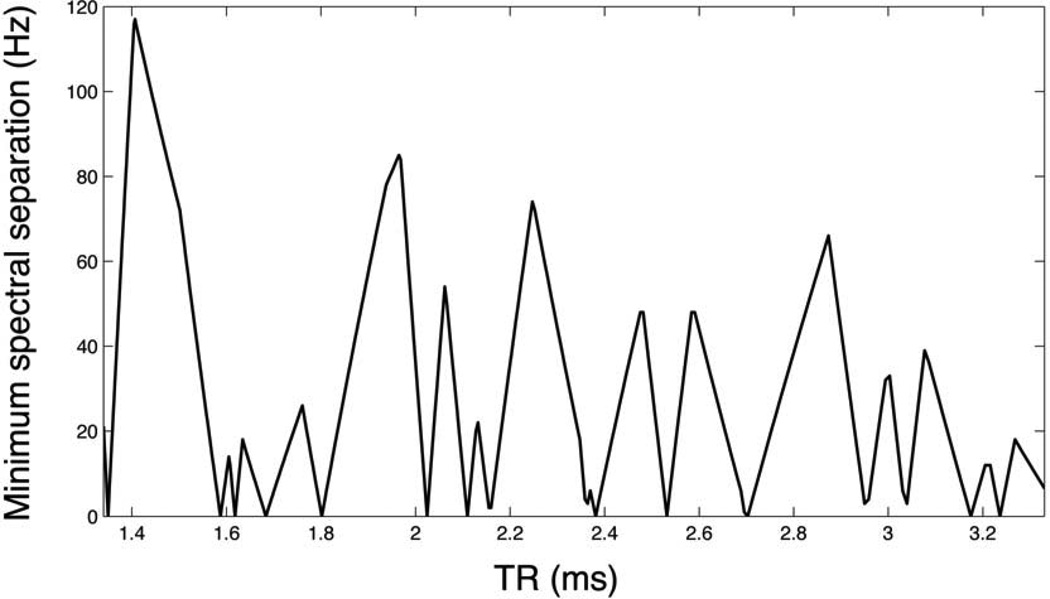
Magnetization was evolved over 36 pulses with α= 0.5–2.0° and allowable TR’s= 1.44ms and 2.23ms, over a frequency range of ±75Hz (±0.5ppm at 14.1T). The minimum possible TR on the scanner for a resolution of 2.5mm was 1.34ms, which is desirable for greatest bandwidth of response. However, it was necessary to increase the TR to these allowable values for two reasons: 1) to improve the SNR efficiency by increasing the readout time, and 2) to maximally avoid excitation of any other peak near integer multiples of 1 / TR from any deliberately excited spectral peak, due to periodicity of the spectral response. The approximate Larmor frequencies for pyruvate hydrate, lactate, and urea relative to pyruvate at 14.1T are approximately +1260Hz, +1854Hz, and -1107Hz, respectively. When considering imaging of pyruvate, lactate, and urea, a set of optimal TR’s can be derived based on these chemical shifts for which avoidance of periodic spectral overlaps (including onto pyruvate hydrate) is maximized. The minimum avoidance between each imaged metabolite’s spectral response and any other peak was computed and plotted for a range of TR=1.34–3.33ms, and shown in Figure 1. Allowable TR’s of 1.44ms (minimum avoidance ~100Hz) and 2.23ms (minimum avoidance ~70Hz) were selected as two maxima taken from this analysis.
Figure 1.
Determination of allowable TR’s for SSFP metabolic imaging of [1-13C] pyruvate. Plot shows the minimum avoidance of overlap between any deliberately excited spectral peak’s spectral response (among pyruvate, lactate, and urea) and any other significant present peak (pyruvate, pyruvate hydrate, lactate, and urea), as a function of TR.
To improve the bandwidth of the response, the addition of a pair of adjacent frequency-specific SSFP acquisitions on either side of the center frequency was also simulated, with weighted complex combination of the resulting individual images, based on their known frequency profiles. Magnitude combination could be used, but phasing of these images before summation compensates for the differential phase of a given isochromat on the individual component images due to varying offsets from the respective center frequencies, and therefore improves the composite profile. A constant phase correction factor was applied based on differential phase at the center lineof k-space, given by
where Ndummy is the number of dummy cycles, Ny is the number of phase encodes, and Δω is the frequency offset of the component acquisition.
Potential blurring effects along the phase direction due to the slow signal variation over the imaging pulses were estimated by computing the on-resonance point spread function (PSF). The PSF is approximately the Fourier transform of a linear filter across k-space, or
where Δx is the nominal spatial resolution, W is the sampled k-space width, m is the slope of the k-space filter, and b is its value at kmin.
Hyperpolarization procedures
For the hyperpolarized phantom experiment, 15mg 99% [1-13C]pyruvic acid (neat) and 30mg 99% [13C]urea(6.4M in glycerol), both mixed with trityl radical (Oxford Instruments, Oxford, UK) and 1.0–1.5mM Dotarem (Guerbet, Roissy, France), were loaded into the Hypersense DNP polarizer (Oxford Instruments Biotools, Oxford, UK). The mixtures were individually dispensed into the sample cup and frozen into well-separated layers before loading into the polarizer, by immersion in a liquid nitrogen bath. Inside the polarizer, the sample was placed in a magnetic field of 3.35T, cooled to 1.3K, and irradiated for ~1hr at 94.089GHz, and finally dissolved in a 4.5mL heated buffer solution. The resulting solution (room temperature, pH ~7.3) was approximately equimolar for pyruvate and urea (40mM). The solution was transferred to a NMR tube (i.d.= 10mm) and placed in the scanner. For the in vivo study, the amounts were doubled to produce 80mM solutions. The mouse was injected with 350µL of the co-polarized solution (room temperature, pH ~7.3) over 12 seconds, followed by a short saline flush. Scanning was initiated at the end of injection, beginning with the automated frequency setting procedure described below, followed by dynamic imaging.
MRI Experiments
The frequency-specific SSFP pulse sequence was implemented on a 14.1T Varian 600WB micro imaging system (Agilent Technologies, Santa Clara, California, USA), equipped with 55mm 100G/cm gradients and insert volume RF coils for 1H and 13C (L= 4 cm, D= 4 cm for both) supplied by the manufacturer. A product 2D balanced SSFP (‘true SSFP’) pulse sequence was modified to run dynamically and to cycle among center frequencies for pyruvate, lactate, and urea at each dynamic time point.
Two phantom experiments were conducted for sequence testing. First, two small syringe phantoms (i.d.= 3mm) containing enriched [13C]urea(8M) and [1-13C]lactate (5.5M), respectively, were scanned. Second, a co-polarized solution of pyruvate and urea (equimolar, 40mM) was transferred to a NMR tube(i.d.= 9mm) and scanned dynamically every 3 seconds over 87 seconds (30 timepoints). Both phantom scan parameters were: TE / TR = 0.72ms / 1.44ms, α= 0.6°, matrix= 24 × 24, FOV= 6cm, spatial resolution= 2.5mm × 2.5mm, slice thickness= 10mm, BWread= 208.0 kHz, dummy cycles= 12, RF pulse= 100µs Gaussian, scan duration= 52ms per frequency.
A transgenic mouse with prostate cancer (transgenic adenocarcinoma of mouse prostate, or TRAMP[17]) bearing a large prostatic tumor mass (gross tumor dmax= 2.5cm) was also scanned after jugular injection of co-polarized pyruvate and urea. The parameters for dynamic in vivo hyperpolarized imaging wereas follows: TE / TR = 1.12ms / 2.23ms, α= 1.5°, matrix= 16 × 16, FOV= 4cm, spatial resolution= 2.5mm × 2.5mm, slice thickness= 10mm, BWread = 28.4kHz, dummy cycles= 4, RF pulse= 100µs Gaussian, scan duration= 45ms per frequency. For each in vivo metabolite, the center frequency and two adjacent frequencies at ±25Hz were scanned, and the images were combined using weighted complex combination. For the hyperpolarized studies, the pyruvate center frequency was determined and set automatically by homebuilt scanner software, based on the position of the hyperpolarized pyruvate peak in a spectrum from the imaged slice (α= 1°), acquired just prior to imaging. Center frequencies for urea and lactate were then also set with fixed offsets from this frequency. A delay of 100ms was programmed between frequencies, for spoiling. B0 and 13C Larmor frequency offset maps were generated over a 4×4×4cm3 region (128×128×64) around the mouse prostate, based on two gradient echo 1H acquisitions (ΔTE= 1ms) after high order shimming. A T2-weighted anatomic axial 1H image series covering the entire mouse was also acquired, for overlay of the dynamic hyperpolarized images using NIH ImageJ[18]. Animal studies were conducted in accordance with a protocol approved by the Institutional Animal Care and Use Committee (IACUC).
Results
Simulations and Pulse Sequence Design
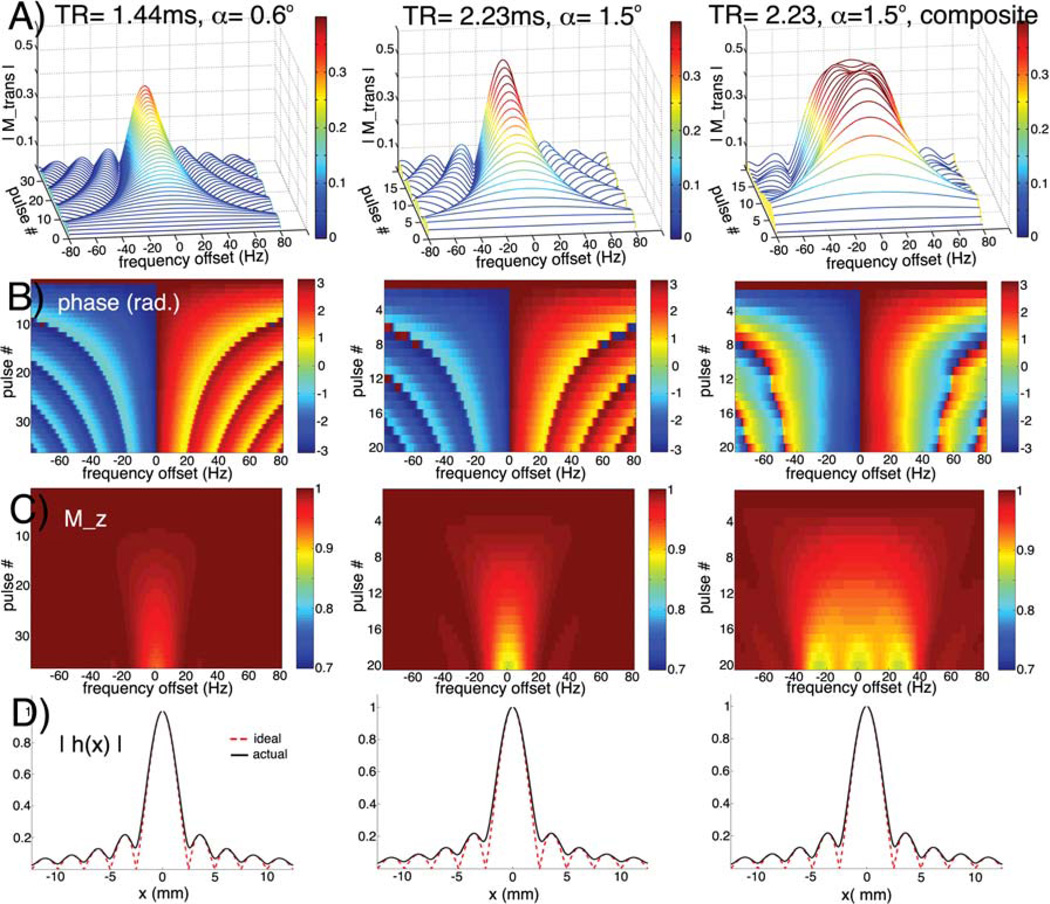
The transient SSFP frequency response for hyperpolarized spins in the limit of low flip angle has narrow bands of increasing signal spaced by 1 / TR. Outside of these bands, the pulses have little effect on the magnetization. Signal stability over the imaging pulses is improved by using a greater number of dummy cycles, but is traded against narrowing bandwidth of the in-band response with a longer pulse train. Two frequency-specific SSFP acquisitions were designed as described above in the Methods section for the phantom and in vivo experiments respectively. As described above, both of the selected TR’s avoided overlapping resonances at integer multiples of 1 / TR away from each center frequency.
For the phantom studies, the response bandwidth of a single acquisition per resonance was sufficient, due to good shimming conditions. For the phantom parameters, the pass band FWHM width of the frequency response was ~0.2ppm (Figure 2, column 1), which is tolerable given that the slice center frequency was determined and set automatically by our software, as described earlier, accounting for global B0 shifts. Avery low flip angle of 0.6° was used, since SNR was not an issue at full concentration, and to minimize expenditure of the hyperpolarized magnetization so that the data reflected nearly pure T1 decay. The minimum TR with maximum readout gradient was used.
Figure 2.
Small flip angle SSFP response of hyperpolarized magnetization near resonance, for phantom (column 1) and in vivo (columns 2&3) scan parameters described in text. Transverse magnitude (row A) and phase (B) of hyperpolarized magnetization during pulse train, and remaining longitudinal component (C).On-resonance PSF along phase direction due to signal variation during pulse train (solid black line), as compared to ideal PSF (dotted red line) (D).Column 3 shows the broadened composite frequency profile obtained by complex weighted combination of three acquisitions at different center frequencies (0 Hz, −25 Hz, 25 Hz).
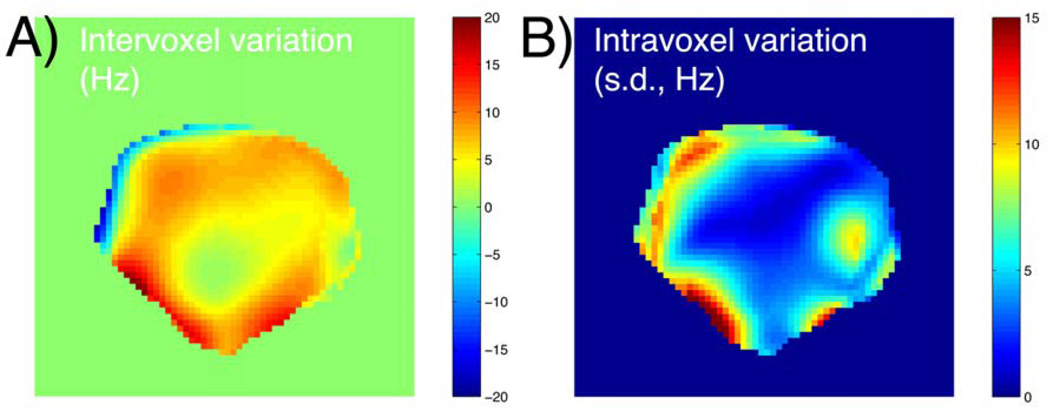
The parameters for the in vivo studies were adjusted to increase sensitivity at lower concentrations of hyperpolarized material due to dilution in the animal. The flip angle was increased to 1.5°. Considering the reduced number of pulses in the in vivo protocol (16 phase encodes versus 24, with 4 dummy cycles instead of 12), this was only expected to raise the total flip angle and the SNR by about 25%. To increase the SNR efficiency, the readout time was increased by reducing the gradient strength, and the other allowable TR of 2.23ms was used. Even at the lower value, the readout gradient strength was more than sufficient to prevent artifacts (~12 ppm/voxel). To preserve a similar overall train length, the matrix size was reduced to 16, although the FOV was cut to maintain the spatial resolution. The net effect, including the changes to both the excitation and the readout, was estimated to produce about 2.2-fold overall SNR enhancement. The spectral response for this acquisition is shown in Figure 2, column 2. To improve the frequency profile under poorer shimming conditions, a composite profile (Figure 2, column 3) was synthesized by the weighted complex combination of three image acquisitions per frequency (at 0Hz and ±25Hz). The optimal frequency offset of 25Hz was equal to the FWHM of the individual response. The acquired B0 maps showed that the composite profile (FWHM width ~0.4ppm) was well suited for typical shimming conditions, as Larmor frequency offsets did not exceed ±20 Hz in vivo (Figure 3).
Figure 3.
In vivo shimming conditions for prostatic region of TRAMP mouse, derived from high resolution B0 maps. Mean 13C Larmor frequency offset across sample (A) andintravoxel standard deviation (B), in axial slice with 2.5×2.5×10mm3 voxels (same slice as hyperpolarized data in Figure 6).
MRI Experiments
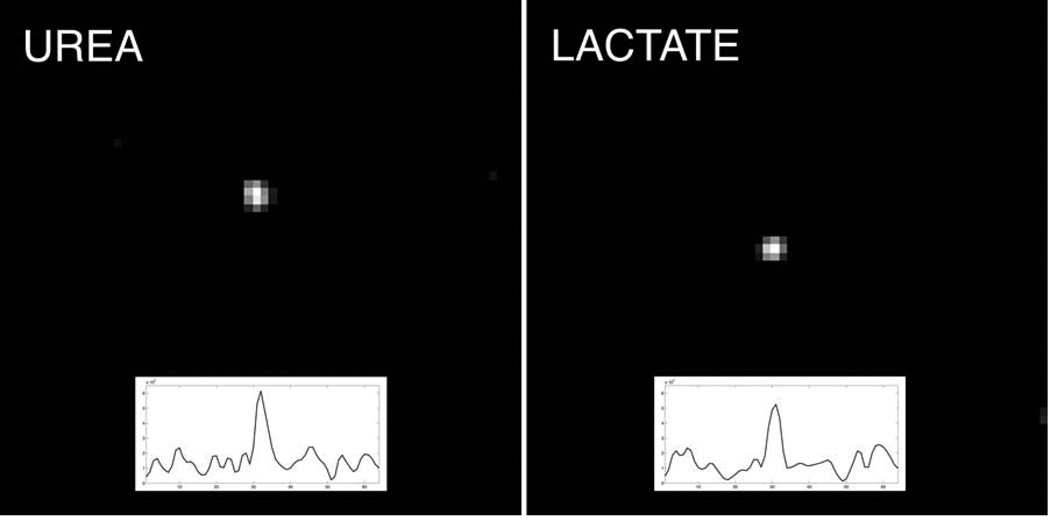
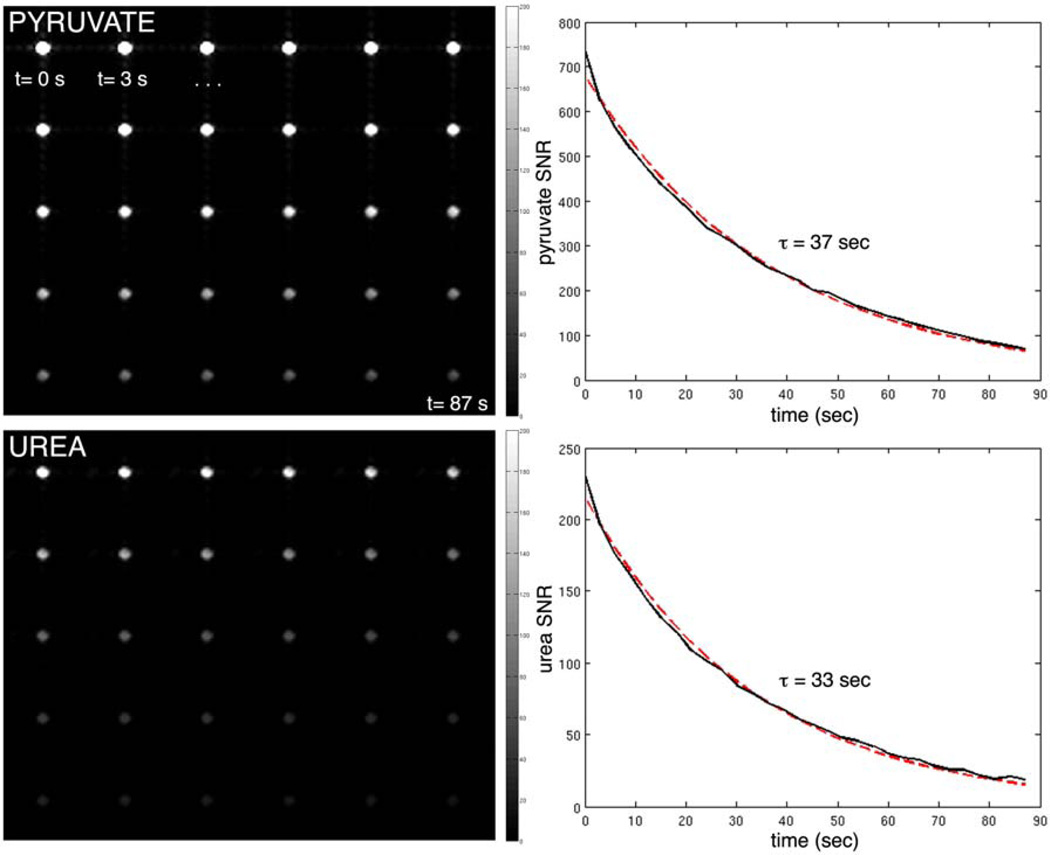
Results of the phantom imaging experiments are shown in Figures 4 & 5. For the thermal urea and lactate syringes, separate images of each syringe were produced (SNR ~5:1)by changing the center frequency, with no detectable component at the position of the other syringe. For the hyperpolarized scan, high SNR dynamic images of the co-polarized pyruvate and urea were produced over 87 sec. The data fit well to decaying exponentials with time constants of 37 sec (pyruvate) and 33 sec (urea).
Figure 4.
Frequency-specific axial bSSFP images of [13C]urea (left) and [13C]lactate (right) syringes, created by moving the center frequency of the RF pulse. Respective horizontal signal profiles through syringe are also shown.
Figure 5.
Dynamic frequency-specific bSSFP images of syringe containing 40 mM solution of co-polarized pyruvate (top) and urea (bottom), acquired every 3 seconds (left-to-right). Plots show image SNR (solid line) and exponential fits to the data (dotted red line).
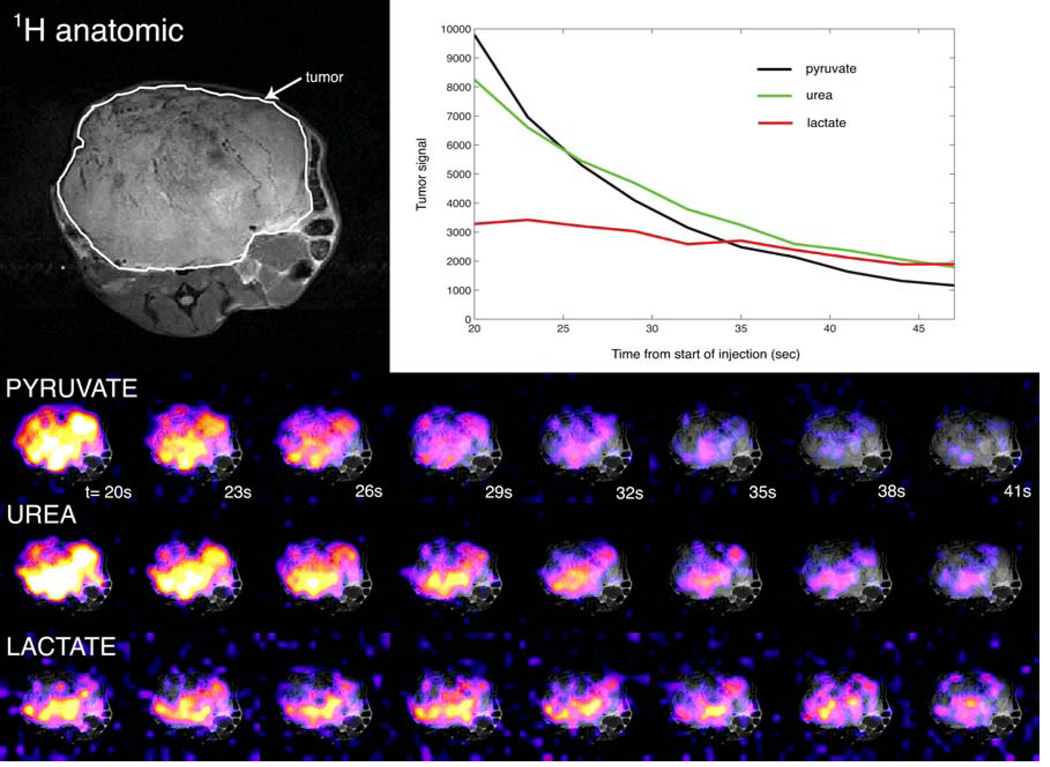
The frequency-specific SSFP acquisition enabled rapid 2D dynamic imaging of hyperpolarized pyruvate, lactate, and urea in the TRAMP mouse tumor. Images and dynamic curves are shown in Figure 5. Observation of high lactate-to-pyruvate ratios within the tumor region (e.g. lac/pyr= 0.8 at 30 sec post-injection) was consistent with previous dynamic imaging studies with hyperpolarized [1-13C]pyruvate in the TRAMP model[19–21].
Discussion
We have demonstrated a new method utilizing the low flip angle SSFP response for obtaining dynamic frequency-specific images of multiple hyperpolarized compounds at high spatiotemporal resolution. The resulting spatiotemporal resolution compares favorably with other ultra-fast hyperpolarized metabolic imaging methods that utilize frequency-specific spectral-spatial excitation [22]or non-Cartesian fast MRSI methods [23, 24]. The SSFP approach described can yield a stable hyperpolarized signal over a limited bandwidth, without large tip refocusing pulses that may cause excessive losses of hyperpolarized magnetization due to miscalibration of transmit gain, or spatial B1 variation due to the RF coil transmit pattern.
Automatic determination and setting of center frequencies was helpful for overcoming the relatively narrow bandwidth of response. Based on the in vivo shimming data, and on the good qualitative appearance of the images, our approaches were effective. Synthesis of an optimized composite frequency response based on multiple acquisitions was feasible since the frequency profiles were known, the individual acquisitions could be performed quickly, and they have negligible impact on magnetization outside the pass band. The composite approach was conceptually similar to a recent preliminary study that showed spectrally resolved hyperpolarized 13C images can be reconstructed by fitting known frequency profiles with data from multiple acquisitions with variable phase advance[25].
Results could be further improved by fully optimizing the SSFP pulse sequence. Due to practical sequence programming issues, we were unable to approach the theoretical limit of SNR efficiency for the given resolution as determined by gradient performance limits. Finally, custom SSFP acquisitions with further optimized spectral selectivity, such as alternating TR[26, 27] or amplitude- or phase-modulated RF pulse trains may be well suited for applications of hyperpolarized 13C metabolic imaging.
Figure 6.
Axial dynamic imaging of hyperpolarized 13C pyruvate, lactate, and urea in prostate tumor of TRAMP mouse, and plots of mean dynamic hyperpolarized signals within tumor region as identified on anatomic imaging.
Acknowledgements
We gratefully acknowledge grant support from National Institutes of Health grant P41EB013598.
Footnotes
Publisher's Disclaimer: This is a PDF file of an unedited manuscript that has been accepted for publication. As a service to our customers we are providing this early version of the manuscript. The manuscript will undergo copyediting, typesetting, and review of the resulting proof before it is published in its final citable form. Please note that during the production process errors may be discovered which could affect the content, and all legal disclaimers that apply to the journal pertain.
References
- 1.Freeman R, Hill HDW. Phase and Intensity Anomalies in Fourier Transform Nmr. Journal of Magnetic Resonance. 1971;4(3):366. &. [Google Scholar]
- 2.Derbyshire JA, Herzka DA, McVeigh ER. S5FP: spectrally selective suppression with steady state free precession. Magnetic resonance in medicine : official journal of the Society of Magnetic Resonance in Medicine / Society of Magnetic Resonance in Medicine. 2005;54(4):918–928. doi: 10.1002/mrm.20633. [DOI] [PMC free article] [PubMed] [Google Scholar]
- 3.Hargreaves BA, et al. Fat-suppressed steady-state free precession imaging using phase detection. Magnetic resonance in medicine : official journal of the Society of Magnetic Resonance in Medicine / Society of Magnetic Resonance in Medicine. 2003;50(1):210–213. doi: 10.1002/mrm.10488. [DOI] [PubMed] [Google Scholar]
- 4.Scheffler K, et al. Detection of BOLD changes by means of a frequency-sensitive trueFISP technique: preliminary results. Nmr in Biomedicine. 2001;14(7–8):490–496. doi: 10.1002/nbm.726. [DOI] [PubMed] [Google Scholar]
- 5.Golman K, et al. Molecular imaging with endogenous substances. Proc Natl Acad Sci USA. 2003;100(18):10435–10439. doi: 10.1073/pnas.1733836100. [DOI] [PMC free article] [PubMed] [Google Scholar]
- 6.Johansson E, et al. Cerebral perfusion assessment by bolus tracking using hyperpolarized 13C. Magnetic resonance in medicine : official journal of the Society of Magnetic Resonance in Medicine / Society of Magnetic Resonance in Medicine. 2004;51(3):464–472. doi: 10.1002/mrm.20013. [DOI] [PubMed] [Google Scholar]
- 7.Svensson J, et al. Hyperpolarized 13C MR angiography using trueFISP. Magnetic resonance in medicine : official journal of the Society of Magnetic Resonance in Medicine / Society of Magnetic Resonance in Medicine. 2003;50(2):256–262. doi: 10.1002/mrm.10530. [DOI] [PubMed] [Google Scholar]
- 8.von Morze C, et al. Imaging of blood flow using hyperpolarized [(13)C]urea in preclinical cancer models. Journal of magnetic resonance imaging : JMRI. 2011;33(3):692–697. doi: 10.1002/jmri.22484. [DOI] [PMC free article] [PubMed] [Google Scholar]
- 9.Leupold J, et al. Fast multiecho balanced SSFP metabolite mapping of (1)H and hyperpolarized (13)C compounds. Magma. 2009;22(4):251–256. doi: 10.1007/s10334-009-0169-z. [DOI] [PubMed] [Google Scholar]
- 10.Ardenkjaer-Larsen JH, et al. Increase in signal-to-noise ratio of > 10,000 times in liquid-state NMR. Proc Natl Acad Sci USA. 2003;100(18):10158–10163. doi: 10.1073/pnas.1733835100. [DOI] [PMC free article] [PubMed] [Google Scholar]
- 11.von Morze C, et al. Investigating tumor perfusion and metabolism using multiple hyperpolarized (13)C compounds: HP001, pyruvate and urea. Magnetic resonance imaging. 2011 doi: 10.1016/j.mri.2011.09.026. [DOI] [PMC free article] [PubMed] [Google Scholar]
- 12.Wilson DM, et al. Multi-compound polarization by DNP allows simultaneous assessment of multiple enzymatic activities in vivo. Journal of magnetic resonance. 2010;205(1):141–147. doi: 10.1016/j.jmr.2010.04.012. [DOI] [PMC free article] [PubMed] [Google Scholar]
- 13.Aronen HJ, et al. High microvascular blood volume is associated with high glucose uptake and tumor angiogenesis in human gliomas. Clin Cancer Res. 2000;6(6):2189–2200. [PubMed] [Google Scholar]
- 14.Komar G, et al. Decreased blood flow with increased metabolic activity: a novel sign of pancreatic tumor aggressiveness. Clin Cancer Res. 2009;15(17):5511–5517. doi: 10.1158/1078-0432.CCR-09-0414. [DOI] [PubMed] [Google Scholar]
- 15.Mankoff DA, et al. Blood flow and metabolism in locally advanced breast cancer: relationship to response to therapy. J Nucl Med. 2002;43(4):500–509. [PubMed] [Google Scholar]
- 16.Hoult DI. Solution of the Bloch Equations in the Presence of a Varying B1 Field - Approach to Selective Pulse Analysis. Journal of Magnetic Resonance. 1979;35(1):69–86. [Google Scholar]
- 17.Greenberg NM, et al. Prostate cancer in a transgenic mouse. Proc Natl Acad Sci U S A. 1995;92(8):3439–3443. doi: 10.1073/pnas.92.8.3439. [DOI] [PMC free article] [PubMed] [Google Scholar]
- 18.Rasband WS ImageJ. U.S. National Institues of Health; Bethesda, Maryland, USA: 1997–2005. http://rsb.info.nih.gov/ij/ [Google Scholar]
- 19.Chen AP, et al. Hyperpolarized C-13 spectroscopic imaging of the TRAMP mouse at 3T-initial experience. Magnetic resonance in medicine : official journal of the Society of Magnetic Resonance in Medicine / Society of Magnetic Resonance in Medicine. 2007;58(6):1099–1106. doi: 10.1002/mrm.21256. [DOI] [PubMed] [Google Scholar]
- 20.Larson PE, et al. Investigation of tumor hyperpolarized [1-13C]-pyruvate dynamics using time-resolved multiband RF excitation echo-planar MRSI. Magnetic resonance in medicine : official journal of the Society of Magnetic Resonance in Medicine / Society of Magnetic Resonance in Medicine. 2010;63(3):582–591. doi: 10.1002/mrm.22264. [DOI] [PMC free article] [PubMed] [Google Scholar]
- 21.Larson PE, et al. Fast dynamic 3D MR spectroscopic imaging with compressed sensing and multiband excitation pulses for hyperpolarized 13C studies. Magnetic resonance in medicine : official journal of the Society of Magnetic Resonance in Medicine / Society of Magnetic Resonance in Medicine. 2011;65(3):610–619. doi: 10.1002/mrm.22650. [DOI] [PMC free article] [PubMed] [Google Scholar]
- 22.Lau AZ, et al. Rapid multislice imaging of hyperpolarized 13C pyruvate and bicarbonate in the heart. Magnetic resonance in medicine : official journal of the Society of Magnetic Resonance in Medicine / Society of Magnetic Resonance in Medicine. 2010;64(5):1323–1331. doi: 10.1002/mrm.22525. [DOI] [PubMed] [Google Scholar]
- 23.Wiesinger F, et al. IDEAL spiral CSI for dynamic metabolic MR imaging of hyperpolarized [1-(13) C]pyruvate. Magnetic resonance in medicine : official journal of the Society of Magnetic Resonance in Medicine / Society of Magnetic Resonance in Medicine. 2011 doi: 10.1002/mrm.23212. [DOI] [PubMed] [Google Scholar]
- 24.Mayer D, et al. Fast metabolic imaging of systems with sparse spectra: application for hyperpolarized 13C imaging. Magnetic resonance in medicine : official journal of the Society of Magnetic Resonance in Medicine / Society of Magnetic Resonance in Medicine. 2006;56(4):932–937. doi: 10.1002/mrm.21025. [DOI] [PubMed] [Google Scholar]
- 25.Grant AK, et al. Chemical Shift Selective Imaging of Hyperpolarized 13C Using Variable Phase Balanced Steady-State Free Precession. Proc Intl Soc Mag Reson Med 19. 2011 [Google Scholar]
- 26.Leupold J, Hennig J, Scheffler K. Alternating repetition time balanced steady state free precession. Magnetic resonance in medicine : official journal of the Society of Magnetic Resonance in Medicine / Society of Magnetic Resonance in Medicine. 2006;55(3):557–565. doi: 10.1002/mrm.20790. [DOI] [PubMed] [Google Scholar]
- 27.Nayak KS, et al. Wideband SSFP: alternating repetition time balanced steady state free precession with increased band spacing. Magnetic resonance in medicine : official journal of the Society of Magnetic Resonance in Medicine / Society of Magnetic Resonance in Medicine. 2007;58(5):931–938. doi: 10.1002/mrm.21296. [DOI] [PubMed] [Google Scholar]


