Abstract
Nanofluidics has a unique property that ionic conductance across a nanometer-sized confined space is strongly affected by the space surface charge density, which can be utilized to construct electrical read-out biosensor. Based on this principle, this work demonstrated a novel protein sensor along with a sandwich signal enhancement approach. Nanoparticles with designed aptamer onside are assembled in a suspended micropore to form a 3-dimensional network of nanometer-sized interstices, named as nanofluidic crystal hereafter, as the basic sensing unit. Proteins captured by aptamers will change the surface charge density of nanoparticles and thereby can be detected by monitoring the ionic conductance across this nanofluidic crystal. Another aptamer can further enlarge the variations of the surface charge density by forming a sandwich structure (capturing aptamer/protein/signal enhancement aptamer) and the read-out conductance as well. The preliminary experimental results indicated that human α-thrombin was successfully detected by the corresponding aptamer modified nanofluidic crystal with the limit of detection of 5 nM (0.18 μg/ml) and the read-out signal was enhanced up to 3 folds by using another thrombin aptamer. Being easy to graft probe, facile and low-cost to prepare the nano-device, and having an electrical read-out, the present nanofluidic crystal scheme is a promising and universal strategy for protein sensing.
INTRODUCTION
Protein sensing plays an important role in modern biological and medical studies. A variety of physical and chemical phenomena have been harnessed to develop protein sensors.1, 2, 3, 4, 5 Among these, nanowire based field-effect transistor attracts great attentions as it can directly translate the protein-probe interaction at the outer surface of nanowire into electrical signals (the drain-source current).6, 7, 8 Similarly, nanofluidics, the study and application of fluid flow and electrokinetics at nanoscale, is also acknowledged as a promising sensing scheme because of its capability of converting the protein-probe interaction at the inner surface of a nanometer-size confined space to an ionic current variation.9, 10 For a nanofluidic device, as the feature size is comparable to the Debye length, the electrical double layers (EDLs) inside the nanoscale space will overlap. Under this condition when the surface charge can attract enough counter ions inside the channel, i.e., the characteristic size of the channel is smaller than the Dukhin length,11 the ionic conductance across the space will be dominated by the surface charge density, which poses a chance for surface status monitoring. By grafting probes onto the inner surface of this nanometer-size confined space, target molecules can be detected once they were captured by the probes and thereby varied the surface charge density.
Although current lithography-based techniques provide considerable opportunities to realize various nanofluidic devices, the fabrication processes are usually complicated, expensive and time consuming. Meanwhile, some reported non-lithographic nanofabrication methods addressed the above problems to some extent but at the expense of the fabrication controllability, long-range order, and integration ability.12, 13 Therefore, a facile and low cost nanofabrication strategy for rapid prototyping of nanofluidic device is still highly in demands. More importantly, compared with traditional nanofluidic device,14, 15, 16 the nanofluidic crystal based protein sensor has more surface modification methods as nanoparticles made of many other materials besides silica can be used.
Our previous work has demonstrated that interstices inside a self-assembled nanoparticle structure, nanofluidics crystal herein, have the typical electrokinetic property of a single nanochannel but exhibiting a larger electrical read-out.17 The characteristic diameter of the equivalent nanochannel is 0.2366d, where d is the diameter of nanoparticle.17 This means that packing nanoparticles with diameter of 500 nm can achieve nanofluidic device with feature size around 120 nm. The nanofluidic crystal combines the advantages of both nanoporous material (large surface area) and fabricated nanochannels (deterministic geometry). More importantly, nanoparticle can be easily modified with probe molecules through the mature silane-chemistry before being packed, which makes it possible to construct varied biosensing nanofluidic devices at will. Suspended streptavidin-modified nanofluidic crystal has showed its capability of biotin detection with a LOD (limits of detection) of 5 nM by an impedance measurement.18 However, real protein sensing has not been demonstrated based on this nanofluidic crystal principle and the electrical measurement needs further improvement.
This work further explored the applicability of nanofluidic crystal in real protein sensing by using aptamer as the capturing probe and a signal enhancement strategy was demonstrated. Human α-thrombin, a multifunctional serine protease which plays a prominent role in the maintenance and regulation of hemostasis,19 was selected as the model protein.
WORKING PRINCIPLE
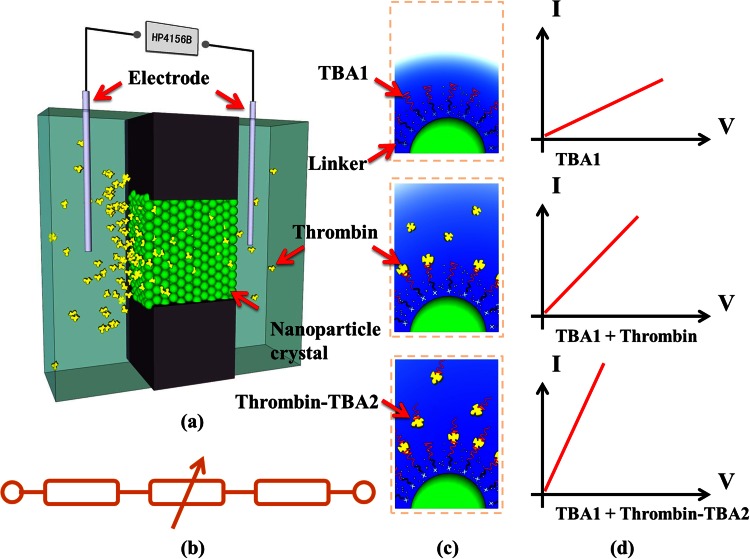
Working principle of this nanofluidic crystal based protein sensor was shown in Figure 1. As schematically illustrated in Figure 1a, nanoparticles, which are modified with a high efficient thrombin binding aptamer (named as TBA1 hereafter),20 are packed in a micropore to form nanofluidic crystal. Conductance across this nanofluidic crystal is measured based on a simplified resistance model showed in Figure 1b. The loaded thrombin molecules will be captured by the aptamer probes on the surface of the nanoparticles, which would change the surface charge density and then lead to a variation of ionic conductance across the packed nanoparticles (Figures 1c, 1d-top/middle). Another thrombin-specific aptamer (TBA2 for short), which binds distinct epitopes of thrombin,21 is used to further enlarge the variation of the surface charge density to enhance the read-out signal by forming a TBA1/thrombin/TBA2 sandwich structure, as shown in Figures 1c, 1d-bottom.
Figure 1.
Schematic illustrations of the present nanofluidic crystal based protein sensor and its signal enhancement. (a) Sensing principle of the present nanofluidic crystal; (b) equivalent electrical model of the sensing unit; (c) basic surface status, thrombin captured status, and signal enhancement status, from top to bottom; (d) corresponding I-V curves for three different surface statuses in (c).
MATERIALS AND REAGENTS
500 nm bare- and 540 nm streptavidin coated-silica nanoparticles were supplied by Technical Institute of Physics and Chemistry of Chinese Academic Society, China and Bangs Laboratories, respectively. All oligonucleotides, including TBA1, TBA2, and random ssDNA, used in the experiment were synthesized by Dingguo Company, China, with sequences listed in Table TABLE I.. Human α-thrombin and lysozyme were provided by Dingguo Company, China. Washing/binding buffers were prepared by following the protocol from Bangs Laboratories, with ingredients of 20 mM Tris (pH = 7.5), 1 M NaCl, 1 mM EDTA, and 0.0005% Triton-X 100. All chemicals were from Sigma.
TABLE I.
Sequences of oligonucleotides (DNA/aptamers) used in the present work.
| DNA/aptamers | Abbreviations | Sequences from 5′ to 3′ |
|---|---|---|
| Thrombin aptamer for capturing | TBA1 | GGTTGGTGTGGTTGG |
| Biotinylated TBA1 | b-TBA1 | Biotin-C6-GGTTGGTGTGGTTGG |
| FAM a linked biotinylated TBA1 | b-TBA1-FAM | Biotin-C6-GGTTGGTGTGGTTGG-FAM |
| Thrombin aptamer for signal enhancement | TBA2 | AGTCCGTCCTAGGGCAGGTTGGGGTGACT |
| TBA2 with 10 thymine bases | TBA2-10T | T10-AGTCCGTCCTAGGGCAGGTTGGGGTGACT |
| TBA2 with 20 thymine bases | TBA2-20T | T20-AGTCCGTCCTAGGGCAGGTTGGGGTGACT |
| Biotinylated ssDNA | b-ssDNA | Biotin-C6-TTCTTTCTTCCCCTTGTTTGTT |
FAM: (5-)6-carboxy-fluorescein.
MICROPORE FABRICATION
Microfabrication of the micropore was introduced elsewhere.18 Briefly, square patterns with 20 μm in-width were formed onto a 3000 Å thick oxide layer on a double-side silicon wafer. Then a 1100 Å thick silicon nitride layer was prepared by low pressure chemical vapor deposition (LPCVD) to function as the protection layer in the following KOH etching. A suspended silicon membrane with thickness of 50 μm was formed after a 350 min KOH etching from the back side of the wafer with the silicon nitride etching mask patterned by lithography and reactive ion etching (RIE). The silicon nitride layer was then removed in a hot H3PO4 bath. Deep reactive ion etching (DRIE) etched through the silicon membrane with the predefined SiO2 layer (20 μm wide square patterns) as the mask to achieve the micropore structure. At last, another 3000 Å thick oxide layer was grown to achieve electrical isolation in the measurement.
NANOPARTICLES MODIFICATION, ASSEMBLY, AND CHARACTERIZATION
The b-TBA1-FAM was used to evaluate the binding performance of TBA1 onto the silica nanoparticles through the biotin-streptavidin reaction. The method to modify the streptavidin coated-silica nanoparticles with b-TBA1 (w/wo FAM) and b-ssDNA was carried out by following the suggested protocol from Bangs Laboratories. Briefly, an aliquot of 40 μl streptavidin-coated silica nanoparticle (10 mg/ml) was added into a microcentrifuge and washed two times with 40 μl binding/washing buffer by sedimentating the nanoparticles at 10 000 rpm for 3 min and decanting the supernatant. To bind the b-TBA1 or b-ssDNA, the nanoparticles were re-suspended in 8 μl binding/washing buffer (50 mg/ml) along with 2 μl b-TBA1 or b-ssDNA (100 μM). Then, the mixture was incubated for an hour on a vortexer. The nanoparticles were washed three times in 10 μl DI water (deionization water) to remove any unbound biotinylated oligonucleotides.
The oligonucleotide-bound nanoparticles were re-suspended in 10 μl DI water (final concentration of 40 mg/ml) and assembled in the prefabricated micropore. After being incubated overnight, nanoparticles were assembled inside the micropore and formed the nanofluidic crystal for the following electrical measurement.
The packed nanofluidic crystal in the micropore was characterized by SEM (FEI QUANTA 600). Zeta potentials of nanoparticles suspended in DI water with different thrombin concentrations were measured by Zetasizer (Malvern Instruments, Ltd.), as a way to estimate the surface charge status in parallel.
ELECTRICAL MEASUREMENT
A homemade gadget, which was made up of two separated parts, each containing a reservoir for buffer storage and sample loading, was used to fix the chip for the electrical measurement. The micropore chip was placed in between the two parts and clamped with O-rings. In the measurement, the detection system was exposed to air and water, used as the buffer, would be saturated by CO2. The pH value was 5.6, the typical value for CO2-saturated water, and the concentration of hydrogen ion was around 2.51 μM. The Debye length under this scenario was about 190 nm, which was much larger than the characteristic size of the present nanofluidic crystal, i.e., around 120 nm for 540 nm nanoparticle calculated based on the aforementioned equivalent nanochannel diameter. Therefore, the electrical double layer was overlapped inside the present nanofluidic crystal and the surface charge status predominated the ionic conductance. Different amount of human α-thrombin (in DI water) was loaded into the reservoir. When a bias was applied on silver electrodes (acupuncture pins, Suzhou Dongbang Medical co., Ltd.) in two reservoirs, the ionic current only went through the nanofluidic crystal in the micropore. I-V curves across the nanofluidic crystal were recorded with bias varied from 0 to 1 V linearly and were used to calculate the ionic conductance. All electrical measurements were carried out by HP 4156B (Agilent).
In the signal enhancement experiment, the thrombin molecules were first incubated with TBA2 for 2 h in DI water before being added into the reservoirs. Then the following measurement procedures were exactly the same as the above. Considering that more bases present a larger variation of surface charge density and thereby will produce a larger signal, TBA2 with extra 10 and 20 thymine bases (TBA2-10T, TBA2-20T) linked at its 5′-terminal were also tested as the signal-enhancement probes.
Before testing a freshly prepared nanofluidic crystal device, a 10 V bias was first loaded to stabilize the nanoparticles inside the micropore. To speed up the thrombin molecules flowing through the nanoparticles for corresponding aptamer capturing, another 10 V bias was applied to form a directional electrophoresis for sample loading.
Several control groups were studied in parallel, including: streptavidin-coated silica nanoparticle without any probes modification (naked nanoparticle) for non-specific adsorption exclusion control, nanofluidic crystal with a random single strand DNA (b-ssDNA) modification for selectivity control, TBA1 modified nanofluidic crystal for lysozyme detection as another selectivity control. A control group of TBA1-modified nanofluidic crystal with TBA2 was also carried out to evaluate the possible non-specific adsorption of TBA2 on the nanoparticles.
MODEL AND CALCULATION
A simplified model for nanofluidic crystal has been introduced in our previous works.17, 18 Briefly, the connective structure between a tetrahedral interstice and an octahedral one inside the nanofluidic crystal was analogized to a cylinder nanotube with the same inner surface and effective volume. As aforementioned, the electrical double layers were always overlapped within the present work and the ionic conductance of a nanofluidic crystal was then simplified as18
| (1) |
where , σ, and d represent ionic mobility of the carrier, H+ in this work, surface charge density, and the diameter of the nanoparticle, respectively. and refer to the cross-sectional area and the length of the micropore. From Eq. 1, surface charge density can be calculated from the ionic conductance, which can be derived from the measured I-V curves.
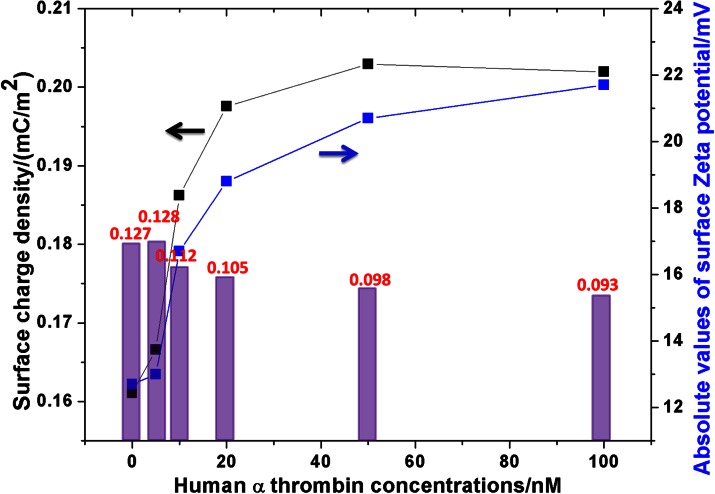
It is not easy to measure the surface charge density of nanoparticles directly, especially when the particles are close-packed in a confined space, exactly the case as in the present work. It has been found that the effective surface charge density is in a linear relationship with the Zeta potential of nanoparticles,22 which is much easier to be measured when the nanoparticles are freely suspended in corresponding buffers. As the target protein concentration is very low, the permeability of the buffer, the main efficiency of the above linear relationship, will not vary significantly. Therefore, the ratio of the surface charge density calculated from Eq. 1 to the Zeta potential measured from nanoparticle suspension, i.e., data from two separated and independent experiments except of sharing the same thrombin concentration, should be insensitive to the thrombin concentration. This character can be used as an indirect way to evaluate the sensing performance of this work.
RESULT AND DISCUSSION
The b-TBA1-FAM experimental results shown in Figure S1 in the supplementary material (ESI1)23 indicated that b-TBA1 was successfully bound onto the nanoparticles and the binding efficiency increased with the incubation time. After a trade-off between the binding efficiency and the assay time, 1 h incubation was used for all the oligonucleotides (b-TBA1 and b-ssDNA) binding operations in this work.
The Zeta potential of the nanoparticles with b-TBA1 grafted onside was −12.7 mV, while after binding with thrombin (for example, 10 nM), the Zeta potential decreased to −16.7 mV. The negative Zeta potentials indicated that the surface was negatively charged and the increment of the absolute value meant the surface charge density was increasing, which was contributed by the bound thrombin molecules.
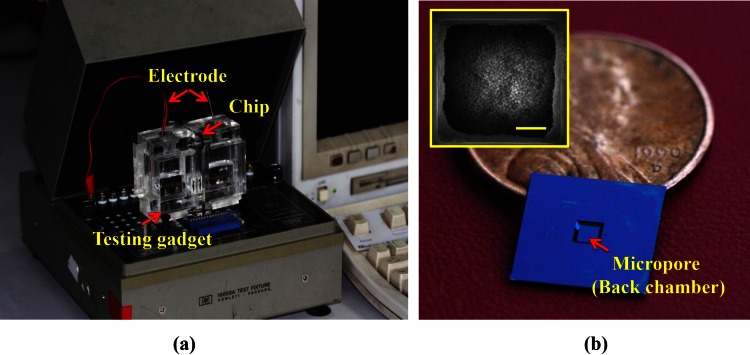
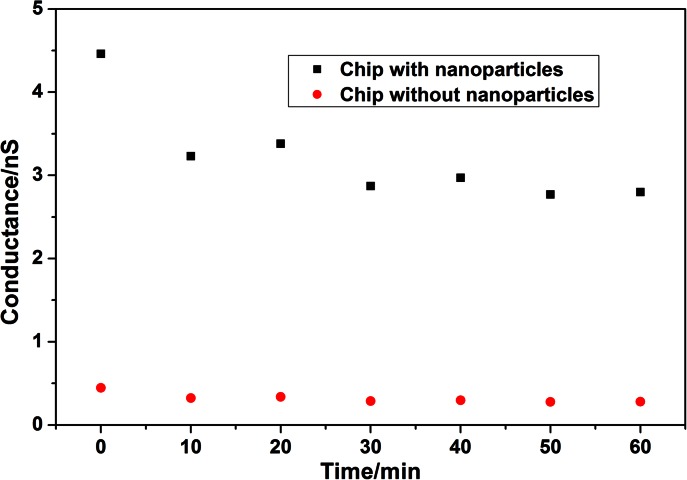
The experimental setup and so-prepared nanofluidic crystal device were showed in Figure 2. A 10 V bias was applied for 60 min with the conductance of nanofluidic crystal measured every 10 min, as shown in Figure 3. The conductance kept decreasing in the first 30 min and then stayed relatively stable thereafter. While for the case without nanoparticles packed inside, the measured conductance stayed constant under the 10 V bias. The initial conductance drop might be originated by the instability of the nanoparticle crystal caused by the interaction between the nanoparticles and the strong electric field under 10 V bias, which is the cutting edge topic in nanofluidics.24, 25, 26, 27, 28 Another reason for the initial conductance decrement could be the electrochemical relaxation of the electrodes. So, before testing every newly packed nanofluidic crystal, a 30 min 10 V bias was applied to guarantee the measurement free of effect from the nanoparticle disaggregation.
Figure 2.
The experimental setup and the chip. (a) The whole experimental system; (b) Photo of the micropore chip with a penny for comparison. Inserted is a SEM photo of the packed nanoparticles (from the pore-side). The scale bar is 5 μm.
Figure 3.
Variation of conductance with time during the stabilization of nanofluidic crystal under 10 V bias.
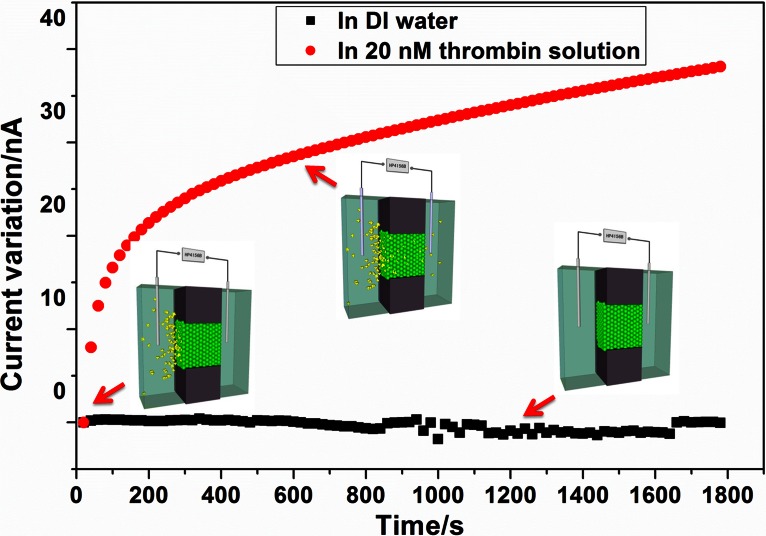
The diffusion of macromolecules, such as proteins, is very slow. Considering that the diffusivity of small protein is around 40 μm2/s,10 the calculated time for thrombin molecule to diffuse a distance of 1 cm (the distance between the loading position and the nanofluidic crystal) will be more than 40 000 min. To speed up the sample loading, after loading the proteins into the reservoir, another 10 V bias was applied to electrically drive the thrombin molecules move through the nanofluidic crystal for corresponding b-TBA1 capturing. The current was monitored and showed in Figure 4. The result indicated that ionic current increased by about 30 nA in the first 10 min due to the thrombin bound onto the nanoparticles. And in the following 20 min, the current only increased about 10 nA, which implied a slow trend towards the equilibrium between association and dissociation. To save the assay time, a 10 min electrophoresis time was used in the following experiment for thrombin loading.
Figure 4.
Variation of the ionic current with time during electrophoresis loading of thrombin molecules. The current keeps stable in DI water without loading thrombin.
Within the above two 10 min 10 V bias loads, the electric quantity passed through the circuit was about 7.47 × 10⁻⁵ C calculated from integrals of the measure time-current curves. This meant that, even if all the ions (Ag+) remained in the reservoir, which will not happen actually, the ionic concentrations would be around 0.1 μM, which may not cause any noticeable effects on the following measurements.
In the electrical measurements, I-V curves across the nanofluidic crystal were recorded with the bias varied from 0 to 1 V and were used to calculate the corresponding conductance by a simple linear fitting. The conductance of a nanofluidic crystal device (typical data of 1 nS without thrombin binding) was less than 1% of that in the blank case, i.e., without the micropore chip in the testing system, whose typical value was 100 nS. Therefore, the measured ionic conductance of the nanofluidic crystal device was dominated by the sensing unit, and the conductance variation introduced by thrombin capturing was able to trace back the thrombin concentration, as shown in Figure 5. The results indicated that the conductance variation increased with the thrombin concentration, which was attributed to the additive negative charges induced by the captured protein molecules. The LOD was 5 nM, which was similar to the previous results of biotin detection.18 Concentration below 5 nM was un-detectable presently as the surface charge density changed little in these cases. However, a simple estimation based on the binding capacity of single nanoparticle (data sheet from Bangs Laboratories) and the number of nanoparticles packed in the present micropore indicated that the saturation of the present nanofluidic crystal should be around 1 pM (considering the loading volume in this work; details are shown the supplementary material (ESI 2)), which is much smaller than the LOD reported here. So the efficiency of the present electrophoresis-based sample loading approach was very low and further efforts were required to improve it.
Figure 5.
Conductance variation with thrombin concentration in DI water. The inserted photo shows a typical I-V curve. The error bars represent three independent tests.
From Figure 5, the sandwich signal enhancement by introducing additional TBA2 to thrombin increased the read-out signal as expected. For example, the conductance variation was enlarged more than 3 folds in the 50 nM case. However, the enhancement was not noticeable when the thrombin concentration was near the LOD because the number of nanoparticles binding with thrombin molecules was probably very small and the number of the thrombin molecules bound by each nanoparticle could be also limited (details are discussed in the supplementary material (ESI 3)). It is well known that TBA2, a single strand DNA, is also negatively charged in DI water. When it binds to thrombin and then the complex is captured by b-TBA1 modified on the surface of the nanoparticle, a sandwich structure, TBA1/thrombin/TBA2 like antibody/antigen/second antibody in ELISA, is formed and more charges will be brought to the surface, which further increase the variation of the surface charge density and the ionic conductance as well. Unfortunately, neither TBA2-10T nor TBA2-20T increased the read-out signal (Table S1 in the supplementary material (ESI4)23), which implied that the extra bases here might prohibit the binding of TBA2 to thrombin or the binding reaction between the TBA2-thrombin complex and the capturing b-TBA1 probe. Therefore, a careful design of the signal-enhancement molecule is very important and will be studied in the future.
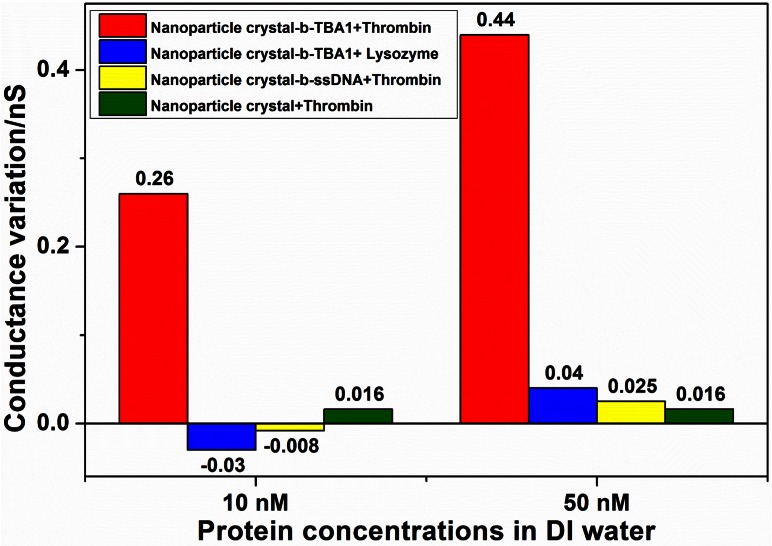
Figure 6 showed that conductance variations in three control groups were statistically insignificant compared to that in the experiment group (less than 10%), which proved the selectivity and specificity of the present nanofluidic crystal based protein sensing scheme. In the nanofluidic crystal-b-TBA1+TBA2 control experiment, when the concentrations of TBA2 were 10 nM and 50 nM, the conductance variations were only 0.004 nS and 0.021 nS, respectively, which were less than 5% of those induced by thrombin-TBA2 with the same concentration. So, non-specific adsorption of TBA2 can be neglected. As shown in Figure 7, the ratio of the calculated surface charge density to the measured Zeta potential in this work was 0.011 ± 0.002 C/Vm2. The meaningful small deviation indicated that present protein detection was exactly based on the nanofluidics principle as aforementioned, i.e., the ionic conductance was dominated by the surface charge density.
Figure 6.
Comparison of the conductance variations in the experiment group and three control groups.
Figure 7.
Variation of the measured surface Zeta potentials (absolute values, all measured Zeta potentials were negative) and the calculated surface charge densities with the thrombin concentration. The columns (data on top) represented the ratios of the calculated surface charge density to the measured Zeta potential in each case, which theoretically should be the same.
CONCLUSIONS
This work reported a nanofluidic crystal based protein sensor and its signal enhancement approach. The preliminary results indicated that the LOD of thrombin sensing by this protein sensor based on an electrophoresis sample loading approach was around 5 nM (0.18 μg/ml) and the read-out signal was enlarged up to 3 folds through a sandwich signal enhancement strategy. The present nanofluidic crystal based protein sensor holds advantages as: (1) Low cost, it costs less than 4 US dollars for single nanoscale sensing unit in the laboratory-level, and around one day for probing and assembling the functional nanoparticles; (2) Simple, the micropore is prepared by a mature microfabrication process and the nanoscale components are achieved by a routing pipetting operation; (3) Easy surface probe modification, the probe can be grafted onto nanoparticle with a robust streptavidin-biotin reaction strategy before the nanoparticles packing, i.e., with nanoparticles freely dispersed in the suspension. (4) More importantly, varied aptamers have been screened and ready for corresponding specific and selective protein capturing and signal enhancement, which indicated the present approach is a universal strategy for protein sensing. However, the present nanofluidic crystal based biosensor still needs further improvements, especially in the following two aspects: (1) Using smaller nanoparticles, i.e., smaller characteristic size, to make the sensing process more compatible with the physiological buffer, which usually has a high ionic concentration, thereby a small Debye length; (2) Achieving a more efficient sample loading approach to expand the linear detection range. In general, the present nanofluidic crystal scheme along with its signal enhancement approach holds a promising future in developing an electrical read-out protein sensing unit for clinical diagnosis or multi-functional micro total analysis system with the help of other micro/nanofluidics components.
ACKNOWLEDGMENTS
We would like to thank the Major State Basic Research Development Program (973 Program) (Grant Nos. 2009CB320300 and 2011CB309502), the National Natural Science Foundation of China (Grant Nos: 60976086 and 91023045), and the 985-III program (clinical applications) in Peking University, and the President Fund for Undergraduate Student Research Training in Peking University.
References
- Kim D., Daniel W. L., and Mirkin C. A., Anal. Chem. 81, 9183–9187 (2009). 10.1021/ac9018389 [DOI] [PMC free article] [PubMed] [Google Scholar]
- Zhao J., Zhang X., Yonzon C. R., Haes A. J., and Van Duyne R. P., Nanomedicine 1, 219–228 (2006). 10.2217/17435889.1.2.219 [DOI] [PubMed] [Google Scholar]
- Estrela P., Paul D., Song Q., Stadler L. K., Wang L., Huq E., Davis J. J., Ko Ferrigno P., and Migliorato P., Anal. Chem. 82, 3531–3536 (2010). 10.1021/ac902554v [DOI] [PubMed] [Google Scholar]
- Northen T. R., Lee J. C., Hoang L., Raymond J., Hwang D. R., Yannone S. M., Wong C. H., and Siuzdak G. A., Proc. Natl. Acad. Sci. 105, 3678–3683 (2008). 10.1073/pnas.0712332105 [DOI] [PMC free article] [PubMed] [Google Scholar]
- Ogi H., Nagai H., Fukunishi Y., Hirao M., and Nishiyama M., Anal. Chem. 81, 8068–8073 (2009). 10.1021/ac901267b [DOI] [PubMed] [Google Scholar]
- Cui Y., Wei Q., Park H., and Lieber C. M., Science 293(5533), 1289–1292 (2001). 10.1126/science.1062711 [DOI] [PubMed] [Google Scholar]
- Zheng G., Patolsky F., Cui Y., Wang W. U., and Lieber C. M., Nat. Biotechnol. 23, 1294–1301 (2005). 10.1038/nbt1138 [DOI] [PubMed] [Google Scholar]
- Duan X., Li Y., Rajan N. K., Routenberg D. A., Modis Y., and Reed M. A., Nat. Nanotechnol. 7, 401–407 (2012). 10.1038/nnano.2012.82 [DOI] [PMC free article] [PubMed] [Google Scholar]
- Abgrall P. and Nguyen N. T., Anal. Chem. 80, 2326–2341 (2008). 10.1021/ac702296u [DOI] [PubMed] [Google Scholar]
- Schoch R., Han J., and Renaud P., Rev. Mod. Phys. 80(3), 839–883 (2008). 10.1103/RevModPhys.80.839 [DOI] [Google Scholar]
- Bocquet L. and Charlaix E., Chem. Soc. Rev. 39, 1073–1095 (2010). 10.1039/b909366b [DOI] [PubMed] [Google Scholar]
- Mijatovic D., Eijkel J. C., and van den Berg A., Lab Chip 5, 492–500 (2005). 10.1039/b416951d [DOI] [PubMed] [Google Scholar]
- Duan C., Wang W., and Xie Q., Biomicrofluidics 7, 026501 (2013). 10.1063/1.4794973 [DOI] [PMC free article] [PubMed] [Google Scholar]
- Karnik R., Castelino K., Duan C., and Majumdar A., Nano Lett. 6, 1735–1740 (2006). 10.1021/nl061159y [DOI] [PubMed] [Google Scholar]
- Vlassiouk I., Kozel T. R., and Siwy Z. S., J. Am. Chem. Soc. 131, 8211–8220 (2009). 10.1021/ja901120f [DOI] [PMC free article] [PubMed] [Google Scholar]
- Wang X. and Smirnov S., ACS Nano 3(4), 1004–1011 (2009). 10.1021/nn900113x [DOI] [PMC free article] [PubMed] [Google Scholar]
- Chen Z., Wang Y. S., Wang W., and Li Z. H., Appl. Phys. Lett. 95(10), 102105 (2009). 10.1063/1.3223774 [DOI] [Google Scholar]
- Lei Y. H., Xie F., Wang W., Wu W. G., and Li Z. H., Lab Chip 10, 2338–2340 (2010). 10.1039/c004758a [DOI] [PubMed] [Google Scholar]
- Crawley J. T., Zanardelli S., Chion C. K., and Lane D. A., J. Thromb. Haemost. 5, 95–101 (2007). 10.1111/j.1538-7836.2007.02500.x [DOI] [PubMed] [Google Scholar]
- Lao Y. H., Peck K., and Chen L. C., Anal. Chem. 81, 1747–1754 (2009). 10.1021/ac801285a [DOI] [PubMed] [Google Scholar]
- Tasset D. M., Kubik M. F., and Steiner W., J. Mol. Biol. 272, 688–698 (1997). 10.1006/jmbi.1997.1275 [DOI] [PubMed] [Google Scholar]
- Behrens S. H. and Grier D. G., J. Chem. Phys. 115, 6716 (2001). 10.1063/1.1404988 [DOI] [Google Scholar]
- See supplementary material at http://dx.doi.org/10.1063/1.4802936 for binding efficiency between biotinylated oligonucleotides and streptavidin-coated microsphere, detailed calculation of theoretical saturation concentration, the discussion of sandwich signal enhancement method in low thrombin solution, and the detailed read-out signal enhancement.
- Chang H. and Yossifon G., Biomicrofluidics 3, 012001 (2009). 10.1063/1.3056045 [DOI] [PMC free article] [PubMed] [Google Scholar]
- Basuray S. and Chang H., Biomicrofluidics 4, 013205 (2010). 10.1063/1.3294575 [DOI] [PMC free article] [PubMed] [Google Scholar]
- Cheng I. and Chang H., Biomicrofluidics 1, 021503 (2007). 10.1063/1.2723669 [DOI] [PMC free article] [PubMed] [Google Scholar]
- Pethig R., Biomicrofluidics 4, 022811 (2010). 10.1063/1.3456626 [DOI] [PMC free article] [PubMed] [Google Scholar]
- Nakano A., Alanis F., Chao T., and Ros A., Biomicrofluidics 6, 034108 (2012). 10.1063/1.4742695 [DOI] [PMC free article] [PubMed] [Google Scholar]


