Abstract
Solvent plays a ubiquitous role in all biophysical phenomena. Yet, just how the molecular nature of water impacts processes in biology remains an important question. While one can simulate the behavior of water near biomolecules such as proteins, it is challenging to gauge the potential structural role solvent plays in mediating both kinetic and equilibrium processes. Here, we propose an analysis scheme for understanding the nature of solvent structure at a local level. We first calculate coarse-grained dipole vector fields for an explicitly solvated system simulated through molecular dynamics. We then analyze correlations between these vector fields to characterize water structure under biologically relevant conditions. In applying our method to the interior of the wild type chaperonin complex GroEL+ES, along with nine additional mutant GroEL complexes, we find that dipole field correlations are strongly related to chaperonin function.
INTRODUCTION
As the “universal solvent,” water perhaps plays its most ubiquitous role in biological systems, where processes as fundamental as self-assembly and mass transport are dominated by the nature of the dissolving medium. With a strong dielectric and a propensity to form stable hydrogen bonding networks, water reflects and shapes its surroundings with a remarkably sensitive solvent structure.1 Phenomena such as the hydrophobic effect, in which non-polar bodies seem to attract, are driven by water's propensity to maintain its optimal hydrogen bonding arrangement.2, 3, 4 On the other hand, water's large dipole moment makes it very responsive to the local electrostatic environment, and solvent structure tends to align itself with an electric field.5 The interplay between long-range electrostatics and hydrogen bonding often forces water into a frustrated state, wherein all favorable interactions with self and surroundings cannot be satisfied.6 Biological systems take advantage of both of these water behavior regimes to facilitate cellular processes, using both hydrophobicity and electrostatics to drive assembly and promote processes such as catalysis. As a result, rich and frustrated solvent environments, which are normally absent in bulk water, are omnipresent throughout biology.7, 8
Beyond sweeping statements such as those articulated above, it is often difficult to pinpoint a solvent's part in mediating a biophysical phenomenon. In particular, as solvent dynamics occur at picosecond time scales, it is hard to elucidate the role that water takes in driving biology's orders of magnitude slower processes. Still, progress has been made in connecting water structure to biological function. For example, previous simulation studies of the bacterial chaperonin complex GroEL+ES have demonstrated a strong correlation between local water density in the chaperonin cavity and protein refolding catalysis.9 Here, increased water density is posited to increase hydrophilicity near the chaperonin wall, driving hydrophobic collapse. Studies using popular methods such as 3D-RISM often also rely on a number density-based analysis to relate solvent structure to biological function.10, 11
Given that a density-based approach is often successful, what other theoretical techniques can we use to learn about solvent structure? From a physical perspective, the idea of applying a series expansion is always enticing: if the number density were to serve as a first order term in an expansion, what could we learn for higher order interactions? In analogy to the canonical virial expansion of pressure (given in Eq. 1), we would like to learn something about many-body interactions from higher order terms in the series,
| (1) |
We are not restricted, however, to expanding in powers of the number density. In one sense, number density provides a “monopole” characterization of solvent, describing the distribution of independent solvent molecule coordinates. Accordingly, one could look to dipoles in a system to provide a natural second order description of solvent behavior,
| (2) |
The dipole moment encodes information about the microscopic orientations of charge distributions within a system. If one can subdivide the dipole moment in a meaningful way, correlations within this coarse-grained vector field might illuminate details about solvent structure that density alone could not. Previous methods, such as the “solvent-site” dipole field approach, have employed coarse-grained dipole fields to describe water in biophysical systems with some success.12, 13
Recent theoretical work has laid the groundwork for studying frustrated solvent properties through discrete vector field quantities.14 In this paper, we use this theoretical foundation to study coarse-grained dipole field couplings within a system of biophysical interest. The subtleties of subdividing and calculating the dipole field will be discussed below.
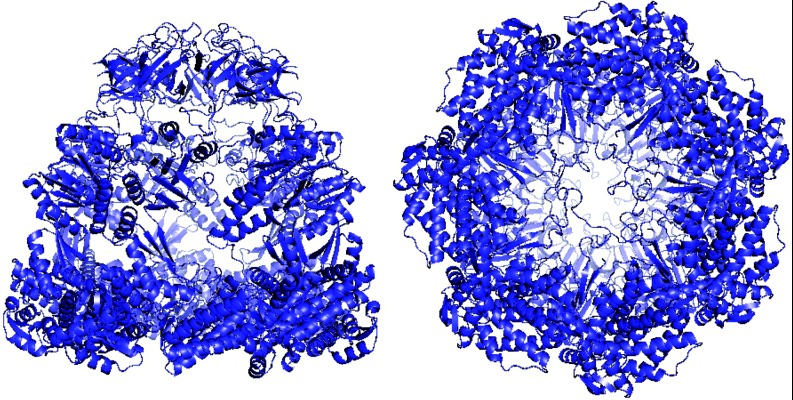
The system we investigate is the above-mentioned bacterial chaperonin GroEL. Figure 1 shows side and bottom views of the GroEL+ES complex, where the GroES subunit serves as a de facto cap for the GroEL folding cavity. Protein chaperones serve the important purpose of preventing aggregation in the cytosolic environment by enclosing a protein substrate in an internal cavity. While traditional theory views chaperonins as capsules that surround proteins and allow for unobstructed folding, increasing evidence suggests that the unique properties of the chaperonin cavity actually work to accelerate protein folding.15
Figure 1.
GroEL/GroES chaperonin complex in its closed state (PDB 1PCQ), viewed from the side (left) and bottom (right). The bioactive complex consists of two stacked GroEL subunits, the cavities of which are capped by GroES during portions of the catalytic cycle. The above images were generated using MacPyMOL.
GroEL is the most extensively studied protein chaperonin, and portions of its overall catalytic cycle have been elucidated.15 The relationship between folding catalysis and the solvent structure within the GroEl cavity, though, remains open for debate.15, 16, 17, 18, 19 It has been suspected that unique solvent characteristics inside the GroEL barrel, mediated by the structure and charge of the interior wall, play a role in facilitating refolding of its substrates. Recent work, however, suggests a new interpretation concerning whether or not the chaperonin wall's charged residues promote folding catalysis.19 To weigh in on this debate, we perform a dipole field analysis on the GroEL interior and probe solvent properties within the chaperonin cavity. We also characterize dipole correlations in nine previously studied GroEL mutants that will help relate observations of solvent structure to experimental data on chaperonin function.17
METHODOLOGY
Performing the higher-order analysis discussed above consists of several steps: (1) collecting molecular dynamics data, with explicitly represented water, on a system of interest; (2) overlaying these data with a three-dimensional grid; (3) computing physically relevant vector quantities at each grid point; and (4) analyzing correlations between the resulting discrete vector fields.
As discussed previously, a dipole moment field serves as a reasonable choice for a vector quantity, as the dipole moment encodes comprehensive spatial information about a system's charges. Formally, the dipole moment p(r) for a charged system can be calculated at any position r using the following equation:
| (3) |
where ρ(r0) represents the charge distribution for a system of volume V. In the case of a system consisting of N point charges, this equation reduces to
| (4) |
where qi and ri are the charge and position of the ith particle, respectively. For a system that is overall neutral in charge, the dipole moment can be shown to be a constant with respect to the position r. In practice, however, particles in charged systems (especially in the condensed phase) experience a considerable amount of shielding from other charged particles. Distant regions of a system, thus, have only an indirect impact on local behavior.
One thus might imagine dividing a system into a number of smaller subsystems, where charges in one subsystem are largely shielded from those in others. By calculating independent dipole moments for each of these divisions, one could use relationships within this new dipole vector field to probe local properties and study coarse-grained interactions in the system at large. Here, we follow this prescription to investigate large-scale solute/solvent interactions in our system of interest. This protocol is similar in spirit to that adopted by those using the “solvent-site” dipole field approach, in which individual water molecule dipoles are “reassigned” to grid points in a system.12, 13 The method we employ, however, is agnostic to the properties of individual water dipoles, and we calculate dipole moments from the general formula for point charges (Eq. 4). This difference provides greater flexibility in choosing an appropriate coarse-graining radius in our analysis, and trivializes dipole calculations for the more complex chemical moieties in the chaperonin structure.
In choosing the size of subsystems such that neighboring systems are relatively shielded from one another, we rely on a crude estimate from a quantity called the Bjerrum length. Derived from the linearized Poisson equation, the Bjerrum length, λB, is given by
| (5) |
where qi and qj are the magnitudes of an arbitrary charges i and j, ε0 is the vacuum permittivity, and εr is the dielectric constant for the system. Put simply, the Bjerrum length represents the distance at which two charges interact with energy comparable to the thermal energy kT. Charged particles are effectively shielded from other particles beyond this separation, as such interactions become indistinguishable from interactions with the bath.20
In a typical molecular dynamics force field, atomic partial charges range between 0 and 1 (in units of elementary charge), with the majority of charges being at or below 0.5e. Given a water-like dielectric constant and a temperature T ≈ 300 K, we can calculate an average Bjerrum length for our systems using Eq. 3; this length turns out to be approximately 3 Å. We choose to set the grid point separation for this study at this average value of 3 Å. While this estimate is rough (as interactions between more highly charged particles will extend beyond this average range), this uniform choice for subsystem separation allows for a meaningful interpretation of the coarse-grained system. Interestingly, the first peak in water's oxygen-oxygen radial distribution function is also found at roughly 3 Å, suggesting this dipole field analysis will occur at a near single molecular level.
To proceed with our methodology, we overlay separate molecular dynamics (MD) data frames with 3 Å grids and calculate the dipole moment vector at each lattice point, only including charges within a 3 Å radius of a particular grid point's location. With a coarse-grained dipole representation of the system in hand, we next turn to statistical methods for extracting information from this vector field. In particular, we are interested in relationships between dipole vectors that indicate structure or orientation differences in local environments. Vector correlation functions provide a convenient avenue for probing such properties. For two arbitrary vector fields ψ and ϕ, the spatial cross-correlation function at distance r is given by
| (6) |
where the sum is restricted to vectors that are a distance r apart. The value N represents the number of field points separated by r that are included in the average. With our system represented on a three-dimensional grid, we calculate distances using the Manhattan metric and compute correlations only at unit values of the lattice spacing.14
An estimate for a correlation length in a system is useful for quantifying and comparing different correlation properties. Here, we make an exponential approximation to estimate the correlation length: the correlation function magnitude is fit to the two-parameter equation
| (7) |
with the method of least squares, where A is the amplitude of the function and ξ represents the correlation length.
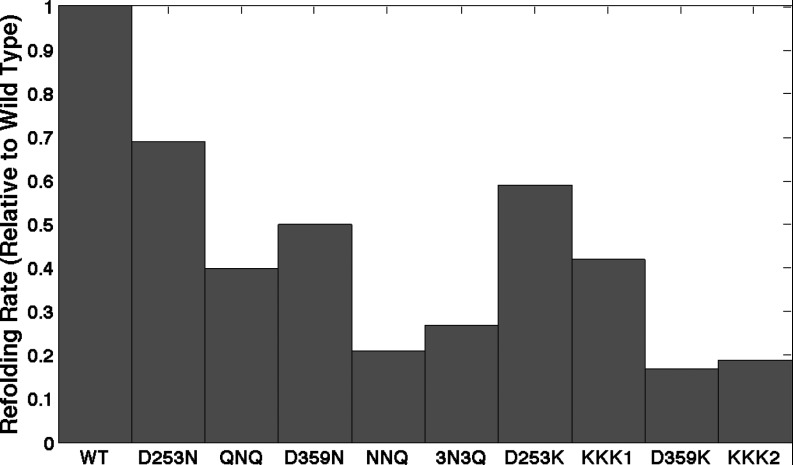
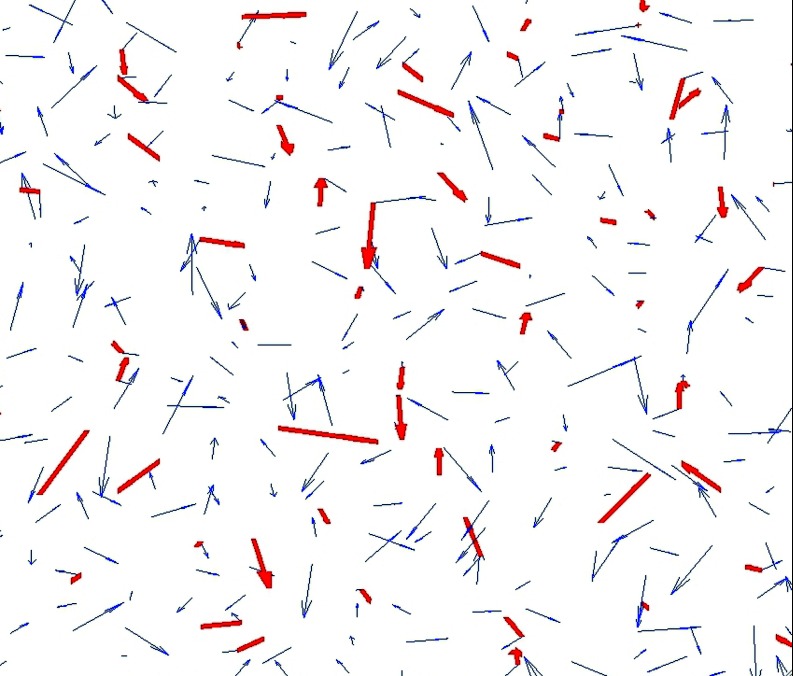
Molecular dynamics data for the wild type GroEL+ES complex in its closed state and nine different GroEL mutants were adapted for use from a previous study; the specifics for the simulation setup and production can be found in Ref. 9. GroEL mutants were chosen based on an experimental assay for refolding rate catalysis in a double mutant of maltose binding protein (DM-MBP). Information on the specific nature of each of these nine mutants can be found in Ref. 17. The refolding rates induced by all complexes with the enclosure of DM-MBP, relative to the wild type, are shown in Figure 2. MD snapshots taken at 50 ps intervals were overlaid with the 3 Å grid, and dipole moment vectors were calculated at each grid point using partial charges from the Amber 2003 force field and the Tip4P-EW water model. Separate chaperonin and solvent dipole fields were calculated at each lattice position, where only water atoms contributed to the solvent field and only non-water atoms to the chaperonin field. Figure 3 shows a close-up view of these two vector fields near the interior wall of the chaperonin.
Figure 2.
Refolding rates of various mutant GroEL complexes, as reported in the literature.17
Figure 3.
Close-up view of chaperonin (red, bold) and water (blue) dipole vector fields near the interior chaperonin wall. Cross-correlations were computed between these two vector fields.
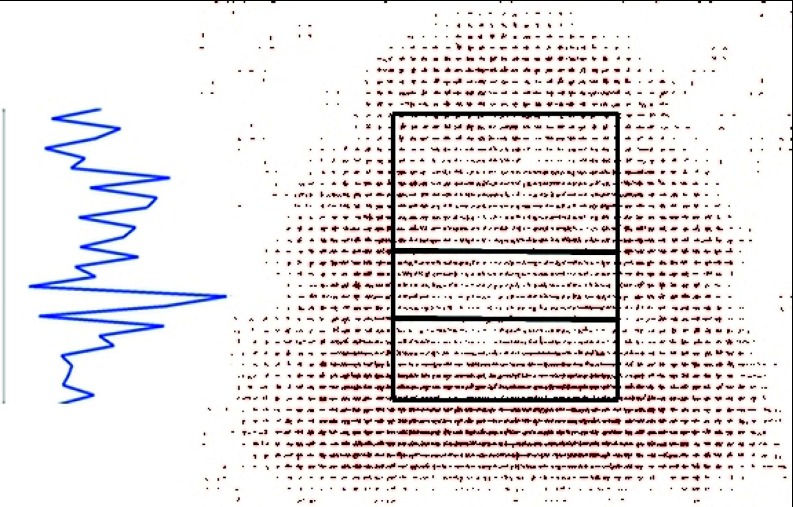
To analyze cross-correlations between the chaperonin and solvent fields, we first restricted our analysis area to the interior cavity of the chaperonin. Cross-correlation functions were then calculated on planes with a constant vertical grid coordinate, from the top of the cavity to the bottom, at each unit of the grid spacing. Figure 4 shows the full chaperonin dipole field used for analysis, with the water field omitted for clarity. For later reference, the z-coordinate ranges from the top to the bottom of the figure. The bold-bordered box overlaid on the grid indicates the analysis area for which chaperonin elements were included in the correlation function calculation. These z-dependent cross-correlation functions were averaged over all MD frames, and correlation lengths were calculated from the averaged functions. We are left with a description of the correlation length within the chaperonin cavity as a function of the vertical coordinate. The plot at left in Figure 4 illustrates how a relative correlation length might relate to position within the cavity. Since references to the aforementioned mutant GroEL subunits will be important, the bold horizontal lines within the box indicate the approximate location (in z) of residues mutated in the nine non-wild type complexes. For all but one mutant, mutagenesis (on one to three residues) was carried out at only one of the indicated vertical coordinates.9, 17
Figure 4.
Dipole vector field representation of GroEL/GroES chaperonin complex. The dipole field corresponding to the system's water molecules is omitted for clarity. Cross-correlation functions were computed over the area surrounded by the black box at increments of one grid spacing in the vertical direction. The two interior horizontal lines mark the approximate locations of mutations carried out in the nine mutant GroEL complexes. The plot at left illustrates how the relative correlation length would be projected onto the vertical coordinate.
After calculating the correlation length versus z for the wild type and each of the nine mutants, correlation properties were compared among the ten datasets. To suggest relationships between these correlations and chaperonin function, data were also compared to experimentally measured DM-MBP refolding rates for each complex.17
RESULTS AND DISCUSSION
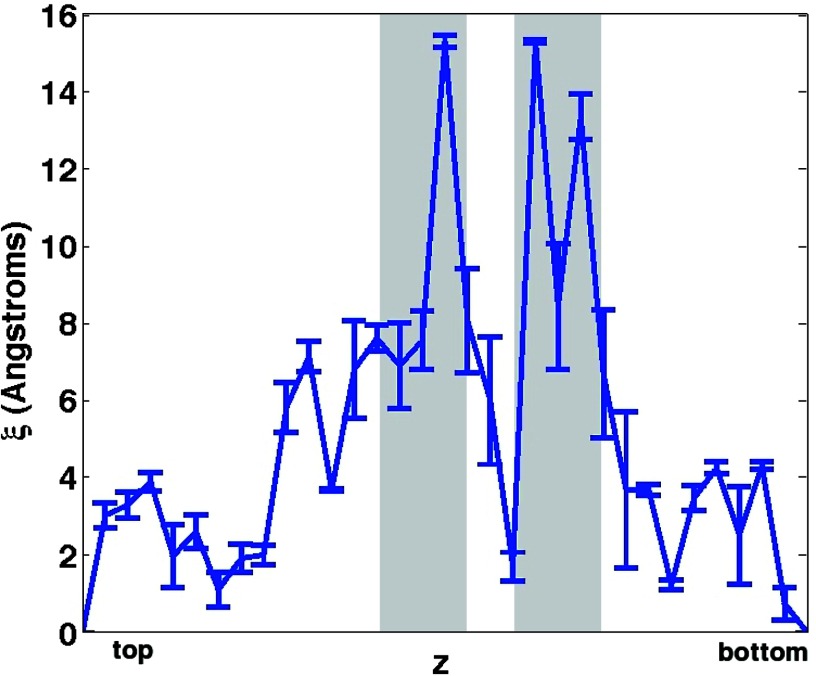
A plot of the chaperonin/solvent dipole field cross-correlation length, as a function of z, can be found in Figure 5 for the wild type complex. Error bars, which were calculated using a bootstrapping method from the data, represent 95%-confidence intervals for the data means. As can be seen from the figure, diversity exists in the cross-correlation length up and down the interior of the chaperonin cavity. In some areas, correlations reach to only 2 Å, the approximate size of a single water molecule. In other regions, however, correlations extend well beyond 1 nm into the GroEL cavity. Such a large variation in correlation length suggests that a rich electrostatic environment exists in the chaperonin cavity, wherein chaperonin residues manipulate water structure at nanometer length scales in some areas and leave water largely unperturbed in others. We should also note that correlations are most pronounced in the “mutation regions” indicated by the grey boxes in Figure 5, within which negatively charged residues are prominent in the wild-type complex.
Figure 5.
Mean chaperonin/water cross-correlation length as a function of the vertical coordinate for the wild-type complex. Error bars represent 95%-confidence intervals estimated using a bootstrapping method over the all frames analyzed. The grey boxes (placed at ±6 Å from the two interior horizontal lines shown in Figure 4) indicate the full “mutation regions” used for later analysis.
Similar correlation lengths were calculated for each of the nine mutant GroEL complexes; the differences between the wild type and the mutant correlation lengths are shown in Figure S1 in the supplementary information.21 The plots in Figure S1 are restricted to the two mutation regions shown in grey in Figure 5. One complex, 3N3Q, is mutated at a total of six residues located in both the upper and lower sites.
The mutations carried out in the nine complexes share a common theme: negatively charged residues were changed to neutral or positive residues, partially neutralizing the walls of the chaperonin cavity. Figure S1 illustrates that, in many instances, these neutralizing mutations drastically decreased residue-water correlations compared to the wild type, in the most marked cases reducing the correlation length by over 12 Å. Somewhat anomalously, the correlation length is also enhanced by 6 Å–12 Å in portions of two lower-site mutant cavities. These perturbations to solvent structure, over a length scale comparable to that of several water molecules, demonstrate a considerable change in the solvent environment in mutant cavities compared to the wild type cavity.
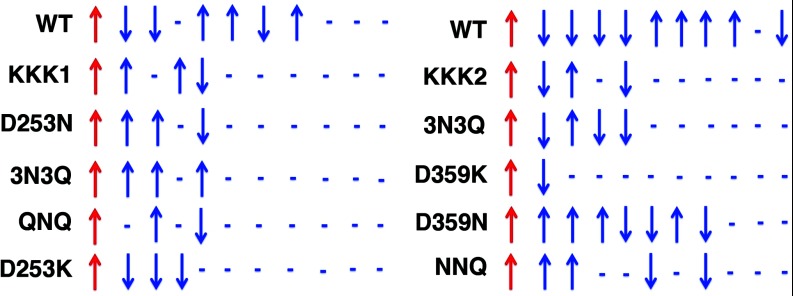
To probe how the chaperonin wall impacts specific elements of solvent structure, we need to look beyond the correlation length and examine the full correlation functions. Sample correlation functions for the wild type and mutant complexes, again separated by lower-site (right) and upper-site (left) mutants, are shown in Figure S2 of the supplementary information.21 These particular functions were taken from the coordinates marked by the vertical dashed lines in Figure S1. While one can observe from Figure S2 that mutant correlations generally decay more quickly than those seen in the wild type, the meaning of the correlation functions is difficult to parse with just a brief visual inspection. To aid in understanding these data, Figure 6 provides a schematic illustration of the various cross-correlation functions. These pictographs were created using the following rules: (1) correlations of 1% or less were deemed insignificant, and are indicated by dashes at the appropriate unit distances; (2) significant positive correlations are indicated by upward arrows; and (3) significant negative correlations are indicated by downward arrows. In all cases, the first arrow indicates the (arbitrary) upward orientation of the chaperonin dipole field.
Figure 6.
Schematic representation of chaperonin-solvent correlation functions from Figure S2. Correlations below 1% were deemed insignificant and are indicated by dashes. Blue arrows indicate, on average, the relative orientation of the solvent dipole field to that of the chaperonin. As is clear from the illustration, these mutations act to both decrease the chaperonin/solvent correlation length and change the local structure of the water dipole field.
These arrows specify, on average, how the solvent structure in the cavity (as represented by the water dipole field) changes with increasing distance from the chaperonin wall. One can again see from the schematic that correlations decay more quickly in the mutant complexes than in the wild type. One should also note, however, how mutations alter the average orientation of the dipole field. In many cases, as with 3N3Q at left or D359N at right, the mutation induces a complete inversion of solvent structure at grid points nearest to the chaperonin dipole field. Solvent structure is retained in other instances (as with D253K, at left), but correlation length is still significantly reduced.
We can see, thus, that these mutations not only diminish correlations between the chaperonin and its enclosed solvent, but also drastically change how solvent inside the cavity is ordered near the chaperonin surface. As indicated by Figure 2, all mutations were shown to inhibit the function of the chaperonin relative to the wild type. But can our dipole field analysis predict the extent to which a given mutation will diminish the complex's function?
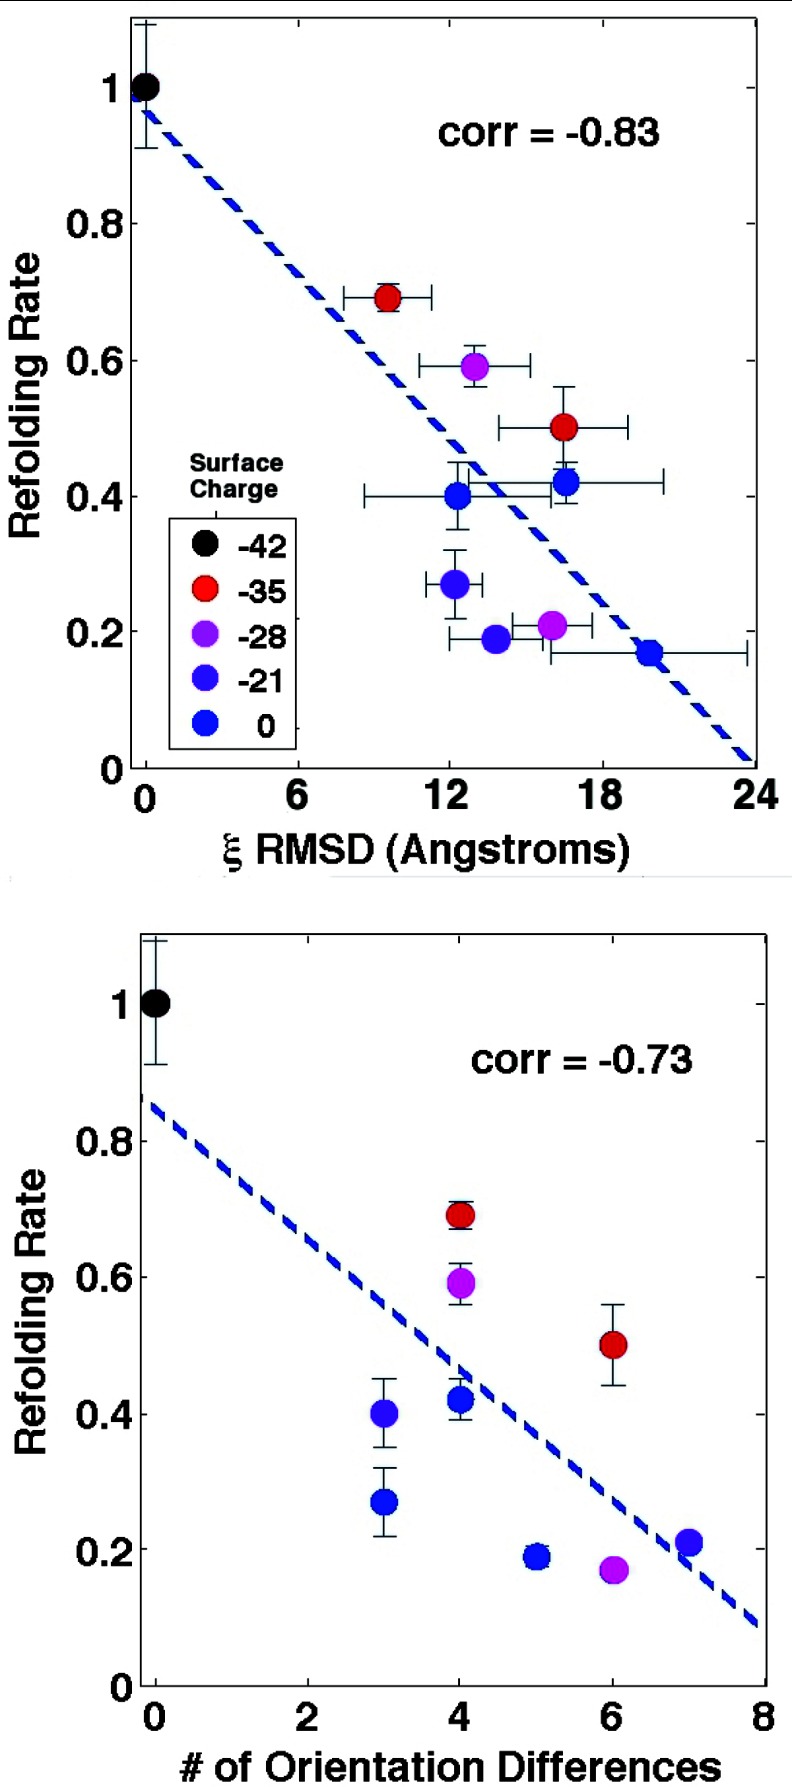
Figure 7 plots the relationships between relative refolding rate and two quantities derived from dipole field cross-correlations. At top, we see that the root mean square deviation of the correlation length from wild type (calculated over the “mutation regions” shown in Figure 5) is strongly anti-correlated with the refolding rate. In fact, the correlation coefficient derived here (correlation = −0.83) indicates a stronger correlation than that estimated from pure water densities (correlation = 0.78) in previous work.9 This observation further corroborates the idea that a dipole field analysis is akin to a “second-order” term that captures important structural details that density alone cannot.
Figure 7.
Correlation plots indicating the relationship between refolding rate and two different properties. Top: Correlation between refolding rate and the root mean square difference of the chaperonin/solvent correlation length, from wild type. Colors indicate the net cavity surface charge, and standard error bars for both theory and experiment are displayed. Bottom: Correlation between refolding rate and number of orientation differences from wild type in the water dipole field, as counted from Figure 6. Both quantities exhibit a strong anti-correlation with refolding rate, suggesting such differences can serve as predictors of conserved chaperonin function.
In the lower plot, we simply count the differences in average dipole orientations (either upward, downward, or insignificant) between each mutant and the wild type, as illustrated in Figure 6. While the relationship is less convincing, we still obtain a reasonable correlation coefficient (correlation = −0.73) based on simple ternary solvent structure data collected from a single vertical coordinate. This result suggests that GroEL functionality is strongly attuned to the structure of these dipole field correlation functions.
From the perspective of chaperonin function, thus, we see that considerable dipole field correlations exist between the chaperonin and its enclosed solvent, and we observe that changes to these dipole field couplings, with respect to both correlation length and structure, coincide with substantial reductions in refolding efficacy. In fact, changes in these correlation properties serve as reasonable predictors of diminished activity. We argue, thus, that solvent dipole correlations are strongly related to GroEL's catalytic function. But can we estimate how these dipole correlations might affect an actual protein substrate inside GroEL? Based on the nature of dipole-dipole interactions, we can make some general statements about solvent-mediated forces within the cavity.
A derivation for the force between two parallel electric dipoles is included in the supplementary material.21 Qualitatively, parallel dipoles exert a repulsive force on one another, while antiparallel dipoles feel an attractive force. We would accordingly expect that positively correlated dipoles would be repelled by one another (with a force proportional to their correlation), while anti-correlated dipoles would be pulled together.
In a vacuum, this dipole-dipole force scales as 1/r4. In an aqueous environment, however, the scaling of force with distance is muddled, as solvent molecules can play a significant role in mediating forces. Two solvated dipoles are, in essence, separated by a shorter “effective” distance than are two dipoles in vacuum. The nature of the long-range dipole potential in water, and the possible role it plays in the attraction of hydrophobes, has been discussed in recent work by Despa and Berry.4 In lieu of citing a microscopic theory for the solvent-mediated force here, however, we will speculate that dipole correlation provides a measure of the solvent-mediated interaction. Indeed, one might expect that dipole-dipole forces, mediated through solvent, are responsible for the observed dipole correlations themselves. We posit that pairs of dipoles that are similarly correlated feel a similar solvent mediated force, regardless of their true physical separation.
Consider a pair of 10D dipoles with 5% mean correlation. With a 6 Å separation in a vacuum, the two dipoles exert and feel a force of about 10 pN. Looking at the correlation functions in Figure S2, however, we see that the approximately 5% correlations observed at 6 Å persist 12–15 Å into the cavity.
Separated by 15 Å in a vacuum, these dipoles would feel a mutual force of only 0.3 pN. Within the aqueous cavity, however, the large dipole correlations suggest an effective separation at some points comparable to this 6 Å distance. Solvent mediation to this degree would imply that 10 pN-magnitude forces extend over a nanometer into portions of the cavity. For reference, a 10 pN force is of sufficient magnitude to break most hydrogen bonds; as such, these forces could certainly impact protein folding processes.
Looking at the structure of the wild-type correlation functions in Figure 6, we see that net attractive forces (indicated by dipole anti-correlations) dominate within several angstroms of the cavity wall. However, we see that both attractive and repulsive forces are also present far into the cavity. At the top site, we observe pronounced anti-correlation at 15 Å, which would again correspond to an attractive force between the dipole and the chaperonin wall. At the bottom location, we see a net positive correlation at 12 Å, meaning a test dipole would be repelled toward the center of the cavity at that coordinate. At 27 Å (very near to the center of the cavity, which is ≈60Å across), we again see significant anti-correlation and attraction to the cavity wall. Since the GroEL cavity is symmetric, however, we would expect this central attractive force to be moderated by radial forces in other directions.
Using the test dipole in analogy to a protein substrate, we suggest that the chaperonin wall would exert attractive forces on a protein at or near the cavity surface. Further into the cavity, we posit that the wall could induce comparable attractive forces near the top mutation site z-coordinate and comparable repulsive forces at the bottom mutation site z-coordinate. Though forces close to the wall generally persist in magnitude in the mutant complexes, the forces often change in direction. Additionally, long-range attractions/repulsions largely disappear after mutation. These observations suggest some connection between folding catalysis and short- and long-range forces induced by the chaperonin surface. Indeed, the chaperonin wall might generate forces that are large enough to push and pull parts of protein substrates throughout the entire folding cavity.
Given these observations, can we weigh in on the recent experimental dispute over surface charge and GroEL function?17, 19 The colors in Figure 7 indicate the surface charge of the wild type and mutant complexes. Based on dipole properties, we see a moderate (but not perfect) correlation between negative charge and loss of function. We do observe that dipole correlations nearly disappear in many charge-reduced mutants, and that this loss of correlation corresponds to a deprecation of function. It is apparent, however, that subtle changes in solvent mediated forces are difficult to predict from just the interior surface charge. From our analysis, one might conclude that negatively charged residues are important for refolding catalysis, but other details of solvent and chaperonin structure are crucial for predicting function.
Interestingly, Motojima et al. suggest that DM-MBP assembly in the KKK2 mutant is dominated by out-of-cage folding, implying the protein substrate does not stay in the chaperonin cavity long enough to fold.19 Our data show that dipole correlations (and concomitant solvent-mediated forces) disappear near the bottom of the cavity with the KKK2 mutation. In the wild type, thus, these forces might play a role in capturing and restraining the protein substrate to allow chaperonin-mediated folding to occur within the cavity.
CONCLUSION
For the chaperonin system analyzed in this paper, dipole field correlations have yielded insight into mesoscopic solvent behavior that would be impractical to obtain from a simple density-based analysis. We have demonstrated that these coarse-grained solvent couplings are strongly related to conserved chaperonin function, and that both correlation lengths and orientations are relevant in refolding catalysis. Furthermore, we have estimated the impact these dipole correlations might have on an actual protein substrate in the folding cavity. In these respects, we consider this work to be a success.
However, prospects for further progress are emerging. For GroEL and other chaperonins, a more extensive analysis of solvent-mediated forces within the folding cavity could provide detailed insight into its catalytic mechanism. One might use this insight to further discriminate between experimental results and make predictions from which experimental design could benefit. As an example, one might try to predict how changes in specific correlations might lead to an improvement in GroEL function. With this knowledge, one could suggest which mutations an experimentalist might perform in hopes of increasing refolding rates compared to the wild type complex. Such an approach could have applications to a number of problems in nanomachinery design.
We also feel this dipole analysis method could have broad applications to other problems in biophysics. The ribosome exit tunnel, in which water exists in a rich and confined environment, comes to mind immediately as a suitable candidate system for study. Undoubtedly, a better understanding of solvent structure on the mesoscopic scale would have applications in many areas of biology.
ACKNOWLEDGMENTS
Special thanks go to Dr. Jeremy England for the use of his wild type and mutant GroEL molecular dynamics data, and for useful comments. We also thank Kevin Dalton for helpful discussion. This work was supported in part by the National Institutes of Health (NIH) (Grant No. R01-GM062868) and the National Science Foundation (NSF) (Grant No. MCB-0954714). J.K.W. was funded by the Fannie and John Hertz foundation on the endowed Yaser S. Abu-Mostafa Fellowship.
References
- Ludwig R., Angew. Chem., Int. Ed. 40, 1808 (2001). [DOI] [PubMed] [Google Scholar]
- Pratt L. R. and Chandler D., J. Chem. Phys. 67, 3683 (1977). 10.1063/1.435308 [DOI] [Google Scholar]
- Huang D. M. and Chandler D., J. Phys. Chem. B 106, 2047 (2002). 10.1021/jp013289v [DOI] [Google Scholar]
- Despa F. and Berry R. S., Biophys. J. 92, 373 (2007). 10.1529/biophysj.106.087023 [DOI] [PMC free article] [PubMed] [Google Scholar]
- Vaitheeswaren S., Rasaiah J. C., and Hummer G., J. Chem. Phys. 121, 7955 (2004). 10.1063/1.1796271 [DOI] [PubMed] [Google Scholar]
- Dill K. A., Biochemistry 29, 7133 (1990). 10.1021/bi00483a001 [DOI] [PubMed] [Google Scholar]
- Cheung M. S., Garcia A. E., and Onuchic J. N., Proc. Natl. Acad. Sci. U.S.A. 99, 685 (2002). 10.1073/pnas.022387699 [DOI] [PMC free article] [PubMed] [Google Scholar]
- Swenson J., Jansson H., and Bergman R., Phys. Rev. Lett. 96, 247802 (2006). 10.1103/PhysRevLett.96.247802 [DOI] [PubMed] [Google Scholar]
- England J. L., Lucent D., and Pande V. S., J. Am. Chem. Soc. 130, 11838 (2008). 10.1021/ja802248m [DOI] [PMC free article] [PubMed] [Google Scholar]
- Kovalenko A. and Hirata F., Chem. Phys. Lett. 290, 237 (1998). 10.1016/S0009-2614(98)00471-0 [DOI] [Google Scholar]
- Stumpe M. C., Blinov N., Wishart D., Kovalenko A., and Pande V. S., J. Phys. Chem. B 115, 319 (2011). 10.1021/jp102587q [DOI] [PMC free article] [PubMed] [Google Scholar]
- Higo J., Sasai M., Shirai H., Nakamura H., and Kugimiya T., Proc. Natl. Acad. Sci. U.S.A. 98, 5961 (2001). 10.1073/pnas.101516298 [DOI] [PMC free article] [PubMed] [Google Scholar]
- Takano N. et al. , Chem-Bio Inf. J. 8, 14 (2008). [Google Scholar]
- Weber J. K. and Pande V. S., J. Chem. Phys. 138, 085103 (2013). 10.1063/1.4792638 [DOI] [PMC free article] [PubMed] [Google Scholar]
- Hartl F. U. and Hayer-Hartl M., Science 295, 1852 (2002). 10.1126/science.1068408 [DOI] [PubMed] [Google Scholar]
- Wang J. D., Herman C., Tipton K. A., Gross C., and Weissman J. S., Cell 111, 1027 (2002). 10.1016/S0092-8674(02)01198-4 [DOI] [PubMed] [Google Scholar]
- Tang Y. C., Chang H. C., Roeben A., Wischnewski D., Wischnewski N., Kerner M. J., Hartl F. U., and Hayer-Hartl M., Cell 125, 903 (2006). 10.1016/j.cell.2006.04.027 [DOI] [PubMed] [Google Scholar]
- England J. L. and Pande V. S., Biophys. J. 95, 3391 (2008). 10.1529/biophysj.108.131037 [DOI] [PMC free article] [PubMed] [Google Scholar]
- Motojima F., Motojima-Miyazaki Y., and Yoshida M., Proc. Natl. Acad. Sci. U.S.A. 109, 15740 (2012). 10.1073/pnas.1204547109 [DOI] [PMC free article] [PubMed] [Google Scholar]
- Micka U. and Kremer K., Europhys. Lett. 38, 279 (1997). 10.1209/epl/i1997-00238-x [DOI] [Google Scholar]
- See supplementary material at http://dx.doi.org/10.1063/1.4801942 for the in-depth derivation of the mutual force between dipoles discussed in the paper along with two supplementary figures.


