

Abstract
Bone Morphogenetic Proteins (BMPs) are growth factors that initiate differentiation of bone marrow stromal cells to osteoblasts and adipocytes, yet the mechanism that decides which lineage the cell will follow is unknown. BMP2 is linked to the development of osteoporosis and variants of BMP2 gene have been reported to increase the development of osteoporosis. Intracellular signaling is transduced by BMP Receptors (BMPRs) of type I and type II that are serine/threonine kinase receptors. The BMP type I a receptor (BMPRIa) is linked to osteogenesis and bone mineral density (BMD). BMPRs are localized to caveloae enriched with Caveolin1 alpha/beta and Caveolin beta isoforms to facilitate signaling. BMP2 binding to caveolae was recently found to be crucial for the initiation of the Smad signaling pathway. Here we determined the role of BMP receptor localization within caveolae isoforms and aggregation of caveolae as well as BMPRIa in bone marrow stromal cells (BMSCs) on bone mineral density using the B6.C3H-6T as a model system. The B6.C3H-6T is a congenic mouse with decreased bone mineral density (BMD) with increased marrow adipocytes and decreased osteoprogenitor proliferation. C57BL/6J mice served as controls since only a segment of Chr6 from the C3H/HeJ mouse was backcrossed to a C57BL/6J background. Family of Image Correlation Spectroscopy was used to analyze receptor cluster density and co-localization of BMPRIa and caveolae. It was previously shown that BMP2 stimulation results in an aggregation of caveolae and BMPRIa. Additionally, BMSCs isolated from the B6.C3H-6T mice showed a dispersion of caveolae domains compared to C57BL/6J. The aggregation of BMPRIa that is necessary for signaling to occur was inhibited in BMSCs isolated from B6.C3H-6T. Additionally, we analyzed the co-localization of BMPRIa with caveolin-1 isoforms. There was increased percentage of BMPRIa co-localization with caveolae compared to C57BL/6J. BMP2 stimulation had no effect on the colocalization of BMPRIa with caveolin-1. Disrupting caveolae initiated Smad signaling in the isolated BMSCs from B6.C3H-6T. These data suggest that in congenic 6T mice BMP receptors aggregation is inhibited causing an inhibition of signaling and reduced bone mass.
Keywords: Image Cross Correlation Spectroscopy, Caveolae, Caveolin, Osteoblast, Mineralization, Family Image Correlation Spectroscopy
1. Introduction
Osteoporosis is a bone disease affecting an estimated 10 million Americans. It is characterized by a “compromised bone strength predisposing to an increased risk of fracture” [1, 2]. Factors influencing osteoporosis and associated fractures are bone strength, rate of bone turnover, structural integrity of the bone, and the largest risk factor - bone mineral density (BMD) [1, 2]. Directing these osteoporotic factors are two cell populations: osteoblasts and osteoclasts. Growth factors such as BMP2 (Bone Morphogenetic Protein 2) and IGF-I (Insulin-like Growth Factor 1) are crucial for osteoblast differentiation. BMP2 is needed for early osteoblast lineage commitment, while IGF-I is necessary for late osteoblast differentiation [3]. Since IGF-I serum levels are decreased in osteoporotic patients and linked to low BMD [4–6], a congenic mouse model with low serum IGF-I was created. The B6.C3H-6T mouse carrying C3H alleles on mouse Chr 6 was made by backcrossing the C3H/HeJ mouse with C57BL/6J mice for ten generations. Previously Chromosome 6 (Chr6) was found to contain the strongest QTL for serum IGF-I between the two strains. The C57BL/6J mice were chosen as a control since only a segment of Chr6 from the C3H/HeJ mouse was backcrossed to a C57BL/6J background [2, 7, 8]. In comparison with (C57BL/6J) femurs, B6.C3H-6T has low serum IGF-I, reduced volumetric BMD, smaller periosteal circumference, decreased trabecular bone volume fraction of the distal femur, decreased osteoblast progenitor cells, as well as increased marrow adipocytes. The age- accelerated phenotype of this mouse at 16 weeks was remarkably similar to B6 mice at 24 months of age [2, 7–9].
BMP2 drives early osteoblast differentiation as well as adipocyte differentiation yet the mechanisms resulting in differentiation of one lineage over the other are unknown [10–14]. BMP2 has been linked to the development of osteoporosis although recent studies have not resolved the genetic link [15, 16]. Analysis of a case-control study of 705 individuals with osteoporosis showed BMP2 as a candidate gene involved in regulating the initiation and/or progression of osteoporosis and variants of BMP2 can almost triple the probability of developing osteoporosis [17]. Furthermore, an independent replication study of two groups of postmenopausal Danish women found comparable results, with a higher incidence of the BMP2 variants in the affected women compared to the controls [17].
BMP2 signaling occurs through serine/threonine kinase receptors, BMP type I and BMP type II receptors. Crucial to BMP2 signaling is the BMP receptor (BMPR) aggregation and co-localization to the distinct plasma membrane domain, caveolae. Caveolae are large, flask-shaped invaginations enriched with cholesterol and Caveolin (Caveolin-1, -2, and -3). Caveolin-1 (Cav-1) is found in two isoforms, alpha and beta. Two caveolae populations have been observed, one enriched in isoforms of Cav1 alpha and beta (Cav1 alpha/beta) and the second enriched in only Cav1 beta [18–20]. BMPRIa is co-localized and activated within caveolae [21, 22]. For the initiation of the signaling pathway BMP2 binds with high affinity to BMPRIa that are localized in caveolae compared to other membrane domains, this leads to BMPRIa aggregation [21, 23]. BMPRIa is then activated by BMPRII and initiates downstream signaling pathways. The most studied is the Smad pathway. Aggregation of BMPRIa is needed for BMP2 signaling to occur [23].
BMP2 is a significant factor for osteoblast and adipocyte differentiation [12]. Its signaling is dependent upon BMPRIa aggregation; however the role of BMPRIa aggregation on low BMD and possibly osteoporosis is unknown. Therefore the B6.C3H-6T mouse model provides a model system with decreased BMD and an osteoporotic phenotype. Using the Family Image Correlation Spectroscopy (FICS) in this manuscript we showed that BMP2 stimulation failed to induce an aggregation for BMPRIa however induced a dispersion of caveolaein BMSCs isolated from the B6.C3H-6T. Further there was increased co-localization of BMPRIa with caveolae at the cell surface of BMSCs isolated from the B6.C3H-6T mice compared to the C57BL/6J (Summarized in Figure 1). The loss of BMPRIa aggregation and increased localization with caveolae resulted in decreased BMP2-induced Smad signaling for the BMSCs isolated from the B6.C3H-6T mice. Disruption of caveolae was able to induce Smad signaling in BMSCs isolated from B6.C3H-6T. Mineralization, a downstream effect from BMP2 signaling [24], was not significantly increased in the BMSCs isolated from the B6.C3H-6T mice, although BMP2 did significantly increased mineralization of the BMSCs isolated from the C57BL/6J. Our results demonstrate the shuttling and localization of BMPRIa at the cell surface facilitates BMP2 induced Smad signaling. The lack of BMPRIa shuttling between caveolae populations or aggregation of BMPRIa results in decreased Smad signaling and mineralization. For the first time a regulatory mechanism of BMPRIa signaling at the plasma membrane of BMSCs is linked to low BMD and an age related osteoporosis congenic mouse model.
Figure 1. Summary of BMP2-induced BMPRIa and caveolae dynamics.

The summary of the plasma membrane dynamics and signaling in response to BMP2 for the BMSCs isolated from the C57BL/6J (left panel) and B6.C3H-6T (right panel). For the C57BL/6J model, BMPRIa is localized to caveolae enriched with Cav1 α and Cav1 β, while some receptors are not localized to these domains (located at the cell surface). The addition of BMP2 decreased CD for BMPRIa. No change was observed for caveolae. The amount of BMPRIa localized to caveolae enriched with Cav1 α or Cav1 β did not change in the C57BL/6J. These dynamics led to increased Smad signaling. For the B6.C3H-6T, BMPRIa is localized predominately to caveolae enriched with Cav1 alpha/beta. There is a small percentage that was not localized to caveolae. BMP2 stimulation led to increased CD for caveolae resulting in increased caveolae. There was no change with the CD for BMPRIa. There was no change in the co-localization of BMPRIa with caveolae. This led to no Smad signaling.
2. Materials and Methods
2.1 Materials
Recombinant BMP2 was obtained from R&D Systems (Minneapolis, MN). The polyclonal goat anti-sera against the BMP receptor BMPRIa, the Alexa 546 red × conjugated donkey anti -goat antibody and Alexa 488 goat anti mouse antibody, mouse antisera against Caveolin alpha and alpha/beta, and siRNA against Cav1 were from Santa Cruz (Santa Cruz, CA). Mice strains C57BL/6J and 6Twere both housed at The Jackson Laboratory and the University of Delaware and protocols were approved by the appropriate Institutional Animal Care and Use Committee (IACUC).
2.2 Isolation and culture of BMSCs
BMSCs were collected from the tibia and femur of 8 week old females of age matched C57BL/6J and B6.C3H-6T congenic mice. The C57BL/6J mice served as controls since only a segment of Chr6 from the C3H/HeJ mouse was backcrossed to a C57BL/6J background [2, 7, 8]. Mice were sacrificed with use of CO2 and hind limbs were removed. In sterile conditions, tibia and femur were cleaned of fat and muscle, and the BMSCs were isolated by removing the epiphyses and flushing the marrow from the bones using a 25 gauge needle and plating media. Cell suspension was then passed through a 70 μm filter and counted and plated to 1.0×10⁶ cells on glass cover slips in 60 mm dishes for imaging or 2.0×10⁷ cells in 35 mm dish for reporter gene assays. Cells were isolated and cultured in minimum essential medium alpha media supplemented with 10% FBS and 1% Penicillin/Streptomycin.
2.3 Immunofluorescence labeling of cell surface receptors
To measure the distribution of the BMPRIa and Caveolin on the cell surface, we employed confocal fluorescence imaging measurements. BMSC from 8 week old donors were grown on 22 mm glass cover slips for 10 days. Cells were serum starved overnight then either stimulated or not with 40nM of BMP2. Cells were fixed by the acetone/methanol method [25]. Cells were incubated for 30 min with 3% BSA to minimize non-specific binding. Cells were incubated with polyclonal goat anti-sera recognizing BMPRIa according to manufacturer's protocol. After the cells were washed three times with PBS, they were incubated again with Alexa 546 red × conjugated donkey anti -goat antibody at a concentration of 20 μg/mL. Cells were labeled again with either anti-mouse Caveolin1 alpha or Caveolin1 alpha/beta for 20 min and washed three times. Lastly cells were labeled with the secondary Alexa 488 goat anti mouse antibody, washed and cover slips were mounted with Airvol [22].
2.4 Image Correlation Spectroscopy and Image Cross Correlation Spectroscopy
Image correlation spectroscopy (ICS) was the technique used to study the distribution and localization of the BMPRs. High resolution and high magnification images were collected by confocal microscopy. ICS involves autocorrelation analysis of the intensity fluctuations within these confocal images, in this case from immunoflourescent labelled proteins [26–28]. From this, the cluster density (CD) was calculated from equation 1 [28].
| (Eq 1) |
Image cross-correlation spectroscopy (ICCS) was the tool used to quantify the extent of co-localization between two proteins. It is based upon the autocorrelation and CD from ICS. The autocorrelation is calculated for each image separately and then the cross-correlation function is calculated from the two images. This represents the average density of clusters in which both proteins localize together. The fraction of one protein co-localizing with the other can be calculated [26, 28]. Sample confocal images show the flat plasma membrane surface that is imaged for BMPRIa and Cav1 alpha (Figure 2). The corresponding autocorrelation and cross correlation functions are shown.
Figure 2. Auto and Cross Correlation Functions of BMPRIa and Cav1 α in B6.C3H-6T.
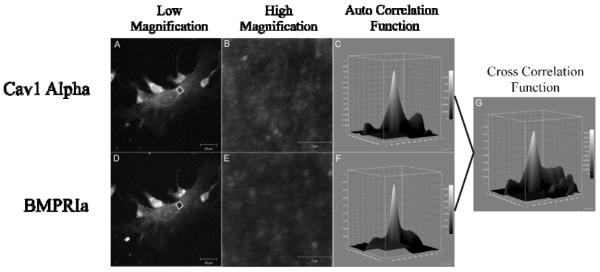
BMSCs were isolated and cultured on glass cover slips. The proteins, BMPRIa and Cav1 α, were labeled with a primary followed by a fluorescent secondary antibody. Images were taken at high resolution of the cellular membrane. Following confocal microscopy ICS and ICCS was performed on the images. A sample image of BMSC isolated from the B6.C3H-6T labeled for (A and B) Cav1 α and (D and E) BMPRIa with the corresponding high resolution image and auto correlation function (C and F). The cross correlation function for ICCS is to the right for the image (G).
In order to calculate the co-localization with ICCS, the proteins of interest are labeled by primary antibody followed by a secondary fluorescent antibody. It is important to note that there are only two antibodies available for Cav1. There is an antibody for both Cav1 alpha/beta and Cav1 beta domains, known in this paper as Cav1 total. A second antibody labels Cav1 alpha populations. Since Cav1 alpha is found only within Cav1 alpha/beta domains, the Cav1 alpha antibody identifies Cav1 alpha/beta domains [18], here the term Cav1 alpha refers to Cav1 alpha/beta domains. There is no antibody specifically available for Cav1 beta, therefore we must use calculations based on the labeling of Cav1 total and Cav1 alpha to identify the dynamics of Cav1 beta. We only use one antibody for the labeling of total BMPRIa at the cell surface.
Using the calculations of ICCS the amount of total BMPRIa co-localized with labeled Cav1 alpha is equal to the amount of BMPRIa co-localized with caveolae enriched with Cav1 alpha/beta. And the total amount of BMPRIa co-localized with Cav1 total is the total amount of BMPRIa co-localized with total amount of caveolae. Since there is only one antibody for BMPRIa and labeling is saturated by this antibody, we can assume the total amount of BMPRIa labeled is the same between Cav1 alpha and Cav1 total labeling. We can therefore infer that the percentage of BMPRIa co-localized with caveolae enriched with Cav1 beta (BMPRIa Cav1 β) is equal to the difference between the percentage of BMPRIa co-localized with Cav1 total (BMPRIa Cav1 total) and Cav1 α (BMPRIa Cav1α) shown in (Eq2).
| Eq2. |
We cannot determine the percent of Cav1 beta co-localized with BMPRIa in the similar manner. This is due to the fact there are two different antibodies used for caveolae labeling. The total amount of labeled Cav1 alpha will not equal the total amount of caveolae and therefore two populations are labeled. These percentages cannot be used in an additive manner. The co-localization of labeled Cav1 alpha with BMPRIa is a true representative for caveolae enriched with Cav1 alpha/beta. The co-localization of Cav1 total is the average percentage of Cav1 alpha/beta enriched domains with BMPRIa (labeled for Cav1 alpha) and Cav1 beta enriched domains with BMPRIa (Eq 3), assuming the number of Cav1 alpha/beta is similar to Cav1 beta. We can then calculate the percentage of Cav1 beta enriched domains co-localized with BMPRIa (Eq 4).
| Eq3. |
| Eq4. |
2.5 Reporter Gene Assays
BMSCs were grown in 35 mm dishes for 10 days, then serum starved over night. Cells were transfected with 2 μg reporter plasmid encoding pSBE (the Smad Binding Element sequence is CAGACAX4) and 2 μg pRL-luc plasmids for normalization. The pSBE is a luciferase reporter plasmid that is responsive to Smad signaling [29]. Cells were transfected with Lipofectamine 2000 from Invitrogen (Carlsbad, CA) according to the manufacturer's instructions. Four hours after transfection, cells were stimulated with 40 nM BMP2 or solution vehicle stimulated. After 12 hours of incubation, cells were washed with PBS, lysed and the luciferase activity was measured using a dual luciferase assay system (Promega, Madison, WI).
2.6 Mineralization
Isolated BMSCs from the tibia and femurs of male and female C57BL/6J and B6.C3H-6T mice were cultured in 24 well plates for 10 days and serum starved overnight prior to stimulation. Von Kossa was performed and quantified as described previously with the exception that cells were only treated with BMP2 (40nM) for 12 days and 15 random images per well per treatment was used for the quantification [30]. Additionally the areas of cells were quantified using ImageJ. The mineralization area was divided by the cell area and normalized to controls. Non-stimulated cells served as controls.
2.7 Alkaline Phosphatase Assay
The supernatant of the plated BMSCs for von Kossa staining was used for the alkaline phosphatase (ALP) assay. The samples were mixed with the assay mixture (10% alkaline buffer solution, 4μM MgCl2, and 1.85 mg/ml of P-nitrophenylphosphate) for one hour at 37° C. Absorbances were measured at 405 nm [31]. The data was normalized to the control.
2.8 Statistics
Mean values and standard error of the mean (SEM) were calculated from the raw data at the 95% confidence level. SEM was used as error bars. Each experiment consisted of 3–5 eight week old female mice. Experiments were performed in triplicates for reporter gene assays and mineralization studies, and duplicates for FICS. For FICS measurements, 40 images of individual cells were taken per experiment. Outliers that were more than three standard deviations from the mean were removed and percent of co-localization was set to 100% when calculations showed over 100%. Student t tests were performed for between treatments for C57BL/6J or B6.C3H-6T. ANOVA followed by Tukey's HSD test was performed for reporter gene assays for the knockdown of Cav1 with the use of siRNA against Cav1.
3. Results
3.1 BMP2 stimulates BMPRIa aggregation at the cell surface of BMSCs isolated from the C57BL/6J mice but does not for the B6.C3H-6T mice
There are decreased number of osteoprogenitors and low BMD in the B6.C3H-6T mice [2, 7, 8]. Since BMP2 is known to regulate BMD, these results suggest BMP2 signaling is inhibited compared to the C57BL/6J mice. The C57BL/6J mice are used as controls since only a segment of Chr6 from the C3H/HeJ mouse was backcrossed to a C57BL/6J background [2, 7, 8]. BMP2 signaling is dependent upon the aggregation of BMPRIa [23]. We recently showed that BMPRIa aggregation is necessary for the initiation of BMP2 signaling. For BMPRIa signaling in A431 cells it was shown that the BMPRIa CD must decrease resulting in aggregation for Smad activation to occur [23]. In order to determine whether BMPRIa aggregation occurs on the plasma membrane of BMSCs isolated from the B6.C3H-6T, image correlation spectroscopy (ICS) was used. ICS is a novel tool to study the aggregation by quantifying the cluster density (CD) of a protein in the plasma membrane [26]. CD is the number of protein clusters per unit area at the cell surface (μm2). Aggregation is showed by a decrease in CD while an increase in CD demonstrates dispersion of the clusters, if there is no change in the protein intensity at the plasma membrane. This shows that a decrease or increase in CD is not due to changes in protein expression at the plasma membrane.
BMSCs from C57BL/6J and B6.C3H-6T mice were isolated and cultured. Cells were stimulated overnight with BMP2 (40nM) or were non-treated to serve as a control. BMPRIa was fluorescently labeled. High magnification confocal images of flat plasma membrane regions were collected and analyzed by ICS. As Figure 3 shows BMP2 stimulation led to a significant decrease in the CD of the BMSCs isolated from C57BL/6J resulting in an aggregation of the BMPRIa. There was no significant change in CD of BMPRIa at the cell surface of BMSCs isolated from the B6.C3H-6T mice.
Figure 3. BMPRIa decreased cluster density in response to BMP2 stimulation for the BMSCs isolated from C57BL/6J mice and no change for B6.C3H-6T mice.

BMSCs were isolated from 8 week old female C57BL/6J and B6.C3H-6T mice and stimulated or not stimulated with BMP2 (40nM). Cells were fixed and labelled for BMPRIa using a polyclonal goat BMPRIa antibody (Santa Cruz) followed by a secondary donkey anti goat Alexa 546 (molecular probes). High magnification images of flat regions of the plasma membrane were collected using a confocal microscope and the CD of BMPRIa was calculated. A) In the C57BL/6J the CD decreased with BMP2 stimulation showing aggregation. There was no change in CD for the B6.C3H-6T mice with BMP2 stimulation. B) The summary of the CD results for BMSCs isolated from the C57BL/6J and B6.C3H-6T. * Indicates significance as detected by one tailed student t test (p<0.05).
3.2 The cluster density of caveolae increased in response to BMP2 for the B6.C3H-6T mouse
The aggregation of the plasma membrane BMPRIa on the BMSCs of the C57BL/6J is similar to previous results using cell lines [23]. Caveolae enriched with Cav1 beta is also known to aggregate in response to BMP2. Since CD of BMPRIa did not change in response to BMP2 in BMSCs isolated from the B6.C3H-6T mice, the CD of the two populations of caveolae was determined from the BMSCs isolated from the C57BL/6J and B6.C3H-6T mice using ICS. The BMSCs were labelled for Cav1 alpha or Cav1 total (both populations of caveolae. Figure 4 shows that the CD of Cav1 alpha and Cav1 total did not significantly change with BMP2 stimulation for the BMSCs from the C57BL/6J mice. There was however a significant increase in the CD for both Cav1 alpha (1.8 fold increase) and Cav1 total (1.3 fold increase).
Figure 4. BMP2 stimulation leads to Caveolin-1 dispersion in BMSCs isolated from B6.C3H-6T mice.

BMSCs were isolated and after 10 days the cells were stimulated or not stimulated with BMP2 (40nM). After fixation cells were fluorescently labeled for A) Cav1 alpha or B) Cav1 total. The Cluster Density (CD), which is the average number of clusters per unit area, was calculated. BMP2 stimulation led to a no significant change in the CD of labeled Cav1 alpha or Cav1 total of the BMSCs isolated from the C57BL/6J mice. Stimulation of BMP2 led to a significant increase in labeled Cav1 alpha domains and Cav1 total domains in BMSCs isolated from B6.C3H-6T mice (p<0.05). C) The summary of the CD results for Cav1 total and Cav1 alpha in the BMSCs isolated from the C57BL/6J and B6.C3H-6T mice.* Indicates significance with one tail student t test.
3.3 Co-localization of BMPRIa with caveolae is increased in the B6.C3H-6T mice
BMPRIa at the plasma membrane co-localize to caveolae enriched with Cav1 alpha and Cav1 beta [22, 23, 32]. Further BMPRIa co-localized to caveolae interacts with BMP2 with increased strength compared to other membrane domains and BMPRIa is activated with in caveolae [21]. In order to determine if these colocalization is different in low peak bone density mice, we determined the co-localization of BMPRIa with the two populations of caveolae was determined for the BMSCs isolated from the C57BL/6J and B6.C3H-6T mice using a unique technique called image cross correlation spectroscopy (ICCS). ICCS quantifies the percent of co-localization between two different fluorescently labeled proteins located at the plasma membrane [27]. Figure 5 shows the amount of co-localization of BMPRIa with Cav1 alpha and Cav1 total. Graphs in Figure 5A represent the raw data from the respective antibodies (alpha or total) and the tables are derived from the graphs (Figure 5B). In the BMSCs isolated from the B6.C3H-6T mice, 82% of BMPRIa co-localized with the Cav1 total and 78% localized to Cav1 alpha. This translated to about 80%of BMPRIa localized to Cav1 alpha and no significant amount localized with Cav1 beta. The addition of BMP2 did not change the co-localization of BMPRIa with caveolae. Although there was increased co-localization of BMPRIa with caveolae in the B6.C3H-6T mice compared to the C57BL/6J mice, 80% and 51% respectively.
Figure 5. Increased BMPRIa co-localization with caveolae in BMSCS isolated from B6.C3H-6T mice.

BMSCs isolated from C57BL/6J (left) and B6.C3H-6T (right) mice and were stimulated after 10 days in culture with BMP2 or not. Cells were fixed and stained for BMPRIa and Cav1 isoforms as indicated. High magnification images were collected and the percent of co-localization was calculated using ICCS. The top panel shows graphs of ICCS data collected. In BMSCs of the C57BL/6J mice, ~51% of BMPRIa co-localized with Cav1 alpha, there was no significant amount of BMPRIa co-localized with Cav1 beta. BMP2 stimulation led to a no significant change in co-localization. The BMSCs isolated from the B6.C3H-6T mice showed 80% of BMPRIa co-localized with Cav1 alpha domains. There was no significant amount of BMPRIa localized with Cav1 beta. BMP2 stimulation led to a no significant change in co-localization. The middle panel shows tables of the calculated percentages of co-localization for BMPRIa with Cav1 alpha or Cav1 beta enriched domains. Since the percentage of BMPRIa co-localized with labelled Cav1 alpha and Cav1 total were very similar (over lapping error bars) these numbers were averaged for the table. The lower panel is the overall trends that were observed for BMPRIa co-localization with caveolae.
Only 54% of the BMPRIa present at the cell surface of BMSCs isolated from the C57BL/6J co-localized with Cav1 alpha and 49% co-localized with Cav1 total. This represents 51% of BMPRIa co-localized with caveolae enriched with Cav1 alpha and no significant amount was found in caveolae enriched with Cav1 beta. The remaining 49% of BMPRIa was not localized to caveolae.
3.4 BMP2 stimulation led to decreased caveolae co-localization with BMPRIa in the B6.C3H-6T mice
There was no change in the co-localization of BMPRIa at the cell surface in response to BMP2 for C57BL/6J, and B6.C3H-6T. There was however increased percentage of BMPRIa that co-localized with caveolae in the B6.C3H-6T isolated BMSCs compared to the C57BL/6J derived BMSCs. Further caveolae were dispersed in the BMSCs isolated from B6.C3H-6T. Using ICCS we next determined the co-localization of Cav1 total or Cav1 alpha with BMPRIa on the isolated BMSCs from C57BL/6J and B6.C3H-6T mice labeled for BMPRIa and Cav1 total or Cav1 alpha. This percentage is distinct from the previous results for BMPRIa co-localized with caveolae in that these results show the percent of the different populations of caveolae that are occupied with BMPRIa.
In the C57BL/6J and B6.C3H-6T mice both caveolae enriched with Cav1 alpha and Cav1 beta co-localized with BMPRIa (Figure 6). It was only in the B6.C3H-6T mice that BMP2 significantly decreased the co-localization of caveolae with BMPRIa. Calculating for Cav1 beta enriched domains showed about 100% of Cav1 beta domains co-localized with BMPRIa and decreased to 66% with BMP2 stimulation (Figure 6). In the BMSCs isolated from the C57BL/6J there was no significant change with the co-localization of caveolae with BMPRIa in response to BMP2 treatment.
Figure 6. BMP2 led to a decrease of Cav1 co-localization with BMPRIa in BMSCs isolated from B6.C3H-6T mice.

BMSCs isolated from 8 week old female C57BL/6J (left) or B6.C3H-6T (right) mice were fixed and stained for BMPRIa and Cav1 isoforms. The top panel is the ICCS graphs. In the isolated BMSCs from the B6.C3H-6T mice, 57% of Cav1 alpha and 55% of Cav1 total co-localized with BMPRIa. BMP2 stimulation led to a significant decrease in the co-localization of Cav1 alpha and Cav1 total. * Indicates significance as detected by one-tailed student t test (p<0.05). In BMSCs isolated from C57BL/6J, ~67% of the Cav1α and ~67% of Cav1αβ co-localized with BMPRIa. Upon BMP2 stimulation there was no significant change in the co-localization for both labelled Cav1 alpha and Cav1 alpha/beta. The middle panel shows a table of calculated percentages of co-localization between Cav1 and BMPRIa. The lower panel illustrates the overall trends that were observed from the graph of Cav1 co-localization with BMPRIa.
3.5 Caveolae regulate Smad signaling
BMP2 is a driving force for the early differentiation of osteoblasts and progenitors, the B6.C3H-6T mice show decreased BMD and osteoporgenitors. Previous studies showed Cav1 alpha enriched domains to be areas for the activation of BMP2-induced Smad signaling pathway while Cav1 beta enriched domains inhibit Smad signaling [22]. In the B6.C3H-6T there were increased amounts of BMPRIa localized with caveolae compared to the C57BL/6J mice. Therefore the transcriptional activation of Smad signaling was determined in the C57BL/6J and B6.C3H-6T with the use of reporter gene assays. The BMSCs isolated from C57BL/6J or B6.C3H-6T were transfected with plasmids encoding the Smad binding element (pSBE) luciferase reporter along with a normalizing renilla reporter (pRLuc). Additionally in the treated cells Cav1 was knocked down using siRNA. In the BMSCs isolated from the C57BL/6J mice BMP2 stimulation led to a significant 9-fold increase in Smad signaling compared to non-stimulated cells (Figure 7A). Disrupting caveolae by knocking down Cav1 in the BMSCs isolated from the C57BL/6J mice inhibited Smad signaling even in the presence of BMP2. In the BMSCs isolated from the B6.C3H-6T mice, BMP2 did not induce Smad signaling (Figure 7B). Although Smad signaling was induced in the absence of BMP2 for the BMSCs isolated from the B6.C3H-6T mice. Knockdown of Cav1 with BMP2 stimulation did not increase Smad signaling in the BMSCs isolated from the B6.C3H-6T mice.
Figure 7. Disruption of caveolae increased Smad signalling in BMSCs isolated from the B6.C3H-6T but not from the C57BL/6J.
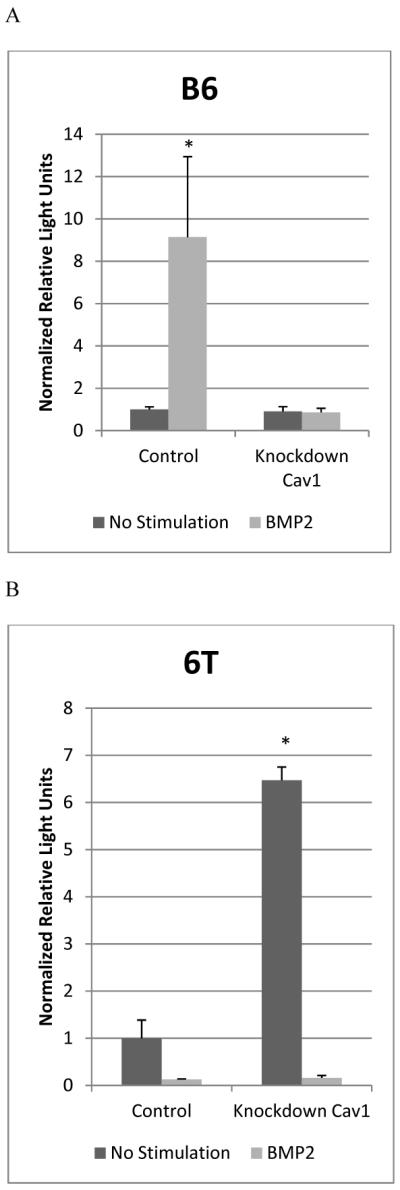
BMSCs isolated from C57BL/6J (A) and B6.C3H-6T (B) female mice were transfected with pSBE or pSBE and siRNA for Cav1, and a plasmid encoding renilla (pRL-luc) for normalization. Cells were non-stimulated (No stimulation) or stimulated with BMP2 (40nM). A) In the BMSCs isolated from the C57BL/6J there was an increase in Smad signalling with BMP2 stimulation. The knockdown of Cav1 blocked Smad signalling. B) In the BMSCs isolated from the B6.C3H-6T, BMP2 did not increase Smad signalling. The knockdown of Cav1 initiated Smad signalling independent of BMP2, but did block the BMP2-induced Smad signalling. * Indicates significance as detected by ANOVA followed by Tukey's HSD test (p<0.05).
3.6 BMP2 stimulation had no effect on mineralization of BMSCs isolated from the B6.C3H-6T
Osteoblast differentiation and mineralization is driven by the BMP2-induced Smad pathway. Since BMP2 did not increase Smad signaling in the BMSCs isolated from the B6.C3H-6T mice the mineralization by these cells were measured by von Kossa staining. Images of stained cells were taken of the mineralization. The cell area and mineralization was quantified using ImageJ.
The BMSCs isolated from the C57BL/6J mice showed BMP2 significantly increases the mineralized area (Figure 8). BMP2 significantly decreased mineralization by the BMSCs isolated from the B6.C3H-6T mice. The mineralization is similar to the activation of the Smad pathway measured by the SBE reporter. Further to identify a decrease in osteoblast differentiation of the BMSCs isolated from the B6.C3H-6T mice, the ALP activity was measured. An alkaline phosphatase (ALP) assay was performed with the supernatant collected. It showed BMP2 induced a significant decrease in ALP activity compared to the control. These results support previously published results with neonatal calvariae and BMSCs that showed decreased ALP, an early marker for osteoblast differentiation [8]. The BMSCs isolated from the B6.C3H-6T cells have decreased BMPRIa shuttling at the cell surface, decreased Smad signaling, and mineralization compared to the C57BL/6J.
Figure 8. BMP2 did not induce mineralization or ALP activity in BMSCs isolated from B6.C3H-6T.

BMSCs isolated from the C57BL/6J and B6.C3H-6T female mice were cultured in 24 well plates for 10 days. Cells were treated with BMP2 (40nM) or left non-stimulated to serve as controls. Cells were stained for mineralization with von Kossa. Images were taken (A). Using ImageJ the mineralized and cell area was calculated. The mineralized area was normalized to the cell area. (B) BMP2 stimulation significantly increased mineralization by BMSCs isolated from the C57BL/6J. There was a significant decrease in the mineralization of the BMSCs isolated from the B6.C3H-6T mice. (C) There was decreased ALP activity measured for the BMSCs isolated from the B6.C3H-6T. * Indicates significance as detected by student t test (p<0.05).
4. Discussion
Early osteoblast differentiation is initiated and directed by BMP2 and the BMP2-induced Smad pathway [33–36]. At the plasma membrane the Smad pathway is regulated by the aggregation of BMPRIa [23]. It has also been shown that BMPRIa co-localize with caveolae, areas were BMP2 binds with BMPRIa with increased affinity and BMPRIa is activated [21, 22]. Further Cav1 beta inhibits Smad signaling [22, 32]. However the role of BMPRIa and caveolae aggregation on low BMD and possibly osteoporosis needs to be determined. Directed treatments at the plasma membrane could be used at novel therapeutics for bone diseases such as osteoporosis.
The congenic mouse model, B6.C3H-6T, has decreased BMD, reduced osteoprogenitors, low serum IGF-I, and increased bone marrow adipocytes, a phenotype characteristic of age-related osteoporosis. Therefore we used this for our plasma membrane study [2, 8]. In this study eight week old age matched females were used for the isolation of the BMSCs that are the early precursors for osteoblasts. As expected from previous studies BMPRIa aggregated at the plasma membrane of the C57BL/6J isolated BMSCs in response to BMP2 treatment [23]. There was no change in the CD of BMPRIa in response to BMP2 for the BMSCs isolated from the B6.C3H-6T suggesting BMPRIa is less dynamic at the plasma membrane compared to the C57BL/6J results. Interestingly the CD for both labeled populations of caveolae (Cav1 total and Cav1 alpha) in the isolated BMSCs from the B6.C3H-6T mice significantly increased, while there was no change in CD for the BMSCs isolated from the C57BL/6J. This suggests that the caveolae at the plasma membrane surface of the isolated BMSCs from the B6.C3H-6T mice respond to BMP2 treatment. It should be noted that although both labeled populations of caveolae increased CD, it is possible that only the Cav1 alpha domains increased the CD while there was no significant change for Cav1 beta domains. This is due to the increased CD for labeled Cav1 total and Cav1 alpha were similar. Additionally, the decrease in the co-localization of caveolae with BMPRIa may be explained by the increase in CD of caveolae. Since there was an increase in CD for the BMSCs isolated from the B6.C3H-6T and no change for the co-localization of BMPRIa with caveolae, the percent of caveolae co-localized with BMPRIa would logically decrease.
Since BMPRIa binds to BMP2, which leads to BMPRIa activation in caveolae [21, 22], the co-localization of BMPRIa with caveolae was determined. ICCS was used to quantify the co-localization between BMPRIa and caveolae. In the isolated BMSCs from the C57BL/6J mice BMPRIa was localized to caveolae, predominately Cav1 alpha domains and non-caveolae regions of the plasma membrane surface. BMP2 did not change the localization of BMPRIa with caveolae, or the percent of caveolae occupied with BMPRIa. Reporter gene assays showed disrupting caveolae by knocking down Cav1 abolished the Smad signal in the presence of BMP2 for the BMSCs isolated from the C57BL/6J mice. This suggests that BMP2 induces Smad signaling by aggregating BMPRIa, but also requires the presence of caveolae.
The isolated BMSCs from the B6.C3H-6T mice showed no significant change in the co-localization of BMPRIa with caveolae. This was similar to the BMSCs isolated from the C57BL/6J mice; however there was increased percentage of BMPRIa that co-localized with caveolae in the BMSCs isolated from the B6.C3H-6T mice. There was close to 80% compared to the roughly 55% of BMPRIa that co-localized with caveolae in the BMSCs isolated from the C57BL/6J mice. Further BMP2 stimulated led to a significant decrease in the amount of caveolae occupied with BMPRIa. Smad signaling was affected for the BMSCs isolated from the B6.C3H-6T mice. BMP2 did not elicit a response in Smad signaling. This could potentially be affecting the osteoblastic differentiation potential and decreasing the osteoprogenitors in the B6.C3H-6T mice. When caveolae were disrupted the BMSCs isolated from the B6.C3H-6T induced Smad signaling independent of BMP2 treatment. Yet with the disruption of caveolae and treatment with BMP2, there was no Smad signal detected. These data suggest that for the B6.C3H-6T BMPRIa are “trapped” within caveolae enriched with Cav1 alpha domains and this inhibits Smad signaling even in the presence of BMP2. Similar results were seen in pulmonary arterial hypertension [37]. BMPRIa is not able to shuttle or aggregate to initiate Smad signaling. The disruption of caveolae allows BMPRIa to be “free” at the plasma membrane surface and be activated by the BMPRII. Further it is interesting to note that there is decreased Wnt 10b expression in the whole bone although there is no significant change in the β catenin expression between the mice strains [8]. The Wnt pathway may also be contributing.
4.1 Conclusion
Aggregation and localization of BMPRs and caveolae are crucial for the activation of the Smad pathway. These data suggest that it is possible that caveolae play dual roles in Smad signaling; one, Cav1 beta inhibits Smad signaling in the absence of BMP2; and two, caveolae are needed to activate the Smad pathway with BMP2 stimulation. The aggregation of BMPRIa in response to BMP2 is required for proper Smad signaling. For the first time a regulatory mechanism of BMPRIa signaling at the plasma membrane of BMSCs is linked to low BMD and an age related osteoporosis congenic mouse model.
Acknowledgments
We thank Lindsay Horton, Harold Combs III, Jane Maynard, Victoria DeMambro, and Dr. Cheryl L. Ackert-Bicknell of the Jackson Laboratory for their guidance and expertise with mice as experimental animals, and Dr. Robert Gundersen for helpful discussions. The majority of the work was performed while BB, JB, and AN were at the University of Maine in the Departments of Biochemistry, Microbiology, Molecular Biology, and Chemical Engineering. This work was supported by AR043618 (WGB) and AR045433 (CJR).
References
- [1].Services USDoHaH . Bone Health and Osteoporosis: A Report of the Surgeon General. U.S. Department of Health and Human Services, Office of the Surgeon General; Rockville, MD: 2004. [PubMed] [Google Scholar]
- [2].Ackert-Bicknell CL, Salisbury JL, Horowitz M, DeMambro VE, Horton LG, Shultz KL, Lecka-Czernik B, Rosen CJ. A chromosomal inversion within a quantitative trait locus has a major effect on adipogenesis and osteoblastogenesis. Ann N Y Acad Sci l. 2007;1116:291–305. doi: 10.1196/annals.1402.010. [DOI] [PubMed] [Google Scholar]
- [3].Crockett JC, Rogers MJ, Coxon FP, Hocking LJ, Helfrich MH. Bone remodelling at a glance. J Cell Sci l. 2011;124:991–8. doi: 10.1242/jcs.063032. [DOI] [PubMed] [Google Scholar]
- [4].Liu JM, Zhao HY, Ning G, Chen Y, Zhang LZ, Sun LH, Zhao YJ, Xu MY, Chen JL. IGF-1 as an early marker for low bone mass or osteoporosis in premenopausal and postmenopausal women. J Bone Miner Metab l. 2008;26:159–64. doi: 10.1007/s00774-007-0799-z. [DOI] [PubMed] [Google Scholar]
- [5].Yakar S, Rosen CJ, Beamer WG, Ackert-Bicknell CL, Wu Y, Liu JL, Ooi GT, Setser J, Frystyk J, Boisclair YR, LeRoith D. Circulating levels of IGF-1 directly regulate bone growth and density. J Clin Invest l. 2002;110:771–81. doi: 10.1172/JCI15463. [DOI] [PMC free article] [PubMed] [Google Scholar]
- [6].Wuster C, Blum WF, Schlemilch S, Ranke MB, Ziegler R. Decreased serum levels of insulin-like growth factors and IGF binding protein 3 in osteoporosis. J Intern Med l. 1993;234:249–55. doi: 10.1111/j.1365-2796.1993.tb00740.x. [DOI] [PubMed] [Google Scholar]
- [7].Bouxsein ML, Rosen CJ, Turner CH, Ackert CL, Shultz KL, Donahue LR, Churchill G, Adamo ML, Powell DR, Turner RT, Muller R, Beamer WG. Generation of a new congenic mouse strain to test the relationships among serum insulin-like growth factor I, bone mineral density, and skeletal morphology in vivo. J Bone Miner Res l. 2002;17:570–9. doi: 10.1359/jbmr.2002.17.4.570. [DOI] [PubMed] [Google Scholar]
- [8].Rosen CJ, Ackert-Bicknell CL, Adamo ML, Shultz KL, Rubin J, Donahue LR, Horton LG, Delahunty KM, Beamer WG, Sipos J, Clemmons D, Nelson T, Bouxsein ML, Horowitz M. Congenic mice with low serum IGF-I have increased body fat, reduced bone mineral density, and an altered osteoblast differentiation program. Bone l. 2004;35:1046–58. doi: 10.1016/j.bone.2004.07.008. [DOI] [PubMed] [Google Scholar]
- [9].Akeson EC, Donahue LR, Beamer WG, Shultz KL, Ackert-Bicknell C, Rosen CJ, Corrigan J, Davisson MT. Chromosomal inversion discovered in C3H/HeJ mice. Genomics l. 2006;87:311–3. doi: 10.1016/j.ygeno.2005.09.022. [DOI] [PubMed] [Google Scholar]
- [10].Moerman EJ, Teng K, Lipschitz DA, Lecka-Czernik B. Aging activates adipogenic and suppresses osteogenic programs in mesenchymal marrow stroma/stem cells: the role of PPAR-gamma2 transcription factor and TGF-beta/BMP signaling pathways. Aging Cell l. 2004;3:379–89. doi: 10.1111/j.1474-9728.2004.00127.x. [DOI] [PMC free article] [PubMed] [Google Scholar]
- [11].Ponce ML, Koelling S, Kluever A, Heinemann DE, Miosge N, Wulf G, Frosch KH, Schutze N, Hufner M, Siggelkow H. Coexpression of osteogenic and adipogenic differentiation markers in selected subpopulations of primary human mesenchymal progenitor cells. J Cell Biochem l. 2008;104:1342–55. doi: 10.1002/jcb.21711. [DOI] [PubMed] [Google Scholar]
- [12].Sottile V, Seuwen K. Bone morphogenetic protein-2 stimulates adipogenic differentiation of mesenchymal precursor cells in synergy with BRL 49653 (rosiglitazone) FEBS Lett l. 2000;475:201–4. doi: 10.1016/s0014-5793(00)01655-0. [DOI] [PubMed] [Google Scholar]
- [13].Hata K, Nishimura R, Ikeda F, Yamashita K, Matsubara T, Nokubi T, Yoneda T. Differential roles of Smad1 and p38 kinase in regulation of peroxisome proliferator-activating receptor gamma during bone morphogenetic protein 2-induced adipogenesis. Mol Biol Cell l. 2003;14:545–55. doi: 10.1091/mbc.E02-06-0356. [DOI] [PMC free article] [PubMed] [Google Scholar]
- [14].Chiellini C, Cochet O, Negroni L, Samson M, Poggi M, Ailhaud G, Alessi MC, Dani C, Amri EZ. Characterization of human mesenchymal stem cell secretome at early steps of adipocyte and osteoblast differentiation. BMC Mol Biol l. 2008;9:26. doi: 10.1186/1471-2199-9-26. [DOI] [PMC free article] [PubMed] [Google Scholar]
- [15].Zmuda JM, Sheu YT, Moffett SP. The search for human osteoporosis genes. J Musculoskelet Neuronal Interact l. 2006;6:3–15. [PubMed] [Google Scholar]
- [16].Medici M, van Meurs JB, Rivadeneira F, Zhao H, Arp PP, Hofman A, Pols HA, Uitterlinden AG. BMP-2 gene polymorphisms and osteoporosis: the Rotterdam Study. J Bone Miner Res l. 2006;21:845–54. doi: 10.1359/jbmr.060306. [DOI] [PubMed] [Google Scholar]
- [17].Styrkarsdottir U, Cazier JB, Kong A, Rolfsson O, Larsen H, Bjarnadottir E, Johannsdottir VD, Sigurdardottir MS, Bagger Y, Christiansen C, Reynisdottir I, Grant SF, Jonasson K, Frigge ML, Gulcher JR, Sigurdsson G, Stefansson K. Linkage of osteoporosis to chromosome 20p12 and association to BMP2. PLoS Biol l. 2003;1:E69. doi: 10.1371/journal.pbio.0000069. [DOI] [PMC free article] [PubMed] [Google Scholar]
- [18].Fujimoto T, Kogo H, Nomura R, Une T. Isoforms of caveolin-1 and caveolar structure. J Cell Sci l. 2000;113(Pt 19):3509–17. doi: 10.1242/jcs.113.19.3509. [DOI] [PubMed] [Google Scholar]
- [19].Nohe A, Keating E, Knaus P, Petersen NO. Signal transduction of bone morphogenetic protein receptors. Cell Signal l. 2004;16:291–9. doi: 10.1016/j.cellsig.2003.08.011. [DOI] [PubMed] [Google Scholar]
- [20].Thomas CM, Smart EJ. Caveolae structure and function. J Cell Mol Med l. 2008;12:796–809. doi: 10.1111/j.1582-4934.2008.00295.x. [DOI] [PMC free article] [PubMed] [Google Scholar]
- [21].Bonor J, Adams EL, Bragdon B, Moseychuk O, Czymmek KJ, Nohe A. Initiation of BMP2 Signaling in Domains on the Plasma Membrane. Journal of Cellular Physiology. doi: 10.1002/jcp.23032. lAccepted. [DOI] [PMC free article] [PubMed] [Google Scholar]
- [22].Nohe A, Keating E, Underhill TM, Knaus P, Petersen NO. Dynamics and interaction of caveolin-1 isoforms with BMP-receptors. J Cell Sci l. 2005;118:643–50. doi: 10.1242/jcs.01402. [DOI] [PubMed] [Google Scholar]
- [23].Nohe A, Keating E, Underhill TM, Knaus P, Petersen NO. Effect of the distribution and clustering of the type I A BMP receptor (ALK3) with the type II BMP receptor on the activation of signalling pathways. J Cell Sci l. 2003;116:3277–84. doi: 10.1242/jcs.00519. [DOI] [PubMed] [Google Scholar]
- [24].Wang A, Ding X, Sheng S, Yao Z. Bone morphogenetic protein receptor in the osteogenic differentiation of rat bone marrow stromal cells. Yonsei Med J l. 2010;51:740–5. doi: 10.3349/ymj.2010.51.5.740. [DOI] [PMC free article] [PubMed] [Google Scholar]
- [25].Brown CM, Petersen NO. An image correlation analysis of the distribution of clathrin associated adaptor protein (AP-2) at the plasma membrane. J Cell Sci l. 1998;111(Pt 2):271–81. doi: 10.1242/jcs.111.2.271. [DOI] [PubMed] [Google Scholar]
- [26].Nohe A, Petersen NO. Analyzing protein-protein interactions in cell membranes. Bioessays l. 2004;26:196–203. doi: 10.1002/bies.10380. [DOI] [PubMed] [Google Scholar]
- [27].Nohe A, Petersen NO. Analyzing for co-localization of proteins at a cell membrane. Curr Pharm Biotechnol l. 2004;5:213–20. doi: 10.2174/1389201043376931. [DOI] [PubMed] [Google Scholar]
- [28].Nohe A, Petersen NO. Image correlation spectroscopy. Sci STKE l. 2007;2007:l7. doi: 10.1126/stke.4172007pl7. [DOI] [PubMed] [Google Scholar]
- [29].Jonk LJ, Itoh S, Heldin CH, ten Dijke P, Kruijer W. Identification and functional characterization of a Smad binding element (SBE) in the JunB promoter that acts as a transforming growth factor-beta, activin, and bone morphogenetic protein-inducible enhancer. J Biol Chem l. 1998;273:21145–52. doi: 10.1074/jbc.273.33.21145. [DOI] [PubMed] [Google Scholar]
- [30].Bragdon B, Thinakaran S, Moseychuk O, King D, Young K, Litchfield DW, Petersen NO, Nohe A. Casein kinase 2 beta-subunit is a regulator of bone morphogenetic protein 2 signaling. Biophys J. 99:897–904. doi: 10.1016/j.bpj.2010.04.070. [DOI] [PMC free article] [PubMed] [Google Scholar]
- [31].Bragdon B, Thinakaran S, Bonor J, Underhill TM, Petersen NO, Nohe A. FRET reveals novel protein-receptor interaction of bone morphogenetic proteins receptors and adaptor protein 2 at the cell surface. Biophys J l. 2009;97:1428–35. doi: 10.1016/j.bpj.2009.05.061. [DOI] [PMC free article] [PubMed] [Google Scholar]
- [32].Nohe A, Keating E, Loh C, Underhill MT, Petersen NO. Caveolin-1 isoform reorganization studied by image correlation spectroscopy. Faraday Discuss l. 2004;126:185–95. doi: 10.1039/b304943d. discussion 245–54. [DOI] [PubMed] [Google Scholar]
- [33].Crockett JC, Rogers MJ, Coxon FP, Hocking LJ, Helfrich MH. Bone remodelling at a glance. J Cell Sci. 124:991–8. doi: 10.1242/jcs.063032. [DOI] [PubMed] [Google Scholar]
- [34].Zhang YW, Yasui N, Ito K, Huang G, Fujii M, Hanai J, Nogami H, Ochi T, Miyazono K, Ito Y. A RUNX2/PEBP2alpha A/CBFA1 mutation displaying impaired transactivation and Smad interaction in cleidocranial dysplasia. Proc Natl Acad Sci U S A l. 2000;97:10549–54. doi: 10.1073/pnas.180309597. [DOI] [PMC free article] [PubMed] [Google Scholar]
- [35].Lou J, Tu Y, Li S, Manske PR. Involvement of ERK in BMP-2 induced osteoblastic differentiation of mesenchymal progenitor cell line C3H10T1/2. Biochem Biophys Res Commun l. 2000;268:757–62. doi: 10.1006/bbrc.2000.2210. [DOI] [PubMed] [Google Scholar]
- [36].Canalis E, Economides AN, Gazzerro E. Bone morphogenetic proteins, their antagonists, and the skeleton. Endocr Rev l. 2003;24:218–35. doi: 10.1210/er.2002-0023. [DOI] [PubMed] [Google Scholar]
- [37].Jiang Y, Nohe A, Bragdon B, Tian C, Rudarakanchana N, Morrell NW, Petersen NO. Trapping of BMP receptors in distinct membrane domains inhibits their function in pulmonary arterial hypertension. Am J Physiol Lung Cell Mol Physiol l. 2011 doi: 10.1152/ajplung.00300.2010. [DOI] [PubMed] [Google Scholar]