

Abstract
Intervention programs aimed at preventing tobacco use among youth have been shown to be effective in curbing tobacco use onset and progression. However, the effects of even very successful tobacco prevention programs may not always impress policy-makers and lay audiences. Economic analysis potentially strengthens the case. In this paper, we evaluate the cost-effectiveness of a youth tobacco use prevention program which has been translated and implemented in India, a developing country. Although programs like these are inexpensive to implement in the USA, they are even less expensive in India due to low labor costs. Our results show that the costs per quality-adjusted life-year added, due to averted smoking, was $2057, even without including averted medical costs. If we ignore student time, cost-effectiveness improves by roughly 10%. To put the cost-effectiveness of this smoking prevention program into context, it is over 24 times more cost-effective than dialysis in the USA, which costs $50 000 for a life-year.
Keywords: smoking prevention, cost-effectiveness, tobacco, developing country
Background
Intervention programs aimed at preventing tobacco use among youth have been shown to be effective in curbing tobacco use onset and progression (Flay, B. (2009)). However, the effects of even very successful tobacco prevention programs may not always impress policy-makers and lay audiences. This is because tobacco use prevention and cessation are never universally successful. Economic analysis potentially strengthens the case because intervention programs are relatively inexpensive to implement and the health gains per averted tobacco user are very high. Therefore, cost-effectiveness is an important, yet underutilized, tool in exposing the benefits of tobacco use prevention and cessation programs.
Tobacco use prevention programs have been shown to be cost-effective in the USA and other Western countries (Wang et al., 2001; Dino et al.2008). However, tobacco use prevention programs in non-Western countries are far less common. While the benefits of tobacco use prevention and cessation programs may be successfully adapted to developing countries, there are notable differences which affect cost-effectiveness. First, the cost will be lower because intervention costs are mainly composed of ‘time costs’. Time costs represent the value of time devoted to a particular task, in this case teachers, staff, volunteers and community workers who are participating in implementing these programs as opposed to another activity. This is otherwise known as the opportunity cost. Economists typically value the cost of an hour of time at the individual's hourly wage, and wages are far lower in developing countries. Secondly, because tobacco use, particularly cigarette smoking, likely has not ‘peaked’ in developing countries such as India, nor established itself as a social norm, cessation and prevention programs themselves may be more successful. Note that the value placed on human life will vary from country to country and society to society.
In the USA, there have been a few cost-effectiveness studies of tobacco prevention and cessation programs for youths. Wang et al.estimated that their school-based tobacco use prevention program, Project Toward No Tobacco Use, cost $10 348 (2010 dollars) per quality adjusted life-year gained, or $16 246 (2010 dollars) if life-years are not quality-adjusted (Wang et al., 2001). Dino et al.estimated that their school-based cessation program, American Lung Association's Not On Tobacco, cost $443 per life-year gained (Dino et al.2008).
In our study, we show that the project Mobilizing Youth for Tobacco-Related Initiatives (MYTRI) is cost-effective in two cities in India. That is, the cost per life-year added, quality-adjusted or not, is well within any known threshold. Furthermore, our results compare favorably to the aforementioned results from developed countries.
The MYTRI study
Project MYTRI was implemented in the cities of Delhi and Chennai during the period 2004–2006. Project MYTRI was a group-randomized intervention trial that aimed to reduce tobacco use among school-going adolescents in grades 6–9 (Stigler et al.2007; Perry et al.2009). There were intervention and control groups in both cities. Over 14 000 10–16-year-old students in 32 schools participated over 2 years in this project, which was implemented in partnership between the University of Texas School of Public Health and Health Related Information Dissemination Amongst Youth (HRIDAY), a non-governmental organization that works on tobacco control in Delhi, India.
Indian students in the sixth grade are between 11 and 12 years of age, and 50.9% of students in the study were sixth graders at baseline. Forty-three percent of the students were female. School types are an indicator of socio-economic status, with relatively wealthy students attending private schools. Sixty-one percent were enrolled in government (lower socioeconomic status) schools. The students were roughly split between Delhi and Chennai. In the control group, 1.38% (−0.09, 2.85) reported ‘any’ tobacco use versus 3.42% (1.95, 4.89) in the intervention (Perry et al.2009).
The intervention program was based on successful prevention programs that had been implemented in the West (e.g. USA), and appropriately ‘translated’ for use in this setting (Perry et al.2009). The intervention aimed to reduce the prevalence of multiple forms of tobacco use, e.g. chewing tobacco, cigarette smoking and bidi smoking, that are prevalent in India (Reddy and Gupta, 2004). The intervention model addressed both intrapersonal (knowledge, beliefs, meanings and values) and socioenvironmental (social norms, peer influence) factors that are known risk factors for youth tobacco use in India (Stigler et al., 2006). Training for teachers and youth (i.e. peer) leaders was provided at the beginning of each year of this 2-year intervention which was delivered to two cohorts of youth: (i) those in sixth and seventh grades, (b) those in eighth and ninth grades. Throughout each school year, teachers and peer leaders received continued support from the project staff. Materials were developed in multiple languages (Hindi, Tamil and English based on medium of instruction in schools), and included manuals, game boards, game cards and handbooks for the students.
Project MYTRI had four main intervention components. These included classroom activities, behavioral curricula that were delivered through seven peer-led activities in the sixth and eighth grades in 2004–2005, followed by six such activities for seventh and ninth grade students in 2005–2006. Six school posters were provided each year according to the themes of the classroom activities. Posters were hung in classroom and around the schools during a particular activity. Six parent postcards were distributed in the year 2004–2005 and were sent home to parents with the students, after an activity. Finally, peer-led health activism included competitions that were held within and between schools, specific to material covered in classroom activities. In addition, peer leaders were asked to facilitate the implementation of all activities in the classroom, in both years.
All the above components were designed synergistically to achieve maximum impact on tobacco-use risk factors. The intervention lasted for about 4 months each year, with around 15 h of activity each year.
The study outcomes were evaluated using a self-administered survey that was implemented in the classrooms prior to the beginning of the intervention (2004), after year 1 of the intervention (2005) and after year 2 of the intervention (2006). The main outcome measures were self-reported use of cigarettes, bidis and/or chewing tobacco, and intentions to smoke or chew tobacco. Current tobacco use was measured using three binary variables: ‘During the last 30 days, did you chew tobacco in any form?’, ‘During the last 30 days, did you smoke one or more bidis?’, ‘During the last 30 days, did you smoke one or more cigarettes?’. Students who answered yes to one or more of these questions were considered current tobacco users of any tobacco. Multi-item risk factor scales were also created to measure intentions, susceptibility to use tobacco (smoke or chew) as well as other risk factors like beliefs, knowledge, self-efficacy, etc. Further information about these measures is provided in other publications by this research team (Stigler et al.2006). The outcome assessment found that over the 2-year period, students in the control group increased their cigarette and bidi smoking at a rate that significantly exceeded the increase in the intervention group. No significant differences were found for chewing tobacco use between the two groups over the 2 years of the study period (Perry et al.2009).
Methods for the Cost-Effectiveness Study of MYTRI
The chief method we will use is the cost-effectiveness ratio (CER), both quality-adjusted (cost-utility) and not quality-adjusted. We are assessing the incremental CER of the MYTRI intervention versus no intervention in the control. CER captures the dollars per life-year added due to the intervention, which we also quality-adjust in one case. CER allows policy-makers to compare the cost per benefit of one type of intervention, be it medical or public health, to all others. While there is no accepted threshold in any country, the cost of additional life-years added can also be compared to creative indicators of societal willingness-to-pay for those additional life-years. For instance in the USA, anyone needing dialysis is automatically eligible for Medicare reimbursement. This life-sustaining procedure costs at least $50 000 per year and adds a minimum of one life-year, making the cost roughly $50 000 per life-year. Similarly, in India, the estimated cost of peritoneal dialysis per year is approximately $7000, which in turn is about 240% of India's per capita gross national income (Li and Chow, 2001; Sakhuja and Sud, 2003). Therefore, if an intervention such as MYTRI costs less per life-year added, we should be willing to pay for it as well.
Cigarette/bidis smoking progression
Our progression model closely follows the approach developed by Wang et al. (Wang et al. 2001), who projected smoking at 26 years of age based on smoking status at the age of 14. We focus on bidis and/or cigarette smoking, but not chewing tobacco, since MYTRI was successful with these substances. As with Wang et al. (Wang et al. 2001), we split the projection into three stages, from 14 to 18, from 18 to 22 and then from 22 to 26 years of age. Wang et al. defined established smokers to be anyone who had smoked over 100 cigarettes (Wang et al., 2001). However, we do not have data on the amount of cigarettes smoked in stage one, so we defined students reporting current use or ‘ever use’ as experimenters instead. In the second and third stages, established smokers were defined as such based on ‘current use’. This is consistent with the 1994 Surgeon Generals Report (U.S Department of Health and Human Services (1994). As in their progression model, we first projected the likelihood of becoming an experimenter during the MYTRI trial.
As in Wang et al. (Wang et al. 2001), our Markov chain model assumes that once you are an established smoker at any of the three stages between 14 and 26 years of age, you are an established smoker henceforth (for the rest of your life). This ensures that our projection is conservative, not assuming that smoking cessation subsequent to the trial is due to the trial. Experimenters at the end of the trial (stage one) can either remain experimenters or become smokers during any of the three stages. Non–smokers at the end of the MYTRI trial can either become experimenters, remain non–smokers, or become established smokers.
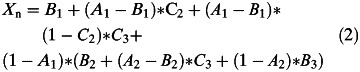
Following Wang et al. (Wang et al. 2001), the following five equations describe our smoking progression model. The terms of the equations are defined in Table 1. Subscript i is for intervention, while subscript c stands for control; subscript e stands for established smoker, while subscript n is for nonsmoker. Equation (1) captures the probability of three-stage progression towards being an established smoker at 26 years of age, given experimentation at age 14; equation (2) captures the probability of three-stage progression towards being a non-smoker at 26 years of age, given no experimentation at age 14. Equation (3) provides the number of estimated established smokers at age 26 in the intervention group, and equation (4) provides the same estimate for the control group. Note that the control group in equation (4) is ‘pro-rated’ to the number of people in the intervention, N= 6365. Of course, equation (5) is the estimated number of averted established smokers due to the intervention. Equations (1) and (2) are inserted into equations (3) and (4).
| (1) |
 |
| (3) |
| (4) |
| (5) |
Table 1:
Data and conditional probabilities used in the cigarette/bidis smoking progression model
| Parameter definition | Symbol | Estimate | Range | Sources |
|---|---|---|---|---|
| Students who had initiated smoking by age 14, intervention | Pi | 0.08 | −2.8–3 | Perry et al., 2009 |
| Students who had initiated smoking by age 14, control | Pc | 1.3 | −1.64–4.24 | Perry et al., 2009 |
| Non–smokers at age 14 initiating smoking by age 18 | A1 | 41.4 | 37.9–45.1 | Bruvold, (1993) |
| Non–smokers at age 18 initiating smoking by age 22 | A2 | 35.5 | 30.7–40.4 | Bruvold, (1993) |
| Non–smokers at age 14 becoming smokers by age 18 | B1 | 8.1 | 6.2–10.3 | Bruvold, (1993) |
| Non–smokers at age 18 becoming smokers by age 22 | B2 | 3 | 1.6–5.2 | Bruvold, (1993) |
| Non–smokers at age 22 becoming smokers by age 26 | B3 | 1 | 0.5–1.5 | Assumption (range) |
| Experimenters at age 14 becoming smokers by age 18 | C1 | 16.2 | 8.1–24.3 | Assumption (range) |
| Experimenters at age 18 becoming smokers by age 22 | C2 | 6 | 3.0–9.0 | Assumption (range) |
| Experimenters at age 22 becoming smokers by age 26 | C3 | 2 | 1.0–3.0 | Assumption (range) |
Assumption corresponds to Wang et al. (Wang et al., 2001)
Figure 1illustrates the progression model from equations (1) through (5) based on Wang et al. (Wang et al. 2001).
Fig. 1:

Progression of smoking behavior model (Markov chain).
Table 1lists the conditional probabilities used in equations (1) through (5) and their sources. The conditional probabilities are typically the probability of smoking at age X, given that you did (or didn't) smoke at an earlier age. The first two parameters come from the MYTRI trial itself (Perry et al.2009). Note that the other parameters follow Wang et al. (Wang et al. 2001), but we list their primary source. The 95% confidence limits are also provided in Table 1.
Life-years added, quality adjustment
The number of life-years added due to averted smoking is due to Dino et al. (Dino et al. 2008). However, the primary source is Rogers and Powell-Griner (Rogers and Powell-Griner 1991). Averting smoking adds 7.2 life-years at age 26. In all cases, we would have preferred to have had access to conditional probability data from Indian subjects. However, life tables and conditional probabilities require long cohorts on smoking. The lack of availability necessitated the use of data from the USA. However, lifetime patterns of tobacco use are unlikely to differ greatly due to the addictive nature of nicotine.
We applied a ratio on quality adjustment as in Wang et al. (Wang et al. 2001). They had used the recommendations based on Cromwell et al. (Cromwell et al. 1997).
Costs
Cost information for the 2-year intervention was collected from the research team at HRIDAY in Delhi, India. All costs were provided in terms of 2006 US dollars. Cost of implementing the intervention in 16 schools over 2 years were included in the calculations.
As shown in Table 2, there are two major components of cost for Project MYTRI. There were the costs for training project staff and school teachers, and the costs for implementation. In both these categories, personnel time costs were also included. Student time costs were included, for peer leaders who participated in training (see the left side of Table 2) and for all students who joined intervention activities (see the right side of Table 2), at a cost of 20 cents per hour by assumption. The cost-effectiveness analysis was conducted both with and without including student time costs, as shown in Table 2.
Training costs included time costs for personnel as well as other training costs (Table 2). Time costs were factored in for Project MYTRI staff (community coordinators, research staff, other project staff, project directors) as well as school teachers and student peer leaders who participated in training workshops over the 2 years, both in Delhi and Chennai. Intervals in brackets indicate that the range of wages paid over the 5 years of MYTRI, although the the intervention being analyzed was only 2 years, in 2004 dollars. Ranges are used in the sensitivity analysis, as explained below. Other training costs included the travel costs for personnel (both intra-city and inter-city travel), venue rental costs and other workshop costs, such as refreshments, training materials and supplies. These costs totaled to $32 318 for 16 schools (or $2020 per school), including peer leader time; after excluding the latter, the training costs totaled to $23 486 for 16 schools (or $1468 per school).
Implementation costs include the costs for time spent by various personnel involved in implementation activities as well as other costs for implementation (Table 2). Personnel costs include time spent by project staff, school teachers, peer leaders and other students who were engaged in the activities. Other implementation costs were related to various materials that were developed over the 2 years of the intervention and disseminated in the 16 schools in both Delhi and Chennai. The costs for implementation of Project MYTRI over 2 years were $144 282 for 16 schools (or $9018 for one school); after excluding student time the implementation costs were $116 174 for 16 schools (or $7261 for one school).
Thus, the total costs for Project MYTRI over 2 years for 16 schools in Delhi and Chennai were $181 564, or $155 059 excluding student time costs.
Sensitivity analysis
Our smoking progression model was subject to a sensitivity analysis. Our sensitivity analysis differed from Wang et al. (Wang et al. 2009) in that we used the triangle distribution with the support bounded by the 95% confidence interval. Each parameter in Table 1was drawn simultaneously from a triangle distribution randomly. One thousand draws were made, enabling a distribution to be constructed.
Because the confidence limits for Piand Pcpartially overlap, as shown in Table 1, roughly one-quarter of the drawings reveal that smoking experimentation was lower in the control than the intervention. We excluded outlier draws where CER or CEA was above $100 000 or was below −$100 000, which occured 12 times in 1000 draws.
Results
Table 3shows the results. Our tobacco use progression model show that ∼12 people were projected to avert tobacco use by age 26 due to MYTRI. At 2.88 life-years added per averted tobacco user, this translates into 35 life-years added due to MYTRI. If we quality-adjust, 54 life-years are added due to MYTRI.
Table 2:
Costs of the MYTRI intervention
| Training |
Implementation |
||||||||
|---|---|---|---|---|---|---|---|---|---|
| Type of personnel | Total no. of personnela | Hourly wage in USDb | No of hours | No. of workshops in 1 year | Total no. of hours spent per yearc | Total costs | Total no. of personnela | Number of hours spent per yeara | Total cost |
| Teachers, Delhi | 35 | 5.28 [3.78–6.79] | 6 | 2 | 12 | 4436 | 70 | 7 | 5175.39 |
| Teachers, Chennai | 35 | 3.64 [.05–7.22] | 6 | 2 | 12 | 3054 | 70 | 7 | 3563.13 |
| Peer Leaders | 46 | 6 | 16 | 96 | 8832 | 742 | 7 | 2077.60 | |
| Community Coordinators, Delhi | 11 | 1.11 [1.04–1.18] | 6 | 9 | 54 | 1319 | 11 | 1.5 | 36.64 |
| Community Coordinators, Chennai | 12 | 1.06 [1.04–1.07] | 6 | 9 | 54 | 1369 | 12 | 1.5 | 38.04 |
| Project Staffd | 7 | 1.55 [1.30–1.79] | 6 | 0 | 0 | 0 | 7 | 1 | 21.65 |
| Project Director (USA) | 1 | 22.00 | 6 | 4 | 24 | 1056 | |||
| Project Director (India) | 1 | 6.55 [6.25–6.85] | 6 | 4 | 24 | 314 | |||
| Research Assistant | 1 | 1.74 [1.63–1.85] | 6 | 12 | 72 | 125 | |||
| Students | 0.2 | 5534 | 7 | 15495 | |||||
| Subtotal | 20506 | 26407.64 | |||||||
| Non-time costse | 16775 | 117875 | |||||||
| Total | 37281 | 144282 | |||||||
| Grand total (training and implementation combined) | 181564 | ||||||||
aCalculated as average of total participants in each category over 2 years as provided by HRIDAY.
bFor teachers, using honorarium. For community coordinators/project staff, using average in each category. Ranges in brackets.
cProduct of no. of hours in each workshop and no. of workshops in each year.
dIncludes Co-investigators, Secretary, Accountants, Administrative Officer.
eTravel and Per diem, venue rentals, materials and supplies, and refreshments.
Table 3:
Cost-effectiveness and cost-utility results
| Variable | Mean | Lower 95% CL | Upper 95% CL |
|---|---|---|---|
| Averted smokers at 26 | 12.04 | 10.97 | 13.12 |
| Cost of intervention | 175438.50 | 175257.68 | 175619.32 |
| Cost of intervention (no student costs) | 157865.70 | 157684.88 | 158046.52 |
| Life-years added per averted smoker, present value | 2.88 | 0.00 | 0.00 |
| QALYs added per averted smoker, present value | 4.52 | 0.00 | 0.00 |
| Cost-effectiveness | 3229.76 | 2111.73 | 4347.78 |
| Cost-effectiveness (no student costs) | 2906.28 | 1900.27 | 3912.29 |
| Cost-utility | 2057.17 | 1345.05 | 2769.29 |
| Cost-utility (no student costs) | 1851.13 | 1210.36 | 2491.90 |
The cost per quality-adjusted life-year added due to averted smoking was $2769, or $2492 if we ignore student time. The cost per life-year added due to averted smoking was $4348. If we ignore student time, cost-effectiveness improves by roughly 10% to $3912. To put this into context, this is approximately two times more cost-effective than peritoneal dialysis in India or over 12 times more cost-effective than dialysis in the USA, where it costs $50 000 for a life-year.
Fig. 2:

Acceptability curve: willingness to pay per QALY gained.
Our sensitivity analysis reveals that our results are not sensitive to any one parameter. The upper bound of our cost-effectiveness estimate remains within any accepted cost-effectiveness ratio. Figure 2shows the acceptability curve.
Medical costs
Note that we do not include medical costs averted, unlike Wang et al. (2001), because of data limitations. If we included male and female discounted lifetime savings in medical costs due to averting smoking [$8638 for men and $10 119 for women (1990 US $)] (Wang et al., 2001), our results would be ‘cost saving’ because averted medical costs exceed the cost of intervention. In other words, there would be negative costs per life-year. However, costs of medical care averted in India would, literally, be a fraction of USA costs.
Discussion
Our results show that the cost-effectiveness of tobacco prevention/cessation programs in the USA (Wang et al., 2001; Dino et al., 2008) translate to India through MYTRI. With MYTRI, the cost per quality-adjusted life-year added due to averted smoking was $2769. If we ignore student time, cost-effectiveness improves by roughly 10% to $2492. In the USA, Wang et al.estimated that their school-based program cost $10 348 (2010 dollars) per quality-adjusted life-year gained, or $16 246 (2010 dollars) if life-years are not quality-adjusted (Wang et al., 2001). Dino et al.estimated that their school based cessationprogram cost $443 per life year gained (Dino et al.2008). It may be that concentrating on smokers through cessation is more cost-effective than spreading prevention resources to students in general.
The purpose of the cost-utility analysis is to compare alternative ways to produce a quality-adjusted life-years, whether through public health interventions medical interventions or regulation (Gift et al., 2003) This allows us to, theoretically, efficiently allocate resources among alternate waysto produce health. Our analysis does this, but also raises questions of whereto allocate resources. Assuming a life-year in India is worth the same as a life-year in the USA, lower time costs due to low wages in India mean that interventions are far cheaper to implement in India. On the other hand, the present value of averted medical cost in the USA in 1990 dollars was $8638 for men and $10 119 for women (Wang et al., 2001). Therefore, averted medical costs are much higher in the USA.
The societal willingness-to-pay for a life-year may be lower in India than in the USA. In the USA, four methods are used to estimate the willingness-to-pay for a life-year: (i) using yearly salary and wage information, (ii) looking at wage differentials for similar jobs where one is riskier (painting the top of a water tower versus the bottom), (iii) looking at the price for safety equipment like side air-bags in automobiles, and (iv) surveys where the question is asked (contingent valuation) about willingness to pay. From a 2001 meta-analysis, the median price per life-year was $265 000, which is over five time the price per life-year due to dialysis. In India, the estimated price per life-year is undoubtedly less.
Although there are no universally accepted criteria for determining which intervention is cost-effective in developed countries, criteria for cost-effectiveness in developing countries are even less widely accepted. Recommendations made by international bodies such as the Commission on Macroeconomics and Health may be used, especially in developing country settings where there is a dearth of evidence on cost effectiveness ratios of different health interventions. The Commission recommends that an intervention that costs less than the respective country's per capita gross domestic product (GDP) may be considered to be very cost effective. In 2008, India's per capita GDP was estimated at $2900. Given that the cost per life year saved by the MYTRI intervention is $3962, the school-based multicomponent model employed by Project MYTRI would not be considered cost-effective. However, given that MYTRI was implemented in urban Indian settings, where wages are higher, then the project was likely cost-effective in urban settings.
In order to make the international comparison more meaningful, we replaced the wages earned in India with US wages in our time cost estimates. The cost of the intervention went up by over five times when student time is evaluated at minimum wage. However, when student time is not included, as in Wang et al.and Dino et al.(Wang et al., 2001; Dino et al., 2008), the cost of the intervention went up by a more modest 1.5 times. When student costs were not included, the cost per quality-adjusted life-year was $10 430.
Our results show that MYTRI is a cost-effective program, costing just $2769 per quality-adjusted life-year. Our smoking progression model was limited by the lack of epidemiological data for tobacco use among Indian youths and adults. For instance, we may be underestimating the addictiveness of bidis in the context of regular use (Hoffman et al., 1974; Pakhale et al., 1990). Our results can thus be seen as conservative. Since there are greater prevention and cessation resources in the West, and stronger non-smoking norms, it is likely that regular smoking may increase in India once initiation has occurred. We do no include medical costs, which would strenthen the results. There are, of course, normal uncertainties about any attempt to project the benefits of tobacco use prevention. These differences may be eroding, however, due to the global treaty on tobacco control. Nonetheless, prevention efforts are needed in developing countries, and MYTRI was one such successful program.
Funding
Financial support for this study was provided by the Advancing Cessation of Tobacco In Vulnerable Indian Youth (Project ACTIVITY,National Institutes of Health RO1 TW007933-01 Reddy (Principal Investigator).
References
- Bruvold W. A meta-analysis of adolescent smoking-prevention programs. American Journal of Public Health. 1993;83:872–880. doi: 10.2105/ajph.83.6.872. [DOI] [PMC free article] [PubMed] [Google Scholar]
- Cromwell J., Bartosch W., Fiore M., Hasselblad V., Baker T. Cost-effectiveness of the clinical practice recommendations in the ahcpr guideline for smoking cessation. JAMA. 1997;278:1759–1766. [PubMed] [Google Scholar]
- Dino G., Horn K., Abdulkadri A., Kalsekar I., Branstetter S. Cost-effectiveness analysis of the not on tobacco program for adolescent smoking cessation. Prevention science : The official journal of the Society for Prevention Research. 2008;9:38–46. doi: 10.1007/s11121-008-0082-0. [DOI] [PubMed] [Google Scholar]
- Flay B. The promise of long-term effectiveness of school-based smoking prevention programs: a critical review of reviews. Tobacco Induced Diseases Cost-effectiveness Analysis. 2009;5 doi: 10.1186/1617-9625-5-7. 6 (http://www.tobaccoinduceddiseases.com/content/5/1/6. ) [DOI] [PMC free article] [PubMed] [Google Scholar]
- Gift T. L., Haddix A. C., Corso P. S. Cost-effectiveness analysis Prevention Effectiveness: A Guide to Decision Analysis and Economic Evaluation. 2nd edn. New York: Oxford; 2003. Chapter 9. [Google Scholar]
- Hoffman D., Sanghvi L., Wynder E. Comparative chemical analysis of Indian bidi and American cigarette smoke. International Journal of Cancer. 1974;14:49–55. doi: 10.1002/ijc.2910140107. [DOI] [PubMed] [Google Scholar]
- Li P., Chow K. The cost barrier to peritoneal dialysis in the developing world–An Asian. Peritoneal Dialysis International. 2001;21:S307–S313. [PubMed] [Google Scholar]
- Pakhale S., Jayant K., Bhide S. Chemical analysis of smoke of Indian cigarettes, bidis and other indigenous forms of smoking levels of steam-volatile phenol, hydrogren cyanide and benzo(a)pyrene. Indian Journal of Chest Diseases and Allied Sciences. 1990;32:75–81. [PubMed] [Google Scholar]
- Perry C. L., Stigler M. H., Arora M., Reddy K. S. Preventing tobacco use among young people in India: Project MYTRI. American Journal of Public Health. 2009;99:899–906. doi: 10.2105/AJPH.2008.145433. [DOI] [PMC free article] [PubMed] [Google Scholar]
- Reddy K., Gupta P. New Delhi: Tech. rep., Ministry of Health and Family Welfare, Government of India; 2004. Report on tobacco control in India. [Google Scholar]
- Rogers R. G., Powell-Griner E. Life expectancies of cigarette smokers and nonsmokers in the United States. Social Science & Medicine. 1991;32:1151–1159. doi: 10.1016/0277-9536(91)90092-q. [DOI] [PubMed] [Google Scholar]
- Sakhuja V., Sud K. End-stage renal disease in India and Pakistan: burden of disease and management issues. Kidney International Supplement. 2003:S115–S118. doi: 10.1046/j.1523-1755.63.s83.24.x. [DOI] [PubMed] [Google Scholar]
- Stigler M. H., Perry C. L., Arora M., Reddy K. S. Why are urban Indian 6th graders using more tobacco than 8th graders? findings from project MYTRI. Tobacco Control. 2006;15(Supplement 1):i54–i60. doi: 10.1136/tc.2005.014480. [DOI] [PMC free article] [PubMed] [Google Scholar]
- Stigler M. H., Perry C. L., Arora M., Shrivastav R., Mathur C., Reddy K. S. Intermediate outcomes from project MYTRI: mobilizing youth for tobacco-related initiatives in India. Cancer Epidemiology, Biomarkers & Prevention. 2007;16:1050–1056. doi: 10.1158/1055-9965.EPI-06-0929. [DOI] [PubMed] [Google Scholar]
- U.S. Department of Health and Human Services. Atlanta, Georgia: Office of Smoking and health; 1994. Preventing tobacco use among young people: a report of the surgeon general. Tech. Rep., U.S. Department of Health and Human Services, Public Health Service, Centers for Disease Control and prevention, National Center for Chronic Disease prevention and Health Promotion. [Google Scholar]
- Wang L. Y., Crossett L. S., Lowry R., Sussman S., Dent C. W. Cost-effectiveness of a school-based tobacco-use prevention program. Archives of Pediatrics & Adolescent Medicine. 2001;155:1043–1050. doi: 10.1001/archpedi.155.9.1043. [DOI] [PubMed] [Google Scholar]