Abstract
Low-level laser (light) therapy (LLLT) involves absorption of photons being in the mitochondria of cells leading to improvement in electron transport, increased mitochondrial membrane potential (MMP), and greater ATP production. Low levels of reactive oxygen species (ROS) are produced by LLLT in normal cells that are beneficial. We exposed primary cultured murine cortical neurons to oxidative stressors: hydrogen peroxide, cobalt chloride and rotenone in the presence or absence of LLLT (3 J/cm2, CW, 810 nm wavelength laser, 20 mW/ cm2). Cell viability was determined by Prestoblue™ assay. ROS in mitochondria was detected using Mito-sox, while ROS in cytoplasm was detected with CellRox™. MMP was measured with tetramethylrhodamine. In normal neurons LLLT elevated MMP and increased ROS. In oxidatively-stressed cells LLLT increased MMP but reduced high ROS levels and protected cultured cortical neurons from death. Although LLLT increases ROS in normal neurons, it reduces ROS in oxidatively-stressed neurons. In both cases MMP is increased. These data may explain how LLLT can reduce clinical oxidative stress in various lesions while increasing ROS in cells in vitro.
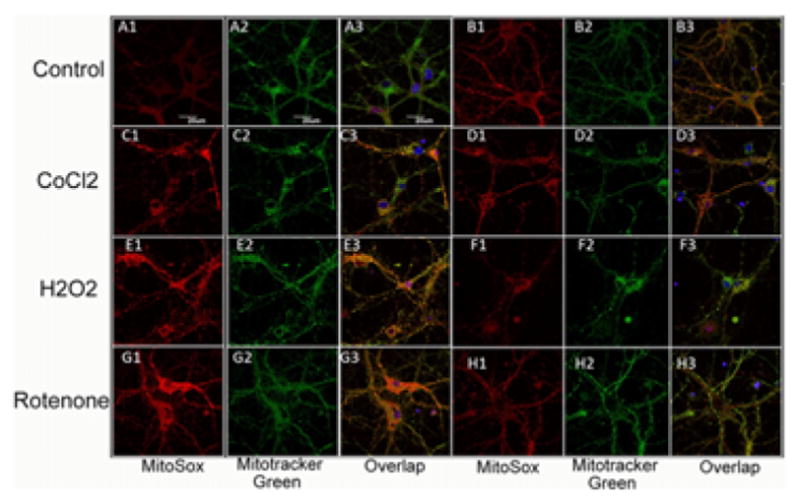
Representative images of cortical neurons labeled with MitoRox (red) for mitochondrial ROS, Mitotracker green for mitochondrial colocalization and Hoescht (blue) for nuclei (seen in triple overlay).
Keywords: low-level laser therapy, cultured cortical neurons, oxidative stress, reactive oxygen species, cobalt chloride, hydrogen peroxide
1. Introduction
The use of low level light (laser) therapy (LLLT) consisting of non-thermal red and/or near infrared light (600–1000 nm) delivered from a laser or from a non-coherent light source has been shown to have beneficial effects on a wide range of pathologies. A growing number of reports have shown a positive outcome for LLLT in diseases and injuries related to the nervous system (both peripheral and central). Treatment with low energy laser promotes axonal growth and nerve regeneration in both rat spinal cord [1, 2] and peripheral nerve injuries [3]. The efficacy of LLLT in the nervous system has been further demonstrated in animal studies showing improved neurological and functional outcome post-stroke [4– 6] and post-traumatic brain injury (TBI) [7–12]. The results of human studies in patients with long term peripheral nerve injury (6) and ischemic stroke [13, 14] have also been promising. LLLT also improves emotional response and memory function of middle aged CD-1 mice [15].
Oxidative stress, defined as an imbalance between oxidants and antioxidants, has been implicated in the pathogenesis of TBI and other brain disorders [16–18]. The fundamental mechanism of photobiomodulation [19] is proposed to involve mitochondria as the primary cellular target for the photons leading to increased cytochrome c oxidase activity [20], release of nitric oxide (NO) [21] and an increase in ATP levels [22]. Changes in intracellular signaling molecules such as calcium ions, reactive oxygen species (ROS) and redox sensitive transcription factors like NF-κB are also thought to mediate the effects of light [23]. Low-level laser has been reported to attenuate oxidative stress [24]. Although the exact mechanisms are yet to be fully understood, LLLT has been used to rescue neurons from neurotoxic injuries [25–27] and help tissue repair and wound healing in animal models [28].
Previous studies from our laboratory have shown that LLLT increases ATP synthesis, mitochondrial membrane potential and intracellular calcium levels; stimulates ROS production and NO release with a biphasic pattern in normal murine cortical neurons [29]. However the effects of 810 nm laser on neurons under oxidative stress have not yet been studied. In the present study we used three different agents to produce oxidative stress in cultured cortical neurons and tested the ability of 3 J/cm2 of 810 nm laser to rescue the cells.
2. Materials and methods
2.1 Materials
Timed pregnant CD1 mice were purchased from Charles River. Calcium-magnesium-free, Hank’s balanced salt solution (CMF-HBSS), HEPES buffer, Glutamax, Neurobasal media, B27 supplement and PrestoBlue® Cell Viability Reagent were purchased from Life Technologies Invitrogen (Grand Island, NY), while Mitosox, CellRoxTM deep red, Tetramethylrhodamine methyl ester (TMRM), Hoechst 33342 were obtained from Molecular Probes Invitrogen (Eugene, OR). 2.5% trypsin/EDTA, penicillin/ streptomycin, Type IV Deoxyribonuclease I (DNAse I), poly-D-lysine (MW150,000–300,000), Krebs- Ringer solution, cobalt chloride (CoCl2), rotenone, hydrogen peroxide (H2O2), and dimethyl sulfoxide (DMSO) were purchased from Sigma, (St. Louis, MO). Glass-bottom petri dishes were purchased from In Vitro Scientific, (Sunnyvale, CA).
2.2. Primary mouse cortical neuron isolation from mice
All animal procedures were approved by the Subcommittee on Research Animal Care of the Massachusetts General Hospital and met the guidelines of the National Institutes of Health.
Pregnant female CD1 mice (age, 8–10 weeks) were sacrificed at 16 days post-conception. The cortical lobes of 10 embryonic brains were separated from sub-cortical structures in calcium-magnesium-free, Hank’s balanced salt solution containing 20 mM HEPES buffer (CMF-Hepes-HBSS). After removal of the meninges, brain tissue was placed into CMF-Hepes- HBSS, triturated briefly with pipetting, and incubated at 37 °C for 30 min with 2.5% trypsin and 50 μg/ml DNAse I. Cells were then further dissociated mechanically and centrifuged at 1000 rpm, at 4 °C for 5 min. The pellet was resuspended in Neurobasal Media (NBM) supplemented with 2 mM Glutamax, 100 units/ml of penicillin, 100 μg/ml of streptomycin, and B27 supplement. Neurons were plated at a density of approximately 600 cells/cm2 on poly-D-lysine coated cell culture plastic plates or glass-bottom petri dishes. The plating and maintenance media consisted of Neurobasal plus B27 supplement (NB27). Cultures were then placed in a humidified atmosphere of 95% air, 5% CO2 at 37 °C. This media formulation inhibited the outgrowth of glia resulting in a neuronal population that is >95% pure. Half of the culture medium was changed at division 4 and then every 3 days.
Experiments were performed on culture days 8 to 12. Before treatment, neurons were washed with and kept in HEPES-buffered Krebs-Ringer solution (Hepes-KB solution), containing 125 mM NaCl, 4.8 mM KCl, 1.2 mM MgSO4, 1.3 mM CaCl2, 1.2 mM KH2PO4, 10 mM Glucose, 20 mM HEPES, pH 7.40. All the experiments were carried out at 37 °C.
Neurons were divided into 7 experimental groups: 1) Sham control: normal neurons were taken out of the incubator and set in the dark for 150 s, similar to experimental groups, but without oxidant exposure or laser treatment; 2) exposure to CoCl2 alone (0.2, 0.5, 1 and 2 mM) for 1 h, followed by wash; 3) CoCl2 exposure (0.2, 0.5, 1 and 2 mM) for 1 h, laser treatments (810 nm; 3 J/cm2 (20 mW/cm2) were given for 150 sec commencing immediately after addition of CoCl2; 4) exposure to 10 or 20 μM H2O2 for 1 h, followed by wash; 5) H2O2 (10, 20 μM) exposure for 1 h, laser treatments were given for 150 sec commencing immediately after addition of H2O2; 6) exposure to rotenone (0.1, 0.2, 1, 2 and 5 μM) for 1 h, followed by wash; and 7) rotenone exposure (0.1, 0.2, 1, 2 and 5 μM) for 1 h, laser treatments were given for 150 sec commencing immediately after addition of rotenone.
2.3 Laser irradiation protocol
The experiments were conducted with a diode laser (Photothera Inc., Carlsbad, CA), which emits continuous wave 810 nm wavelength near infrared radiation. The cells were irradiated with a power density of 20 mW/cm2 for 150 sec to achieve total energy densities of 3 J/cm2. The spot size was 5 cm in diameter in both cases. In the case of 96-well plates, the spot covered 9 wells.
2.4 Cell viability assay
Cells in 96-well plates were treated with oxidative stress agents either with or without additional laser application and had their cell viability assayed after 24 h. Administration of 10 μL Prestoblue solution into each well and incubated the plate at 37 °C for 2 h, then the cells was measured at excitation 560 nm, emission 590 nm on a 96-well plate reader (Molecular Devices SpectraMax M5) following manufacturer’s instructions. Three independent experiments were carried out.
2.4 Evaluation of mitochondrial ROS and cellular ROS production
Cytoplasmic ROS was measured using CellROX™ Deep Red, a fluorescent indicator of cytoplasmic ROS. CellROX Deep Red is a cell permeant dye that is non-fluorescent while in a reduced state and becomes fluorescent upon oxidation by ROS with emission maxima of 665 nm. Mito-Sox red is a non-fluorescent dye based on dihydroethidium that localizes in mitochondria and undergoes reaction with mitochondrial superoxide to give red fluorescence [30]. The neurons were incubated with then 2 μM of Mito-sox red for 10 mins, and then 50 nM Mitotracker green for 30 mins, 5 μg/ml of Hoechst-33342 (Sigma) was also added for a nuclei stain. After a wash once with Hepes-KB solution, the neurons were incubated with the following concentrations of CoCl2, (500 nM) H2O2 (20 μM) or rotenone (200 nM) and irradiated with the 810 nm laser for 150 sec immediately after exposure to the oxidative stress agent. For CellROX™ Deep Red, after incubation with oxidative stress agent for 30 mins, the neurons were incubated with 5 μM of CellROX™ Deep Red in Hepes-KB solution for another 30 mins, 5 μg/ml of Hoechst-33342 (Sigma) was then added as a nuclei stain. Then washed twice with and kept in Hepes Krebs-Ringer’s buffer. The fluorescence was imaged with a confocal microscope (Olympus America Inc, Center Valley, PA) using ex/em 635 nm/660 nm for CellROX™ Deep Red, and 559 nm/590 nm for Mito-Sox red.)
2.5 Mitochondrial membrane potential determination
Mitochondrial membrane potential was monitored with tetramethylrhodamine methyl ester (TMRM) at a loading concentration of 25 nM sufficient to cause dye aggregation within the mitochondrial matrix. After washing, fluorescence was monitored in the presence of TMRM by excitation at 559 nm with emission at 610 nm, using an Olympus FV1000 inverted fluorescence microscope equipped with a 60× water immersion objective.
2.6 Quantitative confocal microscopy
Confocal images were collected on an Olympus FV1000 microscope (Olympus, Japan) with an inverted microscope fitted with a 60× PlanApo (1.40 NA) water immersion objective. Images were collected using the Olympus Fluoview software with 800 × 800 pixels with the slow scan speed. Fluorescence quantification was carried out on this widefield microscope with a 20× magnification objective to obtain a large number of cells per field. Images for qualitative purposes were obtained at a higher magnification (60×). Fields used for quantification were selected at random throughout the dish and focused using phase-contrast optics before viewing the fluorescence. Digital images were recorded and the quantification of fluorescence intensity was performed using Image-Pro Plus 6.0 software (Media Cybernetics). Total fluorescence per field was obtained by summing the pixel intensity over the whole field after subtracting an integer corresponding to a background value obtained from a field that did not contain any cells. Background fluorescence values including autofluorescence and nonspecific fluorescence were obtained by imaging fields of cells under the same illumination and exposure conditions. The fluorescence intensity was calculated by dividing the total integrated optical density by the total number of cells in each field and expressed as relative fluorescence intensity [31].
2.7 Statistical analysis
All fluorescence readings were normalized to total protein (measured by BCA, Pierce Biotechnology Inc.). All assays were performed in triplicate with n = 6 for each sample. Excel software was used to perform Single-Factor ANOVA with Tukey’s posthoc test to evaluate the statistical significance of experimental results (p < 0.05).
3. Results
3.1 Effect of 810 nm LLLT on cell viability after oxidative stress
Cell viability assays were performed to determine dose response curves for reduction of viability in the cortical neurons caused by 1 h exposure to either CoCl2, H2O2 or rotenone and to investigate the effect of 810 nm laser irradiation on cell viability.
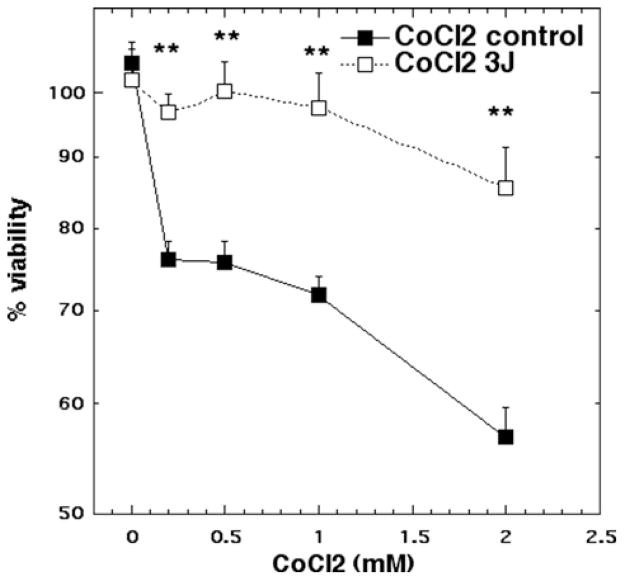
For CoCl2 treatment concentrations of 0.2, 0.5, 1 and 2 mM led to cytotoxicity ranging from 25% to 45%. Laser treatment (3 J/cm2) protected neurons from the cytotoxic effects of CoCl2 reducing the loss of viability to a maximum of 12% cytotoxicity (p < 0.01) (Figure 1).
Figure 1.
Cell viability of cortical neurons treated with increasing doses of CoCl2 for 1 hour with and without 3 J/ cm2 810 nm laser in 1st 2.5 min. N = 6 wells per group, error bars are SEM and * = p < 0.05 and ** = p < 0.01.
For H2O2, treatment with 10 and 20 μM H2O2 led to cytotoxicity of 67% and 75% respectively. Laser treatment reduced the neuronal cytotoxicity to 56% (p < 0.01) and 58% (p < 0.05) respectively (Figure 2).
Figure 2.
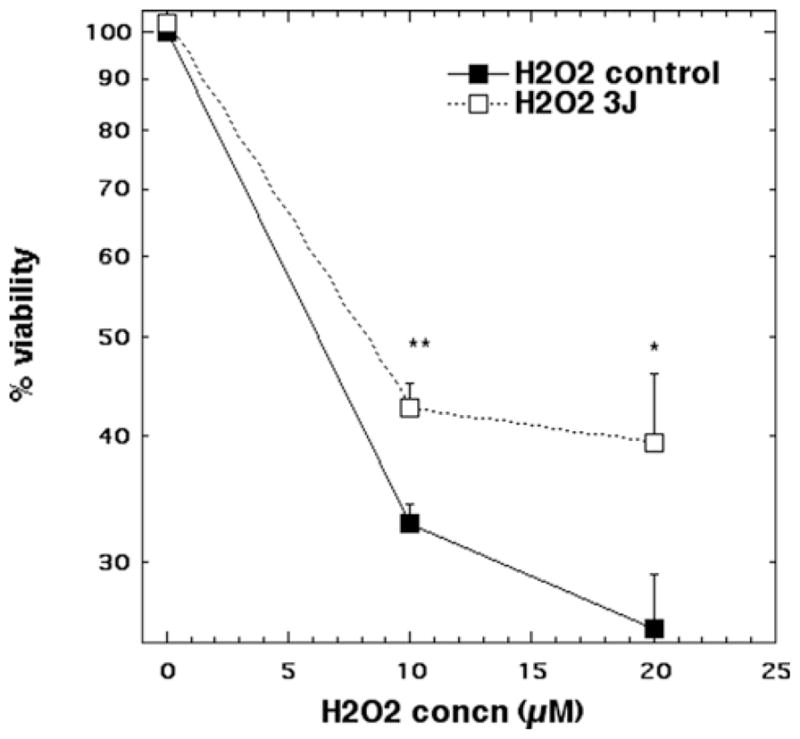
Cell viability of cortical neurons treated with CoCl2 (10 and 20 μM) for 1 hour with and without 3 J/cm2 810 nm laser in 1st 2.5 min. N = 6 wells per group, error bars are SEM and * = p < 0.05 and ** = p < 0.01.
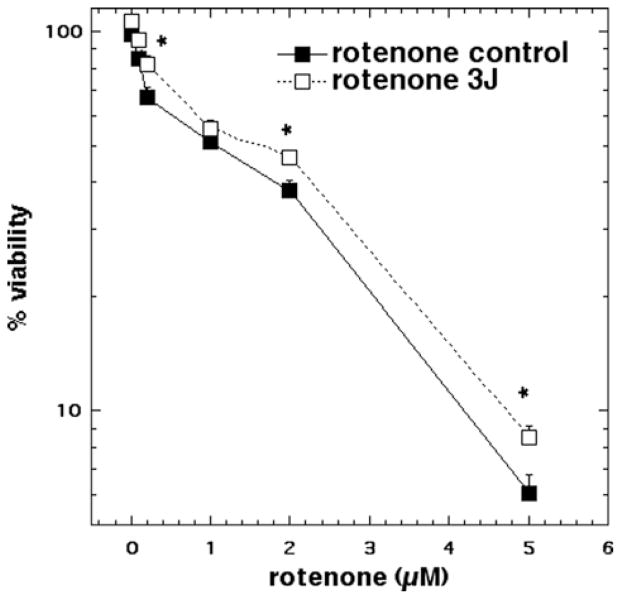
Rotenone treatment (0.1 μM to 5 μM) produced a dose-dependent loss of viability reaching cytotoxicity of 94% at 5 μM. Laser treatment protected against rotenone cytotoxicity, however the protection in cell viability was much reduced (only 3–5% less killing) compared to the other oxidative stress agents. Nevertheless the protection was statistically significant (p < 0.05) at 0.2, 2, and 5 μM (Figure 3).
Figure 3.
Cell viability of cortical neurons treated with increasing doses of rotenone for 1 hour with and without 3 J/ cm2 810 nm laser in 1st 2.5 min. N = 6 wells per group, error bars are SEM and * = p < 0.05.
3.2 Effect of 810 nm laser on mitochondrial superoxide generation measured by Mito-sox red
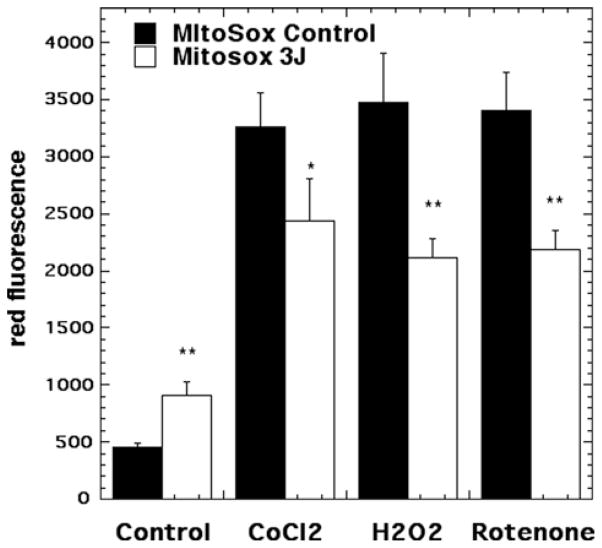
Representative images are shown in Figure 4(A–H) and the quantification of the fluorescence measurements is shown in Figure 5. Significant (p < 0.01) Mito-sox red fluorescence indicating mitochondrial production of ROS was seen in control neurons (no oxidative stress) exposed to 3 J/cm2 810 nm laser (compare Figures 4A and B and 5). This is in agreement with the results we have reported previously [29].
Figure 4.
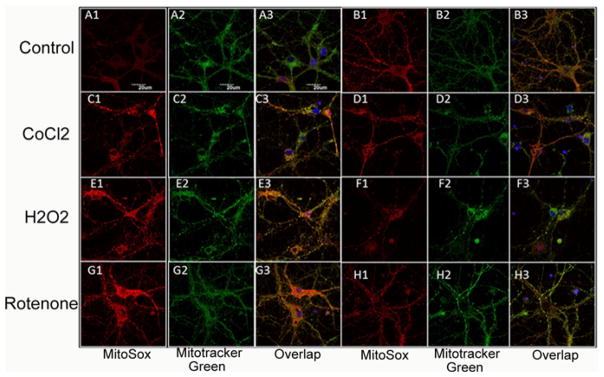
(online color at: www.biophotonics-journal.org) Representative images of cortical neurons labeled with MitoRox (red) for mitochondrial ROS, Mitotracker green for mitochondrial colocalization and Hoescht (blue) for nuclei (seen in triple overlay). (A) control cortical neurons (B) cortical neurons with 3 J/cm2 810 nm laser; (C) cortical neurons treated with 500 μM CoCl2; (D) cortical neurons treated with 500 μM CoCl2 and 3 J/cm2 810 nm laser; (E) cortical neurons treated with 20 μM H2O2; (F) cortical neurons treated with 20 μM H2O2 and 3 J/cm2 810 nm laser. (G) cortical neurons treated with 200 nM rotenone; (H) cortical neurons treated with 200 nM rotenone and 3 J/cm2 810 nm laser. Scale bar = 20 μm.
Figure 5.
Quantification of fluorescence measurements from the groups shown in Figure 4. N = 6 fields per group, error bars are SEM and * = p < 0.05 and ** = p < 0.01.
An approximate 7-fold rise in mitochondrial ROS was seen in the 500 μM CoCl2 treated group (compare Figure 4A and C). Mitochondrial ROS production was significantly reduced (p < 0.05) after exposure to 3 J/ cm2 laser (compare Figures 4D with C and 5). H2O2 (20 μM) also produced an approximate 7-fold rise in mitochondrial ROS and this was significantly reduced (p < 0.01) after 3 J/cm2 of 810 nm laser (compare Figures 4F with E and 5). Rotenone (200 nM) also produced an approximate 7-fold rise in mitochondrial ROS which was significantly reduced (p < 0.01) by laser treatment (compare Figures 4H with G and 5).
3.3 Effect of 810 nm laser on cytoplasmic ROS generation measured by CellRox deep red
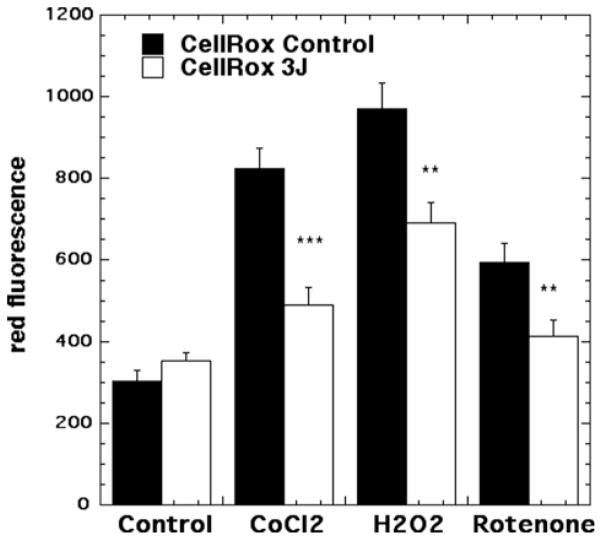
Representative images are shown in Figure 6(A–H) and the quantification of the fluorescence measurements is shown in Figure 7. In contrast to the results we found with mitochondrial ROS, we did not find a significant rise in cytoplasmic ROS when laser was delivered to control neurons without oxidative stress (compare Figures 6A and B and 7). An approximate 4-fold rise in cytoplasmic ROS was seen in the 500 μM CoCl2 treated group (compare Figure 6A and C). Cytoplasmic ROS production was significantly reduced (p < 0.001) after exposure to 3 J/cm2 laser (compare Figures 6D with C and 7). H2O2 (20 μM) produced an approximate 2.5-fold rise in cytoplasmic ROS and this was significantly reduced (p < 0.01) after 3 J/cm2 of 810 nm laser (compare Figures 6F with E and 7). Rotenone (200 nM) produced a 3-fold rise in cytoplasmic ROS which was significantly reduced (p < 0.01) by laser treatment (compare Figures 6H with G and 7).
Figure 6.
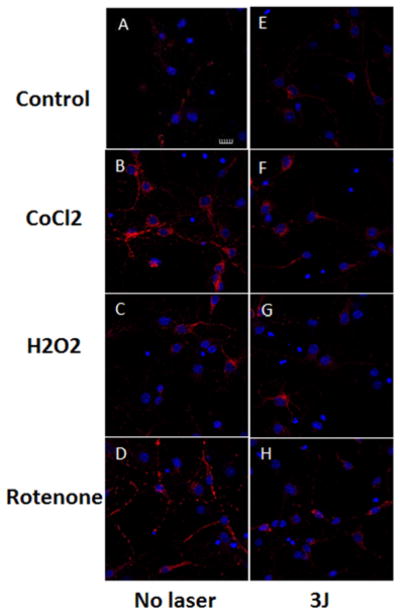
(online color at: www.biophotonics-journal.org) Representative images of cortical neurons labeled with Cellrox (deep red) for cytoplasmic ROS, and Hoescht (blue) for nuclei. (A) control cortical neurons (B) cortical neurons with 3 J/cm2 810 nm laser; (C) cortical neurons treated with 500 μM CoCl2; (D) cortical neurons treated with 500 μM CoCl2 and 3 J/cm2 810 nm laser; (E) cortical neurons treated with 20 μM H2O2; (F) cortical neurons treated with 20 μM H2O2 and 3 J/cm2 810 nm laser. (G) cortical neurons treated with 200 nM rotenone; (H) cortical neurons treated with 200 nM rotenone and 3 J/cm2 810 nm laser. Scale bar = 20 μm.
Figure 7.
Quantification of fluorescence measurements from the groups shown in Figure 6. N = 6 fields per group, error bars are SEM and * = p < 0.05 and ** = p < 0.01.
3.4 Effect of 810 nm laser on mitochondrial membrane potential
Representative images are shown in Figure 8(A–H) and the quantification of the fluorescence measurements is shown in Figure 9. In agreement with the results from a previous study [29] we found a small (~30%) but significant (p < 0.01) rise in MMP when laser was delivered to control neurons without oxidative stress (compare Figures 8A and B and 9). An approximate 3-fold reduction in MMP was seen in the 500 μM CoCl2 treated group (compare Figure 8A and C). MMP was significantly increased (p < 0.01) after exposure to 3 J/cm2 laser (compare Figures 8D with C and 9). H2O2 (20 μM) produced an approximate 5-fold reduction in MMP and this was significantly attenuated to control levels (p < 0.001) after 3 J/cm2 of 810 nm laser (compare Figures 8F with E and 9). Rotenone (200 nM) produced the largest reduction in MMP and although the increase after laser treatment was relatively minor compared to other oxidative stress agents it was still significant (p < 0.01) (compare Figures 8H with G and 9).
Figure 8.
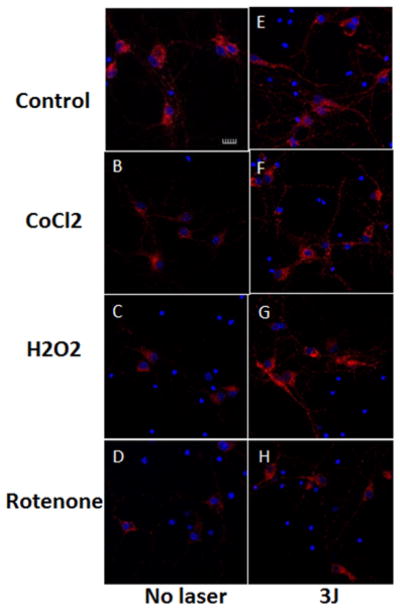
(online color at: www.biophotonics-journal.org) Representative images of cortical neurons labeled with TMRM for mitochondrial membrane potential, and Hoescht (blue) for nuclei. (A) control cortical neurons (B) cortical neurons with 3 J/cm2 810 nm laser; (C) cortical neurons treated with 500 μM CoCl2; (D) cortical neurons treated with 500 μM CoCl2 and 3 J/cm2 810 nm laser; (E) cortical neurons treated with 20 μM H2O2; (F) cortical neurons treated with 20 μM H2O2 and 3 J/cm2 810 nm laser. (G) cortical neurons treated with 200 nM rotenone; (H) cortical neurons treated with 200 nM rotenone and 3 J/cm2 810 nm laser. Scale bar = 20 μm.
Figure 9.
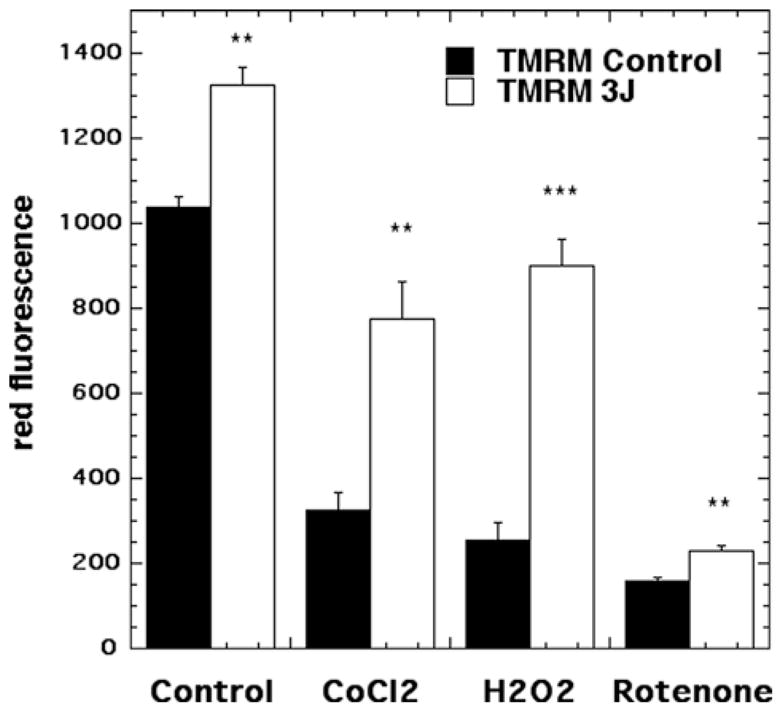
Quantification of fluorescence measurements from the groups shown in Figure 8. N = 6 fields per group, error bars are SEM and * = p < 0.05 and ** = p < 0.01.
4. Discussion
Oxidative stress and chronic inflammation have been implicated in neuronal dysfunction and are considered to be hallmarks of many brain injuries and neurodegenerative diseases [32]. Oxidative stress induced by overproduction of ROS causes damage to basic components in cells, such as lipids [33], DNA [34] and proteins.
In this study, we demonstrated that 810 nm laser suppressed ROS production induced by three different oxidative stresses (CoCl2 H2O2 and rotenone), and rescued primary cortical neurons from cell death caused by oxidative stress. We also provide an explanation of an apparent paradox that can be perceived in the literature concerning the proposed mechanisms of LLLT; namely, how can the numerous reports of generation of ROS after LLLT in diverse cell types in vitro [35–41], be reconciled with equally numerous reports (often in vivo models or under other conditions) [42–45] of reductions in ROS and amelioration of oxidative stress caused by LLLT. Our data suggest that ROS can be produced in mitochondria in the short-term associated with an increase in MMP when LLLT is delivered in an appropriate dose to normal unstressed cells in culture. However an increase in ROS is also associated with a reduction in MMP when mitochondrial inhibitors (rotenone) or oxidative stressors (CoCl2 or H2O2) are employed. In the latter case when LLLT is delivered to the cells the MMP is increased and therefore the generation of ROS by the mitochondria is lessened.
The mitochondria are the putative cellular target for red and NIR photons. ROS produced in the mitochondria are involved in many signaling pathways [46]. Although MitoSox is specific for superoxide that is not itself a highly damaging oxidant, superoxide can act as a precursor to much more damaging ROS such as hydroxyl radical and these ROS can diffuse out of the mitochondria as shown by activation of CellROX.
Increasing evidence in the literature has suggested a direct correlation between LLLT and activation of the cellular antioxidant system [47]. In addition, it has been suggested that changes in the cellular redox state leads to photobiostimulatory processes [48]. Wong-Riley et al. have demonstrated NIR treatment reversed the down-regulation of cytochrome oxidase activity and cellular ATP content induced by toxins [25].
CoCl2 is a well-known hypoxia-mimetic agent [49] that has been demonstrated to mimic physiologically occurring hypoxic/ischemic conditions, including generation of reactive oxygen species (ROS) [50] and transcriptional change of some genes such as hypoxia- inducible transcription factor-1a (HIF-1a), that is associated with p53, and p21, promoting cell death [51, 52] in diverse cell types [53, 54]. CoCl2-induced ROS generation, and thus oxidative stress, is thought to act via a non-enzymatic and non-mitochondrial mechanism [54] in divergent cell types [53]. Co (II) has been identified as an oxidative stress-inducing factor producing ROS via a Fenton-type reaction [55, 56]. Zhang et al. [57] investigated CoCl2-induced cell damage in primary cultured cortical neurons and the possible underlying mechanisms. It was shown that treatment with CoCl2 at 100 μM in PC12 cell line produced intracellular ROS at incubation times of less than 3 h [58].
Hydrogen peroxide (H2O2) is one of the ROS generated during cellular metabolism. Previous studies have shown that exogenously added H2O2 can activate several downstream signaling pathways involved in cell survival or apoptosis (depending on dose) in various cell types during oxidative insults. H2O2 hyperpolarizes the neuronal membrane concomitant with an increase in the cytosolic Ca2+ concentration, leading to the subsequent activation of a Ca2+ dependent K+ conductance [59]. The hydroxyl radical seems to play a central role in the mediation of the H2O2 response. It is proposed that H2O2 plays a role in the regulation of enzyme activity via oxidation of cysteine residues [60]. In principle, H2O2 might act directly at the neuronal Na+ channels or it might interfere with modulator proteins responsible for the regulation of their activity. Neuronal voltage-gated Na+ channels are known to be regulated by phosphorylation [61]; and oxidants have been shown to interact with serine/threonine protein phosphatases [62] as well as with tyrosine protein phosphatases [63]. Consequently, different inhibitors of protein phosphatases and protein kinases were tested for their ability to interfere with the action of the oxidant. H2O2 exposure selectively and transiently induced acute cell apoptosis via activating PI3K-Akt and Mek-Erk signaling pathways in a concentration-dependent and time-dependent manner in neuron stem/progenitor cells [64]. H2O2, as a major ROS, can alter the intracellular redox state of cells, and induce oxidative damage by its conversion into a highly reactive hydroxyl radical, ·OH [65]. In addition, the level of H2O2 and ·OH in mitochondria has been shown to be elevated during the pathogenesis of neurodegenerative disorders [66]. Therefore, H2O2 has been extensively used to furnish a cell culture model of oxidative stress for studying neurotoxicity and neuroprotection in the CNS. Choi et al. [67] found H2O2 induced transient hyperpolarization of the MMP and a subsequent delayed burst of ROS, causing non-apoptotic neuronal cell death in a c-jun N-terminal kinase and poly (ADP-ribosyl) polymerase-dependent manner.
Rotenone inhibits the mitochondrial respiratory chain at complex I and can cause highly-selective degeneration of nigrostriatal neurons and can reproduce many features of Parkinson’s disease [68]. Growing evidence shows that rotenone, even at low concentrations, exerts significant toxicity within the hippocampus neurons. It was demonstrated that rotenone induced H2O2 generation, followed by a significant reduction in the MMP, and caspase-3 activity increased in a time-dependent manner [69]. The mechanism of rotenone induced apoptosis may be involved in H2O2 generation through inhibition of NADH dehydrogenase complex and/or activation of NAD(P)H oxidase, and H2O2 generation causes the disruption of MMP [70]. Radad et al. [71] showed that rotenone also decreased MMP in dopaminergic cells significantly. In parallel, Menke et al. [72] reported that rotenone decreased MMP in the human neuroblastoma cell line SH-SY5Y. It was also reported that mitochondrial depolarization by rotenone lead to caspase-3-dependent apoptosis in primary dopaminergic neurons [73]. The fact that the protection from cytotoxicity afforded by laser was lower in the case of rotenone than it was with the other oxidative stressors may be relevant. Since rotenone is a complex one inhibitor and the putative site of action of LLLT is at complex four (cytochrome c oxidase) [25, 74, 75], it may the case that the increasing the electron transport in the latter part of the chain cannot completely overcome a blockage right at the beginning.
An emerging body of literature from several independent laboratories is establishing the beneficial effects of LLLT on intracellular neuronal and non-neuronal pathways that provide for improvements in mitochondrial function, decreased oxidative stress and increased cell viability. Brief treatment with 670 nm light-emitting diode (LED) has been shown to regulate the expression of genes encoding DNA repair protein, antioxidant enzymes and molecular chaperons in retinas of methanol intoxicated rats [76]. LLLT also increased the expression of anti-apoptotic protein Bcl-2 and reduced the expression of proapoptotic protein Bax in muscle cell cultures [77].
Consistent with our work, LLLT was found to decrease intracellular ROS levels induced by CoCl2, and consequently alleviated oxidative stress in human umbilical vein endothelial cells [78]. Giuliani et al. reported 670 nm laser could prevent H2O2-induced MMP reduction at early (2 and 15 min) time points and improved cell viability in a neuronal PC12 cell line [24]. In vitro, LLLT increased survival and ATP content of neurons and decreased oxidative stress after rotenone-induced toxicity [27]. In vivo, LLLT exerted neuroprotective effects against rotenone-induced neurotoxicity in rats [79], and these effects were demonstrated by assessing behavioral, morphological and neurochemical changes [79]. It is interesting to note that light therapy had no effect on a transgenic mouse model of ALS expressing mutant human SOD1 [80].
Although we chose a defined LLLT dose that in our lab was beneficial, it is important to note that a biphasic dose response has been demonstrated many times in low level laser therapy research [29, 81, 82]. The mechanisms by which LLLT could increase ROS in normal non-stressed cells, but give the opposite effect by decreasing ROS in cells subjected to oxidative stress needs further investigation, but the fact that both these effects are associated with increases in MMP provides an avenue for further studies. Our studies provide insights into potential applications of LLLT in attenuating oxidative stress in neuronal disease and damage.
Acknowledgments
This work was supported by sponsored research funding from Photothera Inc and by NIH grant R01AI050875, Center for Integration of Medicine and Innovative Technology (DAMD17-02-2-0006), CDMRP Program in TBI (W81XWH-09-1-0514) and Air Force Office of Scientific Research (FA9950-04-1-0079)
Footnotes
Author biographies Please see Supporting Information online.
References
- 1.Byrnes KR, Waynant RW, Ilev IK, Wu X, Barna L, Smith K, Heckert R, Gerst H, Anders JJ. Lasers Surg Med. 2005;36:171–185. doi: 10.1002/lsm.20143. [DOI] [PubMed] [Google Scholar]
- 2.Wu X, Dmitriev AE, Cardoso MJ, Viers-Costello AG, Borke RC, Streeter J, Anders JJ. Lasers Surg Med. 2009;41:36–41. doi: 10.1002/lsm.20729. [DOI] [PubMed] [Google Scholar]
- 3.Rochkind S. Neurosurg Focus. 2009;26:E8. doi: 10.3171/FOC.2009.26.2.E8. [DOI] [PubMed] [Google Scholar]
- 4.Oron A, Oron U, Chen J, Eilam A, Zhang C, Sadeh M, Lampl Y, Streeter J, DeTaboada L, Chopp M. Stroke. 2006;37:2620–2624. doi: 10.1161/01.STR.0000242775.14642.b8. [DOI] [PubMed] [Google Scholar]
- 5.Detaboada L, Ilic S, Leichliter-Martha S, Oron U, Oron A, Streeter J. Lasers Surg Med. 2006;38:70–73. doi: 10.1002/lsm.20256. [DOI] [PubMed] [Google Scholar]
- 6.Lapchak PA, De Taboada L. Brain Res. 2010;1306:100–105. doi: 10.1016/j.brainres.2009.10.022. [DOI] [PubMed] [Google Scholar]
- 7.Oron A, Oron U, Streeter J, de Taboada L, Alexandrovich A, Trembovler V, Shohami E. J Neurotrauma. 2007;24:651–656. doi: 10.1089/neu.2006.0198. [DOI] [PubMed] [Google Scholar]
- 8.Ando T, Xuan W, Xu T, Dai T, Sharma SK, Kharkwal GB, Huang YY, Wu Q, Whalen MJ, Sato S, Obara M, Hamblin MR. PLoS One. 2011;6:e26212. doi: 10.1371/journal.pone.0026212. [DOI] [PMC free article] [PubMed] [Google Scholar]
- 9.Wu Q, Xuan W, Ando T, Xu T, Huang L, Huang YY, Dai T, Dhital S, Sharma SK, Whalen MJ, Hamblin MR. Lasers Surg Med. 2012;44:218–226. doi: 10.1002/lsm.22003. [DOI] [PMC free article] [PubMed] [Google Scholar]
- 10.Huang YY, Gupta A, Vecchio D, Arce VJ, Huang SF, Xuan W, Hamblin MR. J Biophotonics. 2012;5:827–837. doi: 10.1002/jbio.201200077. [DOI] [PMC free article] [PubMed] [Google Scholar]
- 11.Khuman J, Zhang J, Park J, Carroll JD, Donahue C, Whalen MJ. J Neurotrauma. 2012;29:408–417. doi: 10.1089/neu.2010.1745. [DOI] [PMC free article] [PubMed] [Google Scholar]
- 12.Quirk BJ, Torbey M, Buchmann E, Verma S, Whelan HT. Photomed Laser Surg. 2012 doi: 10.1089/pho.2012.3261. [DOI] [PMC free article] [PubMed] [Google Scholar]
- 13.Lampl Y, Zivin JA, Fisher M, Lew R, Welin L, Dahlof B, Borenstein P, Andersson B, Perez J, Caparo C, Ilic S, Oron U. Stroke. 2007;38:1843–1849. doi: 10.1161/STROKEAHA.106.478230. [DOI] [PubMed] [Google Scholar]
- 14.Lapchak PA. Ann Med. 2010;42:576–586. doi: 10.3109/07853890.2010.532811. [DOI] [PMC free article] [PubMed] [Google Scholar]
- 15.Michalikova S, Ennaceur A, van Rensburg R, Chazot PL. Neurobiol Learn Mem. 2008;89:480–488. doi: 10.1016/j.nlm.2007.07.014. [DOI] [PubMed] [Google Scholar]
- 16.Hou Z, Luo W, Sun X, Hao S, Zhang Y, Xu F, Wang Z, Liu B. Brain Res Bull. 2012;88:560–565. doi: 10.1016/j.brainresbull.2012.06.006. [DOI] [PubMed] [Google Scholar]
- 17.Ciancarelli I, Amicis DD, Massimo CD, Carolei A, Ciancarelli MT. Curr Neurovasc Res. 2012 doi: 10.2174/156720212803530717. [DOI] [PubMed] [Google Scholar]
- 18.Verri M, Pastoris O, Dossena M, Aquilani R, Guerriero F, Cuzzoni G, Venturini L, Ricevuti G, Bongiorno AI. Int J Immunopathol Pharmacol. 2012;25:345–353. doi: 10.1177/039463201202500204. [DOI] [PubMed] [Google Scholar]
- 19.Chung H, Dai T, Sharma SK, Huang YY, Carroll JD, Hamblin MR. Ann Biomed Eng. 2012;40:516–533. doi: 10.1007/s10439-011-0454-7. [DOI] [PMC free article] [PubMed] [Google Scholar]
- 20.Hu WP, Wang JJ, Yu CL, Lan CC, Chen GS, Yu HS. J Invest Dermatol. 2007;127:2048–2057. doi: 10.1038/sj.jid.5700826. [DOI] [PubMed] [Google Scholar]
- 21.Karu TI, Pyatibrat LV, Afanasyeva NI. Lasers Surg Med. 2005;36:307–314. doi: 10.1002/lsm.20148. [DOI] [PubMed] [Google Scholar]
- 22.Passarella S, Casamassima E, Molinari S, Pastore D, Quagliariello E, Catalano IM, Cingolani A. FEBS Lett. 1984;175:95–99. doi: 10.1016/0014-5793(84)80577-3. [DOI] [PubMed] [Google Scholar]
- 23.Chen AC-H, Arany PR, Huang Y-Y, Tomkinson EM, Saleem T, Yull FE, Blackwell TS, Hamblin MR. Proc SPIE. 2009;7165 [Google Scholar]
- 24.Giuliani A, Lorenzini L, Gallamini M, Massella A, Giardino L, Calza L. BMC Complement Altern Med. 2009;9:8. doi: 10.1186/1472-6882-9-8. [DOI] [PMC free article] [PubMed] [Google Scholar]
- 25.Wong-Riley MT, Liang HL, Eells JT, Chance B, Henry MM, Buchmann E, Kane M, Whelan HT. J Biol Chem. 2005;280:4761–4771. doi: 10.1074/jbc.M409650200. [DOI] [PubMed] [Google Scholar]
- 26.Liang HL, Whelan HT, Eells JT, Meng H, Buchmann E, Lerch-Gaggl A, Wong-Riley M. Neuroscience. 2006;139:639–649. doi: 10.1016/j.neuroscience.2005.12.047. [DOI] [PubMed] [Google Scholar]
- 27.Liang HL, Whelan HT, Eells JT, Wong-Riley MT. Neuroscience. 2008;153:963–974. doi: 10.1016/j.neuroscience.2008.03.042. [DOI] [PMC free article] [PubMed] [Google Scholar]
- 28.Albertini R, Villaverde AB, Aimbire F, Salgado MA, Bjordal JM, Alves LP, Munin E, Costa MS. J Photochem Photobiol B. 2007;89:50–55. doi: 10.1016/j.jphotobiol.2007.08.005. [DOI] [PubMed] [Google Scholar]
- 29.Sharma SK, Kharkwal GB, Sajo M, Huang YY, De Taboada L, McCarthy T, Hamblin MR. Lasers Surg Med. 2011;43:851–859. doi: 10.1002/lsm.21100. [DOI] [PMC free article] [PubMed] [Google Scholar]
- 30.Invitrogen. BioProbes. 2011;64:6–9. [Google Scholar]
- 31.Dunn KW, Mayor S, Myers JN, Maxfield FR. Faseb J. 1994;8:573–582. doi: 10.1096/fasebj.8.9.8005385. [DOI] [PubMed] [Google Scholar]
- 32.Nicholls DG. Ann N YAcad Sci. 2008;1147:53–60. doi: 10.1196/annals.1427.002. [DOI] [PubMed] [Google Scholar]
- 33.Cini M, Moretti A. Neurobiol Aging. 1995;16:53–57. doi: 10.1016/0197-4580(95)80007-e. [DOI] [PubMed] [Google Scholar]
- 34.Mecocci P, MacGarvey U, Beal MF. Ann Neurol. 1994;36:747–751. doi: 10.1002/ana.410360510. [DOI] [PubMed] [Google Scholar]
- 35.Callaghan GA, Riordan C, Gilmore WS, McIntyre IA, Allen JM, Hannigan BM. Lasers Surg Med. 1996;19:201–206. doi: 10.1002/(SICI)1096-9101(1996)19:2<201::AID-LSM12>3.0.CO;2-9. [DOI] [PubMed] [Google Scholar]
- 36.Chen AC-H, Arany PR, Huang YY, Tomkinson EM, Saleem T, Yull FE, Blackwell TS, Hamblin MR. Proc SPIE. 2009 [Google Scholar]
- 37.Eichler M, Lavi R, Friedmann H, Shainberg A, Lubart R. Photomed Laser Surg. 2007;25:170–174. doi: 10.1089/pho.2007.2046. [DOI] [PubMed] [Google Scholar]
- 38.Friedmann H, Lubart R, Laulicht I, Rochkind S. J Photochem Photobiol B. 1991;11:87–91. doi: 10.1016/1011-1344(91)80271-i. [DOI] [PubMed] [Google Scholar]
- 39.Lavi R, Shainberg A, Friedmann H, Shneyvays V, Rickover O, Eichler M, Kaplan D, Lubart R. J Biol Chem. 2003;278:40917–40922. doi: 10.1074/jbc.M303034200. [DOI] [PubMed] [Google Scholar]
- 40.Yu W, Naim JO, McGowan M, Ippolito K, Lanzafame RJ. Photochem Photobiol. 1997;66:866–871. doi: 10.1111/j.1751-1097.1997.tb03239.x. [DOI] [PubMed] [Google Scholar]
- 41.Zhang J, Xing D, Gao X. J Cell Physiol. 2008;217:518–528. doi: 10.1002/jcp.21529. [DOI] [PubMed] [Google Scholar]
- 42.Silveira PC, Silva LA, Freitas TP, Latini A, Pinho RA. Lasers in medical science. 2011;26:125–131. doi: 10.1007/s10103-010-0839-0. [DOI] [PubMed] [Google Scholar]
- 43.Lim J, Sanders RA, Snyder AC, Eells JT, Henshel DS, Watkins JB., 3rd J Photochem Photobiol B. 2010;99:105–110. doi: 10.1016/j.jphotobiol.2010.03.002. [DOI] [PubMed] [Google Scholar]
- 44.Lim J, Ali ZM, Sanders RA, Snyder AC, Eells JT, Henshel DS, Watkins JB., 3rd Journal of biochemical and molecular toxicology. 2009;23:1–8. doi: 10.1002/jbt.20257. [DOI] [PubMed] [Google Scholar]
- 45.Rubio CR, Simes JC, Moya M, Soriano F, Palma JA, Campana V. Photomed Laser Surg. 2009;27:79–84. doi: 10.1089/pho.2007.2232. [DOI] [PubMed] [Google Scholar]
- 46.Thannickal VJ, Fanburg BL. Am J Physiol Lung Cell Mol Physiol. 2000;279:L1005–L1028. doi: 10.1152/ajplung.2000.279.6.L1005. [DOI] [PubMed] [Google Scholar]
- 47.Silveira PC, Streck EL, Pinho RA. J Photochem Photobiol B. 2007;86:279–282. doi: 10.1016/j.jphotobiol.2006.10.002. [DOI] [PubMed] [Google Scholar]
- 48.Liu XG, Zhou YJ, Liu TC, Yuan JQ. Photomed Laser Surg. 2009;27:863–869. doi: 10.1089/pho.2008.2443. [DOI] [PubMed] [Google Scholar]
- 49.Goldberg MA, Dunning SP, Bunn HF. Science. 1988;242:1412–1415. doi: 10.1126/science.2849206. [DOI] [PubMed] [Google Scholar]
- 50.Kotake-Nara E, Saida K. Scientific World Journal. 2006;6:176–186. doi: 10.1100/tsw.2006.37. [DOI] [PMC free article] [PubMed] [Google Scholar]
- 51.Wang G, Hazra TK, Mitra S, Lee HM, Englander EW. Nucleic Acids Res. 2000;28:2135–2140. doi: 10.1093/nar/28.10.2135. [DOI] [PMC free article] [PubMed] [Google Scholar]
- 52.Chen AC, Arany PR, Huang YY, Tomkinson EM, Sharma SK, Kharkwal GB, Saleem T, Mooney D, Yull FE, Blackwell TS, Hamblin MR. PLoS ONE. 2011;6:e22453. doi: 10.1371/journal.pone.0022453. [DOI] [PMC free article] [PubMed] [Google Scholar]
- 53.Tomaro ML, Frydman J, Frydman RB. Arch Biochem Biophys. 1991;286:610–617. doi: 10.1016/0003-9861(91)90088-z. [DOI] [PubMed] [Google Scholar]
- 54.Chandel NS, Maltepe E, Goldwasser E, Mathieu CE, Simon MC, Schumacker PT. Proc Natl Acad Sci USA. 1998;95:11715–11720. doi: 10.1073/pnas.95.20.11715. [DOI] [PMC free article] [PubMed] [Google Scholar]
- 55.Moorhouse CP, Halliwell B, Grootveld M, Gutteridge JM. Biochim Biophys Acta. 1985;843:261–268. doi: 10.1016/0304-4165(85)90147-3. [DOI] [PubMed] [Google Scholar]
- 56.Wang X, Yokoi I, Liu J, Mori A. Arch Biochem Biophys. 1993;306:402–406. doi: 10.1006/abbi.1993.1529. [DOI] [PubMed] [Google Scholar]
- 57.Zhang S, Chen X, Yang Y, Zhou X, Liu J, Ding F. Mol Cell Biochem. 2011;354:161–170. doi: 10.1007/s11010-011-0815-4. [DOI] [PubMed] [Google Scholar]
- 58.Zou W, Yan M, Xu W, Huo H, Sun L, Zheng Z, Liu X. J Neurosci Res. 2001;64:646–653. doi: 10.1002/jnr.1118. [DOI] [PubMed] [Google Scholar]
- 59.Pouokam E, Rehn M, Diener M. Eur J Pharmacol. 2009;615:40–49. doi: 10.1016/j.ejphar.2009.04.066. [DOI] [PubMed] [Google Scholar]
- 60.Hool LC, Corry B. Antioxid Redox Signal. 2007;9:409–435. doi: 10.1089/ars.2006.1446. [DOI] [PubMed] [Google Scholar]
- 61.Scheuer T, Catterall WA. Biochem Soc Trans. 2006;34:1299–1302. doi: 10.1042/BST0341299. [DOI] [PubMed] [Google Scholar]
- 62.Rao RK, Clayton LW. Biochem Biophys Res Commun. 2002;293:610–616. doi: 10.1016/S0006-291X(02)00268-1. [DOI] [PubMed] [Google Scholar]
- 63.Bogeski I, Bozem M, Sternfeld L, Hofer HW, Schulz I. Cell Calcium. 2006;40:1–10. doi: 10.1016/j.ceca.2006.03.003. [DOI] [PubMed] [Google Scholar]
- 64.Lin HJ, Wang X, Shaffer KM, Sasaki CY, Ma W. FEBS Lett. 2004;570:102–106. doi: 10.1016/j.febslet.2004.06.019. [DOI] [PubMed] [Google Scholar]
- 65.Chen X, Zhang Q, Cheng Q, Ding F. Mol Cel Biochem. 2009;332:85–93. doi: 10.1007/s11010-009-0177-3. [DOI] [PubMed] [Google Scholar]
- 66.Roediger B, Armati PJ. Neurobiol Dis. 2003;13:222– 229. doi: 10.1016/s0969-9961(03)00038-x. [DOI] [PubMed] [Google Scholar]
- 67.Choi K, Kim J, Kim GW, Choi C. Curr Neurovasc Res. 2009;6:213–222. doi: 10.2174/156720209789630375. [DOI] [PubMed] [Google Scholar]
- 68.Betarbet R, Sherer TB, MacKenzie G, Garcia-Osuna M, Panov AV, Greenamyre JT. Nat Neurosci. 2000;3:1301–1306. doi: 10.1038/81834. [DOI] [PubMed] [Google Scholar]
- 69.Freestone PS, Chung KK, Guatteo E, Mercuri NB, Nicholson LF, Lipski J. Eur J Neurosci. 2009;30:1849–1859. doi: 10.1111/j.1460-9568.2009.06990.x. [DOI] [PubMed] [Google Scholar]
- 70.Tada-Oikawa S, Hiraku Y, Kawanishi M, Kawanishi S. Life Sci. 2003;73:3277–3288. doi: 10.1016/j.lfs.2003.06.013. [DOI] [PubMed] [Google Scholar]
- 71.Radad K, Rausch WD, Gille G. Neurochem Int. 2006;49:379–386. doi: 10.1016/j.neuint.2006.02.003. [DOI] [PubMed] [Google Scholar]
- 72.Menke T, Gille G, Reber F, Janetzky B, Andler W, Funk RH, Reichmann H. Biofactors. 2003;18:65–72. doi: 10.1002/biof.5520180208. [DOI] [PubMed] [Google Scholar]
- 73.Moon Y, Lee KH, Park JH, Geum D, Kim K. J Neurochem. 2005;93:1199–1208. doi: 10.1111/j.1471-4159.2005.03112.x. [DOI] [PubMed] [Google Scholar]
- 74.Lane N. Nature. 2006;443:901–903. doi: 10.1038/443901a. [DOI] [PubMed] [Google Scholar]
- 75.Karu TI. IUBMB life. 2010;62:607–610. doi: 10.1002/iub.359. [DOI] [PubMed] [Google Scholar]
- 76.Eells JT, Wong-Riley MT, VerHoeve J, Henry M, Buchman EV, Kane MP, Gould LJ, Das R, Jett M, Hodgson BD, Margolis D, Whelan HT. Mitochondrion. 2004;4:559–567. doi: 10.1016/j.mito.2004.07.033. [DOI] [PubMed] [Google Scholar]
- 77.Shefer G, Partridge TA, Heslop L, Gross JG, Oron U, Halevy O. J Cell Sci. 2002;115:1461–1469. doi: 10.1242/jcs.115.7.1461. [DOI] [PubMed] [Google Scholar]
- 78.Lim WB, Kim JS, Ko YJ, Kwon H, Kim SW, Min HK, Kim O, Choi HR, Kim OJ. Lasers Surg Med. 2011;43:344–352. doi: 10.1002/lsm.21038. [DOI] [PubMed] [Google Scholar]
- 79.Rojas JC, Lee J, John JM, Gonzalez-Lima F. J Neurosci. 2008;28:13511–13521. doi: 10.1523/JNEUROSCI.3457-08.2008. [DOI] [PMC free article] [PubMed] [Google Scholar]
- 80.Moges H, Vasconcelos OM, Campbell WW, Borke RC, McCoy JA, Kaczmarczyk L, Feng J, Anders JJ. Lasers Surg Med. 2009;41:52–59. doi: 10.1002/lsm.20732. [DOI] [PubMed] [Google Scholar]
- 81.Huang YY, Chen AC, Carroll JD, Hamblin MR. Dose Response. 2009;7:358–383. doi: 10.2203/dose-response.09-027.Hamblin. [DOI] [PMC free article] [PubMed] [Google Scholar]
- 82.Huang YY, Sharma SK, Carroll J, Hamblin MR. Dose Response. 2011;9:602–618. doi: 10.2203/dose-response.11-009.Hamblin. [DOI] [PMC free article] [PubMed] [Google Scholar]


