

Abstract
Stimulation of neurons in the cuneiform nucleus (CnF) produces antinociception and cardiovascular responses that could be mediated, in part, by noradrenergic neurons that innervate the spinal cord dorsal horn. The present study determined the projections of neurons in the CnF to the pontine noradrenergic neurons in the A5, A6 (locus coeruleus), and A7 cell groups that are known to project to the spinal cord. Injections of the anterograde tracer, biotinylated dextran amine in the CnF of Sasco Sprague-Dawley rats labeled axons located near noradrenergic neurons that were visualized by processing tissue sections for tyrosine hydroxylase-immunoreactivity. Anterogradely-labeled axons were more dense on the side ipsilateral to the BDA deposit. Both A7 and A5 cell groups received dense projections from neurons in the CnF, whereas locus coeruleus received only a sparse projection. Highly varicose anterogradely-labeled axons from the CnF were found in close apposition to dendrites and somata of tyrosine hydroxylase-immunoreactive neurons in pontine tegmentum. Although definitive evidence for direct pathways from CnF neurons to the pontine noradrenergic cell groups requires ultrastructural analysis, the results of the present studies provide presumptive evidence of direct projections from neurons in the CnF to the pontine noradrenergic neurons of the A7, locus coeruleus, and A5 cell groups. These results support the suggestion that the analgesia and cardiovascular responses produced by stimulation of neurons in the CnF may be mediated, in part, by pontine noradrenergic neurons.
Keywords: A5 cell group, A7 cell group, Anterograde tracer, Biotinylated dextran amine, Locus coeruleus, Tyrosine hydroxylase
1. INTRODUCTION
The cuneiform nucleus (CnF) is a part of midbrain reticular formation (Jones, 1995) located ventral to the inferior colliculus, lateral to the mesencephalic trigeminal nucleus, medial to the lateral lemniscus, and dorsal to the pedunculopontine tegmental nucleus and the parabrachial region (Paxinos and Watson, 1998). The CnF receives extensive afferent projections from ascending spinomesencephalic tract neurons in laminae I (Lima and Coimbra, 1989; Menetrey et al. 1982; Swett et al. 1985; Veazey and Severin, 1982), V (Leah et al. 1988; Menetrey et al. 1982), IX (Menetrey et al. 1982; Leah et al. 1988), and its neurons are responsive to nociceptive stimuli (Carlson et al. 2004; Haghparast et al. 2010; Lanteri-Minet et al. 1994). Activation of CnF is associated with bradycardia, increased blood pressure, as well as antinociception. Specifically, electrical stimulation of sites in the CnF increases blood pressure (Lam and Verberne, 1997; Verberne, 1995; Verberne et al., 1997) and produces bradycardia (Korte et al., 1992). Bradycardia is also produced by microinjection of the excitatory amino acid glutamate or homocysteic acid into the CnF (Lin et al., 1987). Furthermore, both electrical (Guinan et al. 1989; Sandkuhler and Gebhart, 1984; Zemlan and Behbehani, 1988) and chemical stimulation of the CnF by microinjection of morphine (Haigler, 1976; Haigler and Mittleman, 1978) or glutamate (Carstens, 1988; Carstens et al. 1990) produces antinociception. Finally, microinjections of the nicotinic cholinergic agonist N-methylcarbachol in the CnF produces antinociception that can be blocked by intrathecal injection of alpha2-adrenoceptor antagonists (Iwamoto and Marion, 1993) suggesting that the antinociception produced by stimulation of neurons in the CnF is mediated, in part, by activating spinally projecting noradrenergic neurons.
Since neither the CnF nor the spinal cord dorsal horn contains noradrenergic neurons (Dahlstroem and Fuxe, 1964; Hokfelt et al. 1984), CnF neurons must either directly or indirectly activate spinally projecting noradrenergic neurons. Three noradrenergic cell groups, designated A5, A6 (locus coeruleus, LC), and A7 (Dahlstroem and Fuxe, 1964), are known to project to the spinal cord (Westlund and Coulter, 1980; Westlund et al. 1981, 1982, 1983). In Sasco Sprague-Dawley rats, the noradrenergic neurons in the A7 cell group are implicated in modulation of antinociception (Clark and Proudfit, 1991b; Holden et al. 1999; Nuseir and Proudfit, 2000; Yeomans et al. 1992; Yeomans and Proudfit, 1992). In addition, noradrenergic A5 neurons are implicated in mediation of cardiovascular responses, such as bradycardia (Byrum and Guyenet, 1987; Clark and Proudfit, 1993; Drye et al. 1990; Loewy et al. 1979a, 1979b, 1986), as well as antinociception (Burnett and Gebhart, 1991; Miller and Proudfit, 1990). Finally, descending neurons in the caudal LC innervate the spinal cord ventral horn (Bjorklund and Skagerberg, 1982, Clark and Proudfit, 1991a, Clark et al. 1991, Proudfit and Clark, 1991, Clark and Proudfit, 1992) and are implicated in control of motor reflexes (Fung et al. 1991). Thus, we hypothesized that CnF neurons project to the noradrenergic neurons of the A7 and A5 cell groups, but not the LC. Presented studies analyzed projections of neurons in the CnF to the A5, LC, and A7 cell groups in Sasco Sprague-Dawley rats by using anterograde tracer biotinylated dextran amine (BDA) combined with immunocytochemical detection of the catecholamine synthesizing enzyme tyrosine hydroxylase (TH) in the same tissue sections. Although definitive evidence for the existence of monosynaptic pathways requires ultrastructural analysis, the results of the present studies provide presumptive evidence for direct projections from neurons in the CnF to pontine noradrenergic cell groups.
2. MATERIALS AND METHODS
2.1. Animal Care and Use
The University of Illinois Animal Care and Use Committee approved the experimental protocols involving the use of vertebrate animals. Also, the experiments were conducted in accordance with the National Institutes of Health Guide for the Care and Use of Laboratory Animals (NIH Publications No. 80–23, revised 1996). All efforts were made to minimize animal suffering, reduce the number of animals used, and use alternatives to in vivo experiments.
2.2. Tracer Iontophoresis
The anterograde tracer BDA was iontophoretically deposited into sites in the CnF of twelve female Sprague-Dawley rats (250 – 350 g; Sasco, Madison, MI) and six of these cases were selected for the analysis (Fig. 1). Animals were deeply anesthetized with pentobarbital (50 mg/kg) and surgically prepared using aseptic techniques. No estrous stage was determined at the time of sacrifice. A glass micropipette with a tip diameter of 15–20 μm that was filled with a 10% solution of BDA (10,000 MW; D-1956, Molecular Probes, Eugene, OR) in saline was lowered to the appropriate target site in the CnF using the following stereotaxic coordinates: anterior 0.7 mm, ventral 4.3 mm, and lateral 1.7 mm with the incisor bar set at -2.5 mm. Coordinates are relative to the interaural line. BDA was iontophoretically ejected using 5–10 μA positive current pulses of 500 msec duration at a rate of 0.5 Hz for 20 minutes. The pipette remained in place for 60 seconds after the injection to minimize diffusion of the tracer along the electrode track. A period of 12 to 18 days was allowed for tracer transport and the animals were then deeply anesthetized with pentobarbital (50 mg/kg) and transcardially perfused using the method of Brandt and Apkarian (Brandt and Apkarian, 1992) as follows: 80 ml of physiological saline, followed by 100 ml of 4% paraformaldehyde in 0.1 M acetate buffer (pH 4.5), 300 ml of chilled 4% paraformaldehyde in 0.05 M borate buffer with 0.05% glutaraldehyde (pH 9.5), and 300 ml of chilled 10% sucrose solution in 0.1 M phosphate buffer (pH 7.6). Fixed brains were removed, cut into blocks, and stored in a solution of 20% sucrose in phosphate buffer (pH 7.6; 4°C) for several days.
Figure 1. Anterograde tracer injection sites.

(A) Camera lucida drawings of transverse brainstem sections from six cases analyzed that contained a BDA deposit in the CnF at the level of the inferior colliculus. Solid lines indicate the outlines of the representative transverse pontine sections and the cerebral aqueduct. The solid black area represents the dense core of the tracer deposit while the surrounding gray regions represent the area of dense anterogradely-labeled axons. Dashed lines identify the approximate location of some anatomical landmarks. The number above each section indicates the distance posterior to bregma in mm. (B) Photomicrograph of the representative BDA deposit outlined by rectangle. For abbreviations, see the list. Scale bar = 1 mm.
2.3. Tissue Processing
Tissue blocks were frozen, 40 μm transverse sections were cut on a cryostat microtome and free-floating sections were processed for visualization of BDA and TH-immunoreactivity using methods described in a previous report (Bajic and Proudfit, 1999). Briefly, sections were first processed for visualization of BDA by incubating tissue sections for 60 – 90 minutes in a solution containing the avidin-biotin complex (Elite Standard Vectastain ABC Kit, PK-6100, Vector Laboratories, Inc., Burlingame, CA) followed by two 10 minute rinses in phosphate-buffered saline (PBS, pH 7.6, 21°C) and a 2 minute rinse in 0.1 M Tris-buffered saline (TBS, pH 7.6). Blue-black nickel-enhanced peroxidase reaction product was produced by incubating tissue sections for 4–5 minutes in a solution containing 0.4 g of nickel ammonium sulfate, 15 mg of 3–3′ diaminobenzidine (Aldrich, Milwaukee, WI) and 16 μl of 30% hydrogen peroxide in 100 ml of 0.1 M TBS.
To visualize the location of tyrosine hydroxylase-immunoreative (TH-ir) neurons, brainstem sections were next incubated for 12 hours in a solution containing mouse antisera directed against TH (Incstar Corp., Stillwater, MN) that was diluted 1:1000 with PBS and contained 0.5% Triton X-100. After two 10 minutes rinses in PBS, tissue sections were incubated for 50 –60 minutes in a solution containing donkey anti-mouse secondary antibody (Jackson ImmunoResearch Laboratories, Inc., W. Grove, PA) diluted 1:100 with PBS that contained 0.5% Triton X-100, and were then rinsed twice in PBS. Finally, tissue sections were incubated for 50 – 60 minutes in a solution containing mouse peroxidase anti-peroxidase complex (ICN Pharmaceuticals, Inc., Costa Mesa, CA) diluted 1:150 with PBS that contained 0.5% Triton X-100, followed by two 10 minute rinses in PBS and a 2 minute rinse in 0.1 M TBS. Brown perioxidase reaction product was produced by incubating tissue sections for 3 minutes in a solution containing 22 mg of 3–3′ diaminobenzidine and 20 μl of 30% hydrogen peroxide in 100 ml of 0.1 M TBS. Sections were rinsed in PBS, mounted from 0.033 M phosphate buffer onto subbed slides, allowed to air-dry before dehydration in a series of ethanol, cleared in xylene, and coverslipped. This processing produced brown staining of TH-ir neurons in the noradrenergic cell groups that were clearly distinguishable from the blue-black staining of BDA-labeled axons that originate in the CnF.
2.4. Microscopic Analysis
The drawings, counting of terminals, and density calculations were done using a 10×, 20×, as well as 60× oil immersion microscope objective and digital imaging software Neurolucida (MicroBrightField Inc., Colchester, VT). The numbers of anterogradely labeled axons with varicosities that were closely apposed to TH-ir profiles were determined by counting axons apposed to labeled somata and dendrites on both the ipsi- and contralateral sides of noradrenergic cell groups of interest. Being that the LC and A5 cell groups extend along the rostro-caudal axis, in comparison to the more compact nucleus of the A7 cell group, we have divided both the LC and A5 to rostral and caudal divisions. Specifically, the rostrocaudal extent of the A7 cell group corresponded to plates 53–57 of Paxinos’ Atlas (Paxinos and Watson, 1998), while A5 cell group area of quantification corresponded to plates 56 to 62. The rostral A5 sections were located at the level of the motor nucleus of the trigeminal nerve while the caudal sections were located at the level of the superior olive. The rostrocaudal extend of the LC analysis corresponded to plates 55 to 61 of Paxinos’ Atlas (Paxinos and Watson, 1998). The rostral and caudal LC sections were located at the level of the motor nucleus of the trigeminal nerve and the genu of the seventh nerve, respectively. Thus, anterogradely-labeled axons were counted in at least five transverse sections along the rostro-caudal axis through both rostral and caudal divisions of the LC and the A5 cell groups, as well as throughout the A7 cell group.
Quantitative analysis included all 6 cases shown in Figure 1. Anterogradely-labeled axons were considered ‘closely apposed’ to TH-ir profiles if: (1) the axonal varicosity was located immediately adjacent to a TH-ir profile and both structures were in the same focal plane, or (2) the varicosity was located on the surface of a TH-ir profile and in the same focal plane as the labeled profile. The density of axons that were closely apposed to TH-ir somata and dendrites was determined by counting all axons with varicosities located within a circumscribed area that included all TH-ir profiles in each of the noradrenergic cell groups. Neurolucida software determined surface area of the initial circumscribed area of analysis. The surface area of regions of interest was in the range of 0.6–1.0 mm2, 0.2–0.9 mm2, and 0.6–1.2 mm2 for A7, LC, and A5 cell groups respectively. Thus, density values were expressed as the average number of varicosities per mm2/cell group/brain (Table 1). All anterogradely-labeled axons were counted on both the ipsilateral and contralateral sides of each defined area of the noradrenergic cell groups. Comparison of average number of total ipsilateral varicosities closely apposed to noradrenergic profiles among different cell groups was done using one-way ANOVA analysis (VassarStats: Website for Statistical Computation); p-value less than 0.05 was considered statistically significant. Neurolucida drawings containing outlines of coronal sections, anterogradely-labeled axons, and noradrenergic neurons were exported into the Corel Draw Graphic Suite using PC computer for final editing of presented schematic drawings. Specifically, although some of the drawings are shown at low magnification (Fig. 2), tracing was done at either 20× or 60× magnification. For the Fig. 3, lines were edited for selected colors in the Neurolucida file prior to exporting it to Corel Draw software (Corel Inc., Mountain View, CA). The latter was used to assemble different panels and to add lettering. No scanning of drawings was done at any time. We did not digitally edit any of the presented photomicrographs.
TABLE 1.
Average Density of Anterogradely Labeled Terminal Profiles Originating from the Cuneiform Nucleus in the A7, LC, and A5 Cell Groups
| Cell Groups | IPSILATERAL | CONTRALATERAL | ||||
|---|---|---|---|---|---|---|
| TH-ir somata | TH-ir dendrites | Non-TH-ir | TH-ir somata | TH-ir dendrites | Non-TH-ir | |
| A7 | 2.1 ± 0.9 | 25.9 ± 6.2 | 88.4 ± 12.7 | 0.0 | 6. 3 ± 1.4 | 37.0 ± 1. 3 |
| rLC | 0.0 | 23.1 ± 8.4 | 18.8 ± 4.9 | 0.0 | 7.9 ± 1.0 | 4.6 ± 1.4 |
| cLC | 0.0 | 8.1 ± 5.2 | 24.0 ± 9.8 | 0.0 | 6.6 ± 5.9 | 18.5 ± 4.8 |
| rA5 | 0.0 | 12.6 ± 1.4 | 77.1 ± 8.5 | 0.0 | 4.4 ± 1.2 | 13.8 ± 2.7 |
| cA5 | 0.2 ± 0.2 | 8.5 ± 1.4 | 26.6 ± 3.4 | 0.6 ± 0.4 | 2.5 ± 1.1 | 10.8 ± 1.6 |
Numbers represent average density (# axons with varicosities/mm2/brain) ± SEM of anterogradely labeled axonal profiles from five non-adjacent transverse sections through each catecholamine cell group (N=6 brains). Counted axonal profiles included those apposed to tyrosine hydroxylase-immunoreactive (TH-ir) somata or dendrites, and those not apposed to TH-ir profiles (non-TH-ir). Abbreviations: LC, locus coeruleus; r, rostral; c, caudal.
Figure 2. Distribution of BDA-labeled axon terminals and noradrenergic cell bodies in the brainstem.
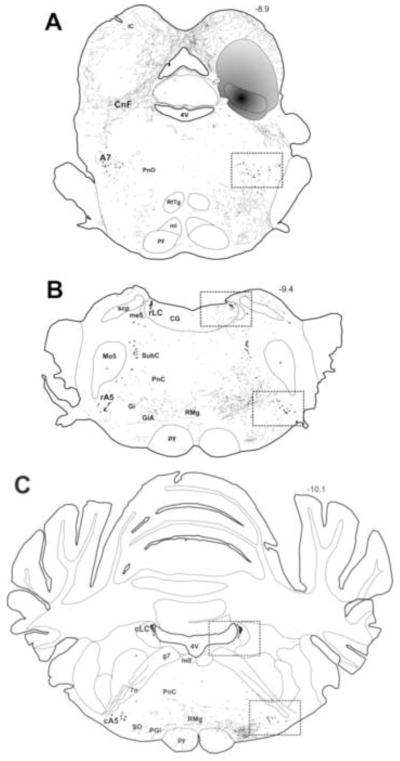
Camera lucida drawings illustrate the distribution of BDA-labeled axons that were labeled by the BDA deposit as shown in Figure 1B. Panel A illustrates distribution of anterogradely-labeled axons through the rostral pons, while Panels B and C show distribution in the caudal pons. The areas that were selected for detailed quantitative analysis are enclosed within the dashed squares and include the central region of the A7 cell group (A), the rostral parts of the LC and the A5 cell groups (B), the caudal divisions of the LC and the A5 cell groups (C). For detailed description of regions of interest, refer to the Methods section. The gray shaded region represents an area that contained a very high density of anterogradely-labeled axons that were too numerous to accurately represent in the drawing. Fine black lines represent only the anterogradely-labeled axons. Irregularly shaped black circles represent noradrenergic neurons. No tyrosine hydroxylase-immunoreactive dendrites were drawn. Dashed lines indicate the approximate location of some anatomical landmarks. The number above the sections indicates the distance posterior to bregma in mm. For abbreviations, see the list.
Figure 3. Camera lucida drawings of BDA-labeled axons and noradrenergic neurons of the brainstem.

(A) Schematic camera lucida drawing illustrates efferent neuronal pathways from the cuneiform nucleus (CnF) at the level of the inferior colliculus. Representative BDA labeling in the A7 cell group (B), rostral and caudal subregions of the LC (C and D), and rostral and caudal subregions of the A5 cell group (E and F). BDA-labeled axons appear as thin tortuous blue lines, whereas tyrosine hydroxylase-immunoreactive (TH-ir; noradrenergic) somata and dendrites are represented by red profiles. The open arrows indicate examples of anterogragely-labeled axons (blue) closely apposed to TH-ir profiles, either somata or dendrites. Abbreviations: 4V, forth ventricle; Aq, cerebral aqueduct (Sylvius); ml, medial lemniscus; PAG, periaqueductal gray; py, pyramidal tract; tth, trigeminothalamic tract. Scale bars = 100 μm.
3. RESULTS
3.1. Anterograde Tracer Deposits in the CnF
The six cases that were selected for analysis had deposits of the anterograde tracer BDA centered in the CnF at the level of the inferior colliculus (Fig. 1). The solid black area represents the size of the effective tracer deposit whereas surrounding gray area represents a dense concentration of BDA-labeled axons exiting from neurons at the injection site. Most of the BDA deposits were similar in size, shape and location and produced similar patterns of anterograde labeling. We also included a case with one smaller deposit (Fig. 1). Although the density of labeling was less, the labeling pattern was similar despite the smaller size of the injection.
3.2. Projections of CnF Neurons to the Pontine Noradrenergic Cell Groups
The BDA deposits in the CnF, as illustrated in Fig. 1, produced predominant anterograde labeling of axons on the ipsilateral side, although significant, but less intense labeling was also present on the contralateral side throughout the rostrocaudal axis of the pons (Fig. 2; Table 1). Of all the noradrenergic cell groups analyzed, the highest density of axons was found in the dorsolateral pontine tegmentum in the area that includes the A7 cell group (Fig. 2A and 3B). In the caudal pons, anterogradely-labeled axons were also found in the area that includes the rostral A5 cell group (Fig. 2 and 3). In contrast, caudal A5, and LC along the rostrocaudal axis received only sparse projections from neurons in the CnF (Fig. 2 and 3).
3.2.1. Projections of CnF neurons to the A7 cell group
The BDA deposits into the CnF produced a moderate density of anterogradely-labeled axons in the area of the noradrenergic neurons in the A7 cell group (Fig. 3B). This area appeared to be a terminal field that contained some branching axons, many of which exhibited numerous varicosities. It was estimated that in the ipsilateral A7 cell group, about 23% of all anterogradely-labeled varicosities were closely apposed to TH-ir profiles (Fig. 3B and 4A; Tables 1 and 2). Approximately 95% of the anterogradely-labeled varicosities that were closely apposed to TH-ir profiles were apposed to noradrenergic dendrites (Fig. 3B; Table 1 and 3), whereas only about 5% appeared to be apposed to noradrenergic somata (Fig. 3B and 4A; Table 1 and 3).
Figure 4. Representative photomicrographs of BDA-labeled axons and noradrenergic neurons in the pontine noradrenergic cell groups.
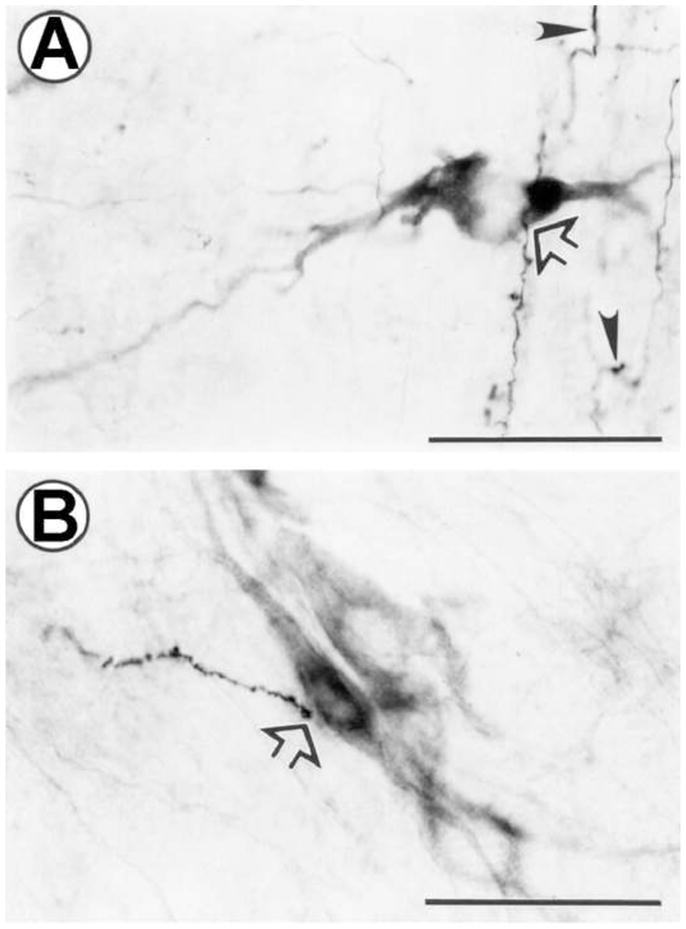
Representative BDA labeling in the A7 (A), and the caudal A5 (B) cell groups. Open arrows indicate examples of axon varicosities closely apposed to tyrosine hydroxylase-immunoreactive neurons. Anterogradely-labeled axons that were not closely opposed to TH-ir profiles exhibited characteristics of terminal boutons (solid arrowheads). Scale bars = 50 μm.
TABLE 2.
Percentage of Anterogradely Labeled Terminal Profiles Originating from the Cuneiform Nucleus in the A7, LC, and A5 Cell Groups
| Cell Groups | IPSILATERAL | CONTRALATERAL | ||
|---|---|---|---|---|
| TH-ir | Non-TH-ir | TH-ir | Non-TH-ir | |
| A7 | 22.9 ± 4.1 | 77.1 ± 4.1 | 23.7 ± 4.7 | 76. 3 ± 4.7 |
| rLC | 52.3 ± 3.5 | 47.7 ± 3.5 | 64.9 ± 4.1 | 35.1 ± 4.1 |
| cLC | 25.0 ± 10.8 | 75.0 ± 10.8 | 50.0 ± 27.4 | 50.0 ± 27.4 |
| rA5 | 14.5 ± 1.8 | 85.5 ± 1.8 | 25.5 ± 8.3 | 74.5 ± 8. 3 |
| cA5 | 24.2 ± 2.2 | 80.1 ± 5.4 | 17.5 ± 6.9 | 82.5 ± 6.9 |
Values represent percent density (% axons with varicosities/mm2/brain) ± SEM of anterogradely labeled axonal profiles closely apposed to either (1) tyrosine hydroxylase-immunoreactive (TH-ir) neurons or (2) areas that do not contain any catecholamine labeling (non-TH-ir) in the ipsilateral and the contralateral side of each noradrenergic cell groups. These estimates are mean values of the densities determined in five non-adjacent transverse sections through each noradrenergic cell group (N=6 brains; see Table 1). Abbreviations: LC, locus coeruleus; r, rostral; c, caudal.
TABLE 3.
Percentage of Anterogradely Labeled Terminal Profiles Originating from the Cuneiform Nucleus Apposed to Noradrenergic Somata and Dendrites in the A7, LC, and A5 Cell Groups
| Cell Groups | IPSILATERAL | CONTRALATERAL | ||
|---|---|---|---|---|
| Somata | Dendrites | Somata | Dendrites | |
| A7 | 5.6 ± 2.4 | 94.4 ± 2.4 | 0.0 | 100 |
| rLC | 0.0 | 100 | 0.0 | 100 |
| cLC | 0.0 | 100 | 0.0 | 100 |
| rA5 | 0.0 | 100 | 0.0 | 100 |
| cA5 | 1.9 ± 1.9 | 98.1 ± 1.9 | 32.0 ± 7.5 | 68.0 ± 23.3 |
Values represent percent density (% axons with varicosities/mm2/brain) ± SEM of anterogradely labeled terminal varicosity profiles closely apposed to tyrosine hydroxylase-immunoreactive (TH-ir) somata or dendrites. These estimates are mean values of the densities determined in five non-adjacent transverse sections through each noradrenergic cell group (N=6 brains; see Table 1). Abbreviations: LC, locus coeruleus; r, rostral; c, caudal.
3.2.2. Projections of CnF neurons to the LC
The BDA deposit into the CnF labeled only a small number of axons in the area of the noradrenergic neurons in both the rostral and the caudal subregions of the LC, including the periocoerulear regions (Fig. 2B and C). More specifically, the area that was analyzed included the noradrenergic somata in the LC proper, and both the medial pericoerulear region, immediately adjacent to the LC proper, and the lateral pericoerulear region, medial to the ventral parabrachial nucleus (Aston-Jones, 2004). Despite a very low density, about 52% of anterogradely-labeled varicosities in the area of the rostral LC were near TH-ir processes, whereas the remaining 48% were not closely apposed to TH-ir neurons (Fig. 3C; Table 1 and 2). Such results suggest that while it is of lower density, the CnF projection to LC seems to be more specifically targeting the noradrenergic neurons. Furthermore, the average number of total anterogradely-labeled varicosities closely apposed to the ipsilateral noradrenergic profiles in the LC was not statistically different from the average total number of other groups (Table 1; column 2; F (5, 24)=2.38, p=0.06). In the caudal LC, only about 25% of anterogradely-labeled varicosities were closely apposed to TH-ir processes (Fig. 3D; Table 1 and 2). All of these anterogradely-labeled varicosities that were closely apposed to TH-ir profiles in both the rostral and the caudal regions of the noradrenergic LC neurons were apposed to noradrenergic dendrites (Table 1 and 3).
3.3.3. Projections of CnF neurons to the A5 cell group
The BDA deposits into the CnF produced a relatively significant density of anterogradely-labeled axons in the area of the TH-ir somata and dendrites that comprise the rostral A5 cell group (Fig. 2B and 3E; Table 1). Although they were evenly distributed along the rostro-caudal axis of the A5 cell group, they were less numerous in its caudal subdivision (Fig. 2C and 3F; Table 1). This area appeared to be a terminal field that contained some branching axons (Fig. 3E and F) and axons exhibiting numerous varicosities (Fig. 4B). It was estimated that 14% and 24% of anterogradely-labeled axons were closely apposed to TH-ir profiles in the rostral and caudal subregions of the A5 cell group, respectively (Table 2). In the rostral A5 cell group, these were apposed only to TH-ir dendrites (Table 1 and 3). In the caudal A5 cell group, only about 2% of these appeared apposed to noradrenergic somata (Fig. 4B; Table 1 and 3).
4. DISCUSSION
The major goal of the present anatomical studies was to determine descending efferent projections of the neurons in the CnF using the anterograde tracer, BDA, and their relation to descending pontine noradrenergic neurons: A5, A6 (LC), and A7 cell groups. High density of varicose axons anterogradely-labeled from the CnF were found in the dorsolateral and ventrolateral pontine tegmentum, regions of A7 and A5 cell groups, respectively. This light microscopic study also provides presumptive evidence of direct projections from neurons in the CnF to all three pontine noradrenergic cell groups analyzed.
4.1. Methodological Considerations
The main limitation of the present study is inherent to all anterograde transport studies and these include the spread of the anterograde tracer from the injection site and uptake by neurons in neighboring brain areas, as well as uptake by damaged fibers that pass through the site of the tracer deposit. In this study, BDA injections were confined to the CnF to eliminate labeling of surrounding brain areas (Fig. 1) such as periaqueductal gray and reticular formation of the midbrain. Glass micropipettes with small tip diameters were used to produce minimal neuronal damage while injecting the tracer. An additional potentially confounding factor is the retrograde labeling of neurons with axons that project to the tracer injection site, and subsequent anterograde transport in axon collaterals (Brandt and Apkarian, 1992; Veenman et al. 1992; Wouterlood and Jorritsma-Byham, 1993). Although a systematic study of this retrograde-anterograde transport was not done, only a small number of retrogradely labeled neurons were observed, and these were randomly distributed in the brainstem and were not concentrated in any particular region. Thus, it is unlikely that these scattered retrogradely labeled neurons provide a significant contribution to the labeling of axons and terminals seen in the noradrenergic cell groups after anterograde tracer deposits in the CnF. Future studies should include a novel anterograde tracing technique involving GFP-containing recombinant adeno-associated virus vector that virtually has no retrograde tracing. Although showing the same pattern of distribution, it is considered superior to tracers such as biotinylated dextrans and Phaseolus vulgaris leucoagglutinin (Chamberlin et al. 1998; Gautron et al. 2010). Finally, due to limitation of light microscopic resolution, presented quantitative analysis might be overestimation of the actual contacts with noradrenergic neurons. This should be elucidated by future studies using electron microscopic approach.
4.2. Projections of Neurons Originating from the CnF to Pontine Noradrenergic Cell Groups
Our findings provide a light microscopic analysis of efferent projections from neurons in the CnF to the pontine A7 and the rostral A5 cell groups, with only minor projections to the LC and the caudal A5. The results of the present report are consistent with several additional studies that used a variety of tracing methods. For example, previous tracing studies using deposits of the retrograde tracer Fluoro-Gold in the A7 cell group found a large number of retrogradely labeled neurons in the CnF (Holden and Proudfit, unpublished observations) which is consistent with a projection from the CnF to the A7 cell group. Similar efferent projections from CnF were reported using a different anterograde tracer, Phaseolus vulgaris leucoagglutinin (PHA-L) in the rat (Korte et al. 1992). In contrast to our findings, this report also described a relatively dense projection to the LC after tracer injection in the CnF at the level of the inferior colliculus. Furthermore, studies that used wheat germ agglutinin conjugated to horseradish peroxidase (WGA-HRP) (Bernard et al. 1989) or anterograde transport of tritiated amino acids (Zemlan and Behbehani, 1988), did not find any significant projections from CnF neurons at the level of inferior colliculus to any of the pontine noradrenergic cell groups in the rat. Similar studies in the cat have also provided conflicting results. For example, an autoradiographic study in cat by Edwards (Edwards, 1975) demonstrated dense projections of neurons in the CnF to the LC and A7, but not the A5 cell group, whereas a similar study (Steeves and Jordan, 1984) did not find projections to any of the pontine noradrenergic cell groups.
The differences among these reports and our findings may be partly explained by methodological differences. We identified noradrenergic neurons by visualizing TH-ir profiles in the pontine noradrenergic cell groups, while the other reports cited in the preceding paragraph did not perform labeling of noradrenergic neurons. In addition, several of these conflicting studies used tritiated amino acids to determine efferent projections form the CnF and the resolution of this method does not allow the definitive identification of terminal fields. However, the anterograde labeling patterns produced by tritiated amino acids and PHA-L are quite similar anterograde labeling patterns in a variety of brain areas (Ter Horst et al. 1984). In addition, both PHA-L and BDA also produce similar anterograde labeling patterns in a variety of brain areas (Dolleman-Van der Weel et al. 1994; Wouterlood and Jorritsma-Byham, 1993). Furthermore, studies from our group have demonstrated virtually identical labeling patterns when PHA-L and BDA were used to determine the efferent projections of neurons from the ventromedial medulla (Clark and Proudfit, 1991c; Holden and Proudfit, 1998) to the A7 and LC cell groups. Thus, differences in projections from the CnF to the pontine noradrenergic cell groups may reflect true differences in neuronal pathways rather than methodological differences. This conclusion is supported by previous reports from our laboratory that described fundamental differences in descending projection of noradrenergic neurons to the spinal cord (Clark and Proudfit, 1991a; Clark et al. 1991; Proudfit and Clark, 1991; Clark and Proudfit, 1992), as well as differences in the physiological function of these neurons (West et al., 1993; Graham et al. 1997). For summary of anatomical pathways strain differences, see reviews by Proudfit (1992, 2002).
4.3. Functional Significance of CnF Projections to the Pontine Noradrenergic Cell Groups
4.3.1. Projections to the A7 cell group
In this study we report that the A7 cell group receives the most dense projection from neurons in the CnF in comparison to LC and the A5 cell groups (Table 1). Several anatomical studies demonstrated that the descending axons arising form A7 neurons innervate the spinal cord dorsal horn (laminae I–IV) (Clark and Proudfit, 1991a, b; Proudfit and Clark, 1991; Clark and Proudfit, 1992; Proudfit, 1992), where many second order nociceptive neurons are located (Light, 1992). The role of the A7 cell group in the modulation of nociception was further supported by reports, which demonstrated that both electrical (Yeomans et al. 1992) and chemical (Holden et al. 1999; Nuseir and Proudfit, 2000; Yeomans and Proudfit, 1992) stimulation of A7 neurons produce antinociception and inhibition of nociceptive dorsal horn neurons. Antinociception produced by chemical stimulation of neurons in the CnF can be blocked by intrathecal injection of alpha2-adrenoceptor antagonists (Iwamoto and Marion, 1993). Thus, antinociception produced by stimulation of neurons in the CnF could be mediated, at least in part, by noradrenergic A7 neurons. Considering that only about 23% of all anterogradely-labeled axons from the CnF identified in the area of the A7 cell group were found in the close apposition to noradrenergic neurons (Table 2), future ultrastructural studies will be required to provide definitive evidence for this proposed pathway. Furthermore, neurochemical analysis of the neuropil surrounding noradrenergic neurons of the A7 cell group in relation to remaining CnF efferents remains to be investigated.
4.3.2. Projections to the A5 cell group
As demonstrated in this study, rostral subdivision of the A5 cell group in Sasco Sprague-Dawley receives significant innervation from neurons in the CnF (Table 1). Spinally-projecting neurons of the A5 cell group were demonstrated to innervate the intermediolateral cell column in thoracic spinal cord segments (Bruinstroop et al. 2012; Byrum and Guyenet, 1987; Clark and Proudfit, 1993; Loewy et al. 1979b; Romagnano et al. 1991), as well as the spinal cord dorsal horn (laminae IV–VII) (Bruinstroop et al. 2012; Clark and Proudfit, 1993,) where numerous nociceptive neurons are located (Light, 1992). The functional implication of descending projections of the A5 cell group in mediation of sympathoinhibition and antinociception is further supported by several studies. Specifically, stimulation of A5 neurons using microinjection of glutamate, produces a depressor response and bradycardia (Burnett and Gebhart, 1991; Stanek et al. 1984,). Furthermore, electrical stimulation of sites near the A5 cell group can produce antinociception that is reduced by intrathecal injection of alpha2-adrenoceptor antagonists (Burnett and Gebhart, 1991; Miller and Proudfit, 1990). It was demonstrated that stimulation of neurons in the CnF leads not only to antinociception that can be blocked by intrathecal injection of alpha2-adrenoceptor antagonists (Iwamoto and Marion, 1993), but produces cardiovascular responses, as well. Specifically, electrical stimulation of sites in the CnF increases blood pressure (Lam and Verberne, 1997; Verberne, 1995; Verberne et al. 1997) and produces bradycardia (Korte et al. 1992). Bradycardia is also produced by microinjection of the excitatory amino acid glutamate or homocysteic acid into the CnF (Lin et al. 1987). CnF sends major descending innervation to the medullary gigantocellular reticular nucleus, as well as to the medullary motor nucleus of the vagus and the nucleus tractus solitarius (Korte et al., 1992) that probably mediate the bradycardia produced by CnF stimulation. However, demonstrated projections of neurons in the CnF to the A5 cell group suggests that the cardiovascular and antinociceptive effects produced by stimulation of neurons in the CnF may also be mediated, at least in part, by activation of descending A5 neurons. Since only about 15% of identified anterogradely labeled axons originating from CnF in the region of the A5 cell group were in close apposition to noradrenergic neurons, presumed direct pathway might only play a minor role. Therefore, future studies should elucidate a complex anatomical and functional interplay of CnF projections to the A5 cell group (e.g. disinhibition of spinally projecting noradrenergic neurons of the A5 cell group) and the role of the A5 cell group as a possible, indirect relay of the CnF cardiovascular and antinociceptive effects. Finally, the exact spinal projection target of noradrenergic neurons comprising the A5 cell group targeted by CnF efferents should also be determined.
4.3.3. Projections to the LC cell group
Neurons of the LC receive only minor projections from the CnF (Table 1). These sparse projections are in accordance with previously reported restricted and selected input to the LC (Aston-Jones et al. 1986). Noradrenergic neurons in the rostral part of the LC have extensive ascending forebrain projections (Levitt and Moore, 1979; Mason and Fibiger, 1979; Swanson, 1976), and activation of these neurons produces enhanced vigilance, arousal, and attention to sensory stimuli as well as increased pressor response (Aston-Jones et al. 1984, 1991a, 1991b). Specifically, electrical stimulation of LC was reported to elicit pressor responses (Chida et al. 1983; Gurtu et al. 1984; Kawamura et al. 1978; Ward and Gunn, 1976a, b). Furthermore, pharmacological alteration of LC activity also leads to changes in blood pressure (Pant et al. 1983; Perlman and Guideri, 1984; Valentino et al. 1986). Despite being a minor pathway, CnF projection appears to target noradrenergic neurons in the LC, considering that about 52% of those anterogradely-labeled axons were found in close apposition to noradrenergic dendrites in the rostral LC (Table 2). Thus, it is possible that increased blood pressure associated with activation of neurons in the CnF (Lam and Verberne, 1997; Verberne, 1995; Verberne et al. 1997) could be mediated, only in part, by activation of the rostral LC. Finally, there is extensive anatomical (Clark and Proudfit, 1991a, 1992; Clark et al. 1991; Commissiong et al. 1978; Proudfit and Clark, 1991; Sluka and Westlund, 1992; Westlund et al. 1983) and electrophysiological evidence (Chan et al. 1986; Fung and Barnes, 1987; Fung et al. 1991, 1994; Lai et al. 1989; Strahlendorf et al. 1980) that caudal LC neurons regulate the excitability of somatic motoneurons in the spinal cord ventral horn. Indeed, future studies are needed to evaluate behavioral roles of presented minor pathway from CnF to LC neurons.
5. CONCLUSIONS
In summary, presented results suggest that CnF efferents project to the ipsilateral A7 and rostral A5 cell groups, with very minor projections to the LC and the caudal A5. These light microscopic observations provide presumptive anatomical evidence that the antinociception and bradycardia produced by activation of neurons located in the CnF could be mediated, at least in part, by pontine noradrenergic neurons located in the A7, A6 (LC) and A5 cell groups. Future combined ultrastructural labeling studies should investigate the existence of synapses between anterogradely-labeled terminals from CnF neurons and noradrenergic neurons. In addition, combination of both anterograde and retrograde labeling techniques are required to demonstrate that neurons originating form the CnF innervate noradrenergic neurons that project to different regions of the spinal cord.
Highlights.
Neurons in the CnF project to the A7 and the rostral A5 cell groups.
Both noradrenergic and non-catecholamine neurons of the A7 and A5 cell groups receive input from the CnF.
CnF sends very minor projections to the LC (A6) and the caudal A5 cell groups.
Acknowledgments
This work was supported by USPHS grant DAO3980 from the National Institute on Drug Abuse.
ABBREVIATIONS
- 4V
fourth ventricle
- 7n
facial nerve
- A5
A5 cell group
- A6
A6 cell group (locus coeruleus)
- A7
A7 cell group
- Aq
cerebral aqueduct (Sylvius
- BDA
biotinylated dextran amine
- cA5
caudal A5 cell group
- CG
central gray
- cLC
caudal locus coeruleus
- CnF
cuneiform nucleus
- g7
genu facial nerve
- Gi
gigantocellular reticular nucleus
- GiA
gigantocellular reticular nucleus pars alpha
- IC
inferior colliculus
- LC
locus coeruleus (A6 cell group)
- lfp
longitudinal fasciculus of the pons
- ll
lateral lemniscus
- me5
mesencephalic trigeminal tract
- ml
medial lemniscus
- mlf
medial longitudinal fasciculus
- Mo5
motor trigeminal nucleus
- PAG
periaqueductal gray
- PBS
phosphate-buffered saline
- PGi
paragigantocellular reticular nucleus
- PHA-L
Phaseolus vulgaris leucoagglutinin
- Pn
pontine nuclei
- PnC
pontine reticular nucleus, caudal part
- PnO
pontine reticular nucleus, oral part
- py
pyramidal tract
- rA5
rostral A5 cell group
- rLC
rostral locus coeruleus
- RMg
nucleus raphe magnus
- RtTg
pontine reticulotegmental nuclei
- scp
superior cerebellar peduncle
- SO
superior olive
- SubC
subcoeruleus nucleus
- TBS
TRIS-buffered saline
- TH
tyrosine hydroxylase
- TH-ir
tyrosine hydroxylase-immunoreactive
- tth
trigeminothalamic tract
- WGA-HRP
germ agglutinin conjugated to horseradish peroxidase
Footnotes
ETHICAL STATEMENT
Presented work has been done according to the Ethics in publishing and Ethical guidelines for journal publication, which were reviewed at http://www.elsevier.com/publishingethics and http://www.elsevier.com/ethicalguidelines. In summary, this is an original research, which was previously published only in a form of abstract and a doctorate thesis of the first Author. Authorship is limited only to those individuals who have made a significant contribution to the conception, design, execution, or interpretation of the reported study, while the financial support is listed under Acknowledgements. Authors have also made a statement in the Materials and Methods that the experiments were conducted in accordance with the National Institutes of Health Guide for the Care and Use of Laboratory Animals (NIH Publications No. 80-23, revised 1996). Finally, authors have disclosed that they do not have any financial or other substantive conflict of interest that could have construed to influence the results or interpretation of this manuscript.
Publisher's Disclaimer: This is a PDF file of an unedited manuscript that has been accepted for publication. As a service to our customers we are providing this early version of the manuscript. The manuscript will undergo copyediting, typesetting, and review of the resulting proof before it is published in its final citable form. Please note that during the production process errors may be discovered which could affect the content, and all legal disclaimers that apply to the journal pertain.
LITERATURE CITED
- Aston-Jones G. Locus coeruleus, A5 and A7 noradrenergic cell groups. In: Paxinos G, editor. The Rat Nervous System. Elsevier Academic Press; Amsterdam: 2004. pp. 259–294. [Google Scholar]
- Aston-Jones G, Chiang C, Alexinsky T. Discharge of noradrenergic locus coeruleus neurons in behaving rats and monkeys suggests a role in vigilance. Prog Brain Res. 1991a;88:501–520. doi: 10.1016/s0079-6123(08)63830-3. [DOI] [PubMed] [Google Scholar]
- Aston-Jones G, Ennis M, Pieribone VA, Nickell WT, Shipley MT. The brain nucleus locus coeruleus: restricted afferent control of a broad efferent network. Science. 1986;234:734–737. doi: 10.1126/science.3775363. [DOI] [PubMed] [Google Scholar]
- Aston-Jones G, Foote SL, Bloom FE. Anatomy and physiology of locus coeruleus neurons: functional implications. Williams & Wilkins; Baltimore: 1984. [Google Scholar]
- Aston-Jones G, Shipley MT, Chouvet G, Ennis M, van Bockstaele E, Pieribone V, Shiekhattar R, Akaoka H, Drolet G, Astier B, et al. Afferent regulation of locus coeruleus neurons: anatomy, physiology and pharmacology. Prog Brain Res. 1991b;88:47–75. doi: 10.1016/s0079-6123(08)63799-1. [DOI] [PubMed] [Google Scholar]
- Bajic D, Proudfit HK. Projections of neurons in the periaqueductal gray to pontine and medullary catecholamine cell groups involved in the modulation of nociception. J Comp Neurol. 1999;405:359–379. [PubMed] [Google Scholar]
- Bernard JF, Peschanski M, Besson JM. Afferents and efferents of the rat cuneiformis nucleus: an anatomical study with reference to pain transmission. Brain Res. 1989;490:181–185. doi: 10.1016/0006-8993(89)90449-6. [DOI] [PubMed] [Google Scholar]
- Bjorklund A, Skagerberg G. Descending monoaminergic projections to the spinal cord. In: Sjolund B, Bjorklund A, editors. Brain Stem Control of Spinal Mechanisms: 1st: Symposium Proceedings (Fernstrom Foundation) Elsevier; Amsterdam: 1982. pp. 55–88. [Google Scholar]
- Brandt HM, Apkarian AV. Biotin-dextran: a sensitive anterograde tracer for neuroanatomic studies in rat and monkey. J Neurosci Methods. 1992;45:35–40. doi: 10.1016/0165-0270(92)90041-b. [DOI] [PubMed] [Google Scholar]
- Bruinstroop E, Cano G, Vanderhorst VG, Cavalcante JC, Wirth J, Sena-Esteves M, Saper CB. Spinal projections of the A5, A6 (locus coeruleus), and A7 noradrenergic cell groups in rats. J Comp Neurol. 2012;520:1985–2001. doi: 10.1002/cne.23024. [DOI] [PMC free article] [PubMed] [Google Scholar]
- Burnett A, Gebhart GF. Characterization of descending modulation of nociception from the A5 cell group. Brain Res. 1991;546:271–281. doi: 10.1016/0006-8993(91)91491-i. [DOI] [PubMed] [Google Scholar]
- Byrum CE, Guyenet PG. Afferent and efferent connections of the A5 noradrenergic cell group in the rat. J Comp Neurol. 1987;261:529–542. doi: 10.1002/cne.902610406. [DOI] [PubMed] [Google Scholar]
- Carlson JD, Iacono RP, Maeda G. Nociceptive excited and inhibited neurons within the pedunculopontine tegmental nucleus and cuneiform nucleus. Brain Res. 2004;1013:182–187. doi: 10.1016/j.brainres.2004.03.069. [DOI] [PubMed] [Google Scholar]
- Carstens E. Inhibition of rat spinothalamic tract neuronal responses to noxious skin heating by stimulation in midbrain periaqueductal gray or lateral reticular formation. Pain. 1988;33:215–224. doi: 10.1016/0304-3959(88)90093-0. [DOI] [PubMed] [Google Scholar]
- Carstens E, Hartung M, Stelzer B, Zimmermann M. Suppression of a hind limb flexion withdrawal reflex by microinjection of glutamate or morphine into the periaqueductal gray in the rat. Pain. 1990;43:105–112. doi: 10.1016/0304-3959(90)90055-I. [DOI] [PubMed] [Google Scholar]
- Chamberlin NL, Du B, de Lacalle S, Saper CB. Recombinant adeno-associated virus vector: use for transgene expression and anterograde tract tracing in the CNS. Brain Res. 1998;793:169–175. doi: 10.1016/s0006-8993(98)00169-3. [DOI] [PMC free article] [PubMed] [Google Scholar]
- Chan JY, Fung SJ, Chan SH, Barnes CD. Facilitation of lumbar monosynaptic reflexes by locus coeruleus in the rat. Brain Res. 1986;369:103–109. doi: 10.1016/0006-8993(86)90517-2. [DOI] [PubMed] [Google Scholar]
- Chida K, Kawamura H, Hatano M. Participation of the nucleus locus coeruleus in DOCA-salt hypertensive rats. Brain Res. 1983;273:53–58. doi: 10.1016/0006-8993(83)91093-4. [DOI] [PubMed] [Google Scholar]
- Clark FM, Proudfit HK. The projection of locus coeruleus neurons to the spinal cord in the rat determined by anterograde tracing combined with immunocytochemistry. Brain Res. 1991a;538:231–245. doi: 10.1016/0006-8993(91)90435-x. [DOI] [PubMed] [Google Scholar]
- Clark FM, Proudfit HK. The projection of noradrenergic neurons in the A7 catecholamine cell group to the spinal cord in the rat demonstrated by anterograde tracing combined with immunocytochemistry. Brain Res. 1991b;547:279–288. doi: 10.1016/0006-8993(91)90972-x. [DOI] [PubMed] [Google Scholar]
- Clark FM, Proudfit HK. Projections of neurons in the ventromedial medulla to pontine catecholamine cell groups involved in the modulation of nociception. Brain Res. 1991c;540:105–115. doi: 10.1016/0006-8993(91)90496-i. [DOI] [PubMed] [Google Scholar]
- Clark FM, Proudfit HK. Anatomical evidence for genetic differences in the innervation of the rat spinal cord by noradrenergic locus coeruleus neurons. Brain Res. 1992;591:44–53. doi: 10.1016/0006-8993(92)90976-g. [DOI] [PubMed] [Google Scholar]
- Clark FM, Proudfit HK. The projections of noradrenergic neurons in the A5 catecholamine cell group to the spinal cord in the rat: anatomical evidence that A5 neurons modulate nociception. Brain Res. 1993;616:200–210. doi: 10.1016/0006-8993(93)90210-e. [DOI] [PubMed] [Google Scholar]
- Clark FM, Yeomans DC, Proudfit HK. The noradrenergic innervation of the spinal cord: differences between two substrains of Sprague-Dawley rats determined using retrograde tracers combined with immunocytochemistry. Neurosci Lett. 1991;125:155–158. doi: 10.1016/0304-3940(91)90015-l. [DOI] [PubMed] [Google Scholar]
- Commissiong JW, Hellstrom SO, Neff NH. A new projection from locus coeruleus to the spinal ventral columns: histochemical and biochemical evidence. Brain Res. 1978;148:207–213. doi: 10.1016/0006-8993(78)90391-8. [DOI] [PubMed] [Google Scholar]
- Dahlstroem A, Fuxe K. Evidence for the Existence of Monoamine-Containing Neurons in the Central Nervous System. I Demonstration of Monoamines in the Cell Bodies of Brain Stem Neurons. Acta Physiol Scand Suppl. 1964;232:231–255. [PubMed] [Google Scholar]
- Dolleman-Van der Weel MJ, Wouterlood FG, Witter MP. Multiple anterograde tracing, combining Phaseolus vulgaris leucoagglutinin with rhodamine- and biotin-conjugated dextran amine. J Neurosci Methods. 1994;51:9–21. doi: 10.1016/0165-0270(94)90021-3. [DOI] [PubMed] [Google Scholar]
- Drye RG, Baisden RH, Whittington DL, Woodruff ML. The effects of stimulation of the A5 region on blood pressure and heart rate in rabbits. Brain Res Bull. 1990;24:33–39. doi: 10.1016/0361-9230(90)90286-9. [DOI] [PubMed] [Google Scholar]
- Edwards SB. Autoradiographic studies of the projections of the midbrain reticular formation: descending projections of nucleus cuneiformis. J Comp Neurol. 1975;161:341–358. doi: 10.1002/cne.901610306. [DOI] [PMC free article] [PubMed] [Google Scholar]
- Fung SI, Chan JY, Manzoni D, White SR, Lai YY, Strahlendorf HK, Zhuo H, Liu RH, Reddy VK, Barnes CD. Cotransmitter-mediated locus coeruleus action on motoneurons. Brain Res Bull. 1994;35:423–432. doi: 10.1016/0361-9230(94)90155-4. [DOI] [PubMed] [Google Scholar]
- Fung SJ, Barnes CD. Membrane excitability changes in hindlimb motoneurons induced by stimulation of the locus coeruleus in cats. Brain Res. 1987;402:230–242. doi: 10.1016/0006-8993(87)90029-1. [DOI] [PubMed] [Google Scholar]
- Fung SJ, Manzoni D, Chan JY, Pompeiano O, Barnes CD. Locus coeruleus control of spinal motor output. Prog Brain Res. 1991;88:395–409. doi: 10.1016/s0079-6123(08)63825-x. [DOI] [PubMed] [Google Scholar]
- Gautron L, Lazarus M, Scott MM, Saper CB, Elmquist JK. Identifying the efferent projections of leptin-responsive neurons in the dorsomedial hypothalamus using a novel conditional tracing approach. J Comp Neurol. 2010;518:2090–2108. doi: 10.1002/cne.22323. [DOI] [PMC free article] [PubMed] [Google Scholar]
- Graham BA, Hammond DL, Proudfit HK. Differences in the antinociceptive effects of alpha-2 adrenoceptor agonists in two substrains of Sprague-Dawley rats. J Pharmacol Exp Ther. 1997;283:511–519. [PubMed] [Google Scholar]
- Guinan MJ, Rothfeld JM, Pretel S, Culhane ES, Carstens E, Watkins LR. Electrical stimulation of the rat ventral midbrain elicits antinociception via the dorsolateral funiculus. Brain Res. 1989;485:333–348. doi: 10.1016/0006-8993(89)90578-7. [DOI] [PubMed] [Google Scholar]
- Gurtu S, Pant KK, Sinha JN, Bhargava KP. An investigation into the mechanism of cardiovascular responses elicited by electrical stimulation of locus coeruleus and subcoeruleus in the cat. Brain Res. 1984;301:59–64. doi: 10.1016/0006-8993(84)90402-5. [DOI] [PubMed] [Google Scholar]
- Haghparast A, Naderi N, Khani A, Lashgari R, Motamedi F. Formalin-induced differential activation of nucleus cuneiformis neurons in the rat: an electrophysiological study. J Pain. 2010;11:32–43. doi: 10.1016/j.jpain.2009.05.005. [DOI] [PubMed] [Google Scholar]
- Haigler HJ. Morphine: ability to block neuronal activity evoked by a nociceptive stimulus. Life Sci. 1976;19:841–857. doi: 10.1016/0024-3205(76)90312-x. [DOI] [PubMed] [Google Scholar]
- Haigler HJ, Mittleman RS. Analgesia produced by direct injection of morphine into the mesencephalic reticular formation. Brain Res Bull. 1978;3:655–662. doi: 10.1016/0361-9230(78)90013-8. [DOI] [PubMed] [Google Scholar]
- Hokfelt T, Johansson O, Goldstein M. Central catecholamine neurons as revealed by immunohistochemistry with special reference to adrenaline neurons. In: Bjorklund A, Hokfelt T, editors. Handbook of Chemical Neuroanatomy. Elsevier; Amsterdam: 1984. pp. 157–276. [Google Scholar]
- Holden JE, Proudfit HK. Enkephalin neurons that project to the A7 catecholamine cell group are located in nuclei that modulate nociception: ventromedial medulla. Neuroscience. 1998;83:929–947. doi: 10.1016/s0306-4522(97)00437-5. [DOI] [PubMed] [Google Scholar]
- Holden JE, Schwartz EJ, Proudfit HK. Microinjection of morphine in the A7 catecholamine cell group produces opposing effects on nociception that are mediated by alpha1- and alpha2-adrenoceptors. Neuroscience. 1999;91:979–990. doi: 10.1016/s0306-4522(98)00673-3. [DOI] [PubMed] [Google Scholar]
- Iwamoto ET, Marion L. Adrenergic, serotonergic and cholinergic components of nicotinic antinociception in rats. J Pharmacol Exp Ther. 1993;265:777–789. [PubMed] [Google Scholar]
- Jones BE. Reticular formation: cytoarchitecture, transmitters and projections. In: Paxinos G, editor. The Rat Nervous System. Elsevier Academic Press; New York: 1995. pp. 155–171. [Google Scholar]
- Kawamura H, Gunn CG, Frohlich ED. Cardiovascular alteration by nucleus locus coeruleus in spontaneously hypertensive rat. Brain Res. 1978;140:137–147. doi: 10.1016/0006-8993(78)90243-3. [DOI] [PubMed] [Google Scholar]
- Korte SM, Jaarsma D, Luiten PG, Bohus B. Mesencephalic cuneiform nucleus and its ascending and descending projections serve stress-related cardiovascular responses in the rat. J Auton Nerv Syst. 1992;41:157–176. doi: 10.1016/0165-1838(92)90137-6. [DOI] [PubMed] [Google Scholar]
- Lai YY, Strahlendorf HK, Fung SJ, Barnes CD. The actions of two monoamines on spinal motoneurons from stimulation of the locus coeruleus in the cat. Brain Res. 1989;484:268–272. doi: 10.1016/0006-8993(89)90369-7. [DOI] [PubMed] [Google Scholar]
- Lam W, Verberne AJ. Cuneiform nucleus stimulation-induced sympathoexcitation: role of adrenoceptors, excitatory amino acid and serotonin receptors in rat spinal cord. Brain Res. 1997;757:191–201. doi: 10.1016/s0006-8993(97)00201-1. [DOI] [PubMed] [Google Scholar]
- Lanteri-Minet M, Weil-Fugazza J, de Pommery J, Menetrey D. Hindbrain structures involved in pain processing as revealed by the expression of c-Fos and other immediate early gene proteins. Neuroscience. 1994;58:287–298. doi: 10.1016/0306-4522(94)90035-3. [DOI] [PubMed] [Google Scholar]
- Leah J, Menetrey D, de Pommery J. Neuropeptides in long ascending spinal tract cells in the rat: evidence for parallel processing of ascending information. Neuroscience. 1988;24:195–207. doi: 10.1016/0306-4522(88)90323-5. [DOI] [PubMed] [Google Scholar]
- Levitt P, Moore RY. Origin and organization of brainstem catecholamine innervation in the rat. J Comp Neurol. 1979;186:505–528. doi: 10.1002/cne.901860402. [DOI] [PubMed] [Google Scholar]
- Light AR. The Initial Processing of Pain and Its Descending Control: Spinal and Trigeminal Systems (Pain and Headache) Karger (Switzerland); Basel: 1992. [Google Scholar]
- Lima D, Coimbra A. Morphological types of spinomesencephalic neurons in the marginal zone (lamina I) of the rat spinal cord, as shown after retrograde labelling with cholera toxin subunit B. J Comp Neurol. 1989;279:327–339. doi: 10.1002/cne.902790212. [DOI] [PubMed] [Google Scholar]
- Lin AM, Pan CM, Lin YF, Kuo JS, Chan SH, Chai CY. A cardioinhibitory area in the midbrain central tegmental field of cats. Brain Res Bull. 1987;18:699–707. doi: 10.1016/0361-9230(87)90204-8. [DOI] [PubMed] [Google Scholar]
- Loewy AD, Gregorie EM, McKellar S, Baker RP. Electrophysiological evidence that the A5 catecholamine cell group is a vasomotor center. Brain Res. 1979a;178:196–200. doi: 10.1016/0006-8993(79)90100-8. [DOI] [PubMed] [Google Scholar]
- Loewy AD, Marson L, Parkinson D, Perry MA, Sawyer WB. Descending noradrenergic pathways involved in the A5 depressor response. Brain Res. 1986;386:313–324. doi: 10.1016/0006-8993(86)90168-x. [DOI] [PubMed] [Google Scholar]
- Loewy AD, McKellar S, Saper CB. Direct projections from the A5 catecholamine cell group to the intermediolateral cell column. Brain Res. 1979b;174:309–314. doi: 10.1016/0006-8993(79)90852-7. [DOI] [PubMed] [Google Scholar]
- Mason ST, Fibiger HC. Regional topography within noradrenergic locus coeruleus as revealed by retrograde transport of horseradish peroxidase. J Comp Neurol. 1979;187:703–724. doi: 10.1002/cne.901870405. [DOI] [PubMed] [Google Scholar]
- Menetrey D, Chaouch A, Binder D, Besson JM. The origin of the spinomesencephalic tract in the rat: an anatomical study using the retrograde transport of horseradish peroxidase. J Comp Neurol. 1982;206:193–207. doi: 10.1002/cne.902060208. [DOI] [PubMed] [Google Scholar]
- Miller JF, Proudfit HK. Antagonism of stimulation-produced antinociception from ventrolateral pontine sites by intrathecal administration of alpha-adrenergic antagonists and naloxone. Brain Res. 1990;530:20–34. doi: 10.1016/0006-8993(90)90653-s. [DOI] [PubMed] [Google Scholar]
- Nuseir K, Proudfit HK. Bidirectional modulation of nociception by GABA neurons in the dorsolateral pontine tegmentum that tonically inhibit spinally projecting noradrenergic A7 neurons. Neuroscience. 2000;96:773–783. doi: 10.1016/s0306-4522(99)00603-x. [DOI] [PubMed] [Google Scholar]
- Pant KK, Gurtu S, Sharma DK, Sinha JN, Bhargava KP. Cardiovascular effects of microinjection of morphine into the nucleus locus coeruleus of the cat. Jpn J Pharmacol. 1983;33:253–256. doi: 10.1254/jjp.33.253. [DOI] [PubMed] [Google Scholar]
- Paxinos G, Watson C. The Rat Brain in Stereotaxic Coordinates. Academic Press; San Diego: 1998. [Google Scholar]
- Perlman R, Guideri G. Cardiovascular changes produced by the injection of aconitine at the area of the locus coeruleus in unanesthetized rats. Arch Int Pharmacodyn Ther. 1984;268:202–215. [PubMed] [Google Scholar]
- Proudfit HK. The behavioral pharmacology of the noradrenergic descending system. In: Besson J-MR, Guilbaud G, editors. Towards the Use of Noradrenergic Agonists. Elsevier; Amsterdam: 1992. Proceedings. [Google Scholar]
- Proudfit HK. The challenge of defining brainstem pain modulation circuits. J Pain. 2002;3:350–354. doi: 10.1054/jpai.2002.127777. discussion 358–359. [DOI] [PubMed] [Google Scholar]
- Proudfit HK, Clark FM. The projections of locus coeruleus neurons to the spinal cord. Prog Brain Res. 1991;88:123–141. doi: 10.1016/s0079-6123(08)63803-0. [DOI] [PubMed] [Google Scholar]
- Romagnano MA, Harshbarger RJ, Hamill RW. Brainstem enkephalinergic projections to spinal autonomic nuclei. J Neurosci. 1991;11:3539–3555. doi: 10.1523/JNEUROSCI.11-11-03539.1991. [DOI] [PMC free article] [PubMed] [Google Scholar]
- Sandkuhler J, Gebhart GF. Characterization of inhibition of a spinal nociceptive reflex by stimulation medially and laterally in the midbrain and medulla in the pentobarbital-anesthetized rat. Brain Res. 1984;305:67–76. doi: 10.1016/0006-8993(84)91120-x. [DOI] [PubMed] [Google Scholar]
- Sluka KA, Westlund KN. Spinal projections of the locus coeruleus and the nucleus subcoeruleus in the Harlan and the Sasco Sprague-Dawley rat. Brain Res. 1992;579:67–73. doi: 10.1016/0006-8993(92)90742-r. [DOI] [PubMed] [Google Scholar]
- Stanek KA, Neil JJ, Sawyer WB, Loewy AD. Changes in regional blood flow and cardiac output after L-glutamate stimulation of A5 cell group. Am J Physiol. 1984;246:H44–51. doi: 10.1152/ajpheart.1984.246.1.H44. [DOI] [PubMed] [Google Scholar]
- Steeves JD, Jordan LM. Autoradiographic demonstration of the projections from the mesencephalic locomotor region. Brain Res. 1984;307:263–276. doi: 10.1016/0006-8993(84)90480-3. [DOI] [PubMed] [Google Scholar]
- Strahlendorf JC, Strahlendorf HK, Kingsley RE, Gintautas J, Barnes CD. Facilitation of the lumbar monosynaptic reflexes by locus coeruleus stimulation. Neuropharmacology. 1980;19:225–230. doi: 10.1016/0028-3908(80)90143-4. [DOI] [PubMed] [Google Scholar]
- Swanson LW. The locus coeruleus: a cytoarchitectonic, Golgi and immunohistochemical study in the albino rat. Brain Res. 1976;110:39–56. doi: 10.1016/0006-8993(76)90207-9. [DOI] [PubMed] [Google Scholar]
- Swett JE, McMahon SB, Wall PD. Long ascending projections to the midbrain from cells of lamina I and nucleus of the dorsolateral funiculus of the rat spinal cord. J Comp Neurol. 1985;238:401–416. doi: 10.1002/cne.902380405. [DOI] [PubMed] [Google Scholar]
- Ter Horst GJ, Groenewegen HJ, Karst H, Luiten PG. Phaseolus vulgaris leuco-agglutinin immunohistochemistry. A comparison between autoradiographic and lectin tracing of neuronal efferents. Brain Res. 1984;307:379–383. doi: 10.1016/0006-8993(84)90500-6. [DOI] [PubMed] [Google Scholar]
- Valentino RJ, Martin DL, Suzuki M. Dissociation of locus coeruleus activity and blood pressure. Effects of clonidine and corticotropin-releasing factor. Neuropharmacology. 1986;25:603–610. doi: 10.1016/0028-3908(86)90212-1. [DOI] [PubMed] [Google Scholar]
- Veazey RB, Severin CM. Afferent projections to the deep mesencephalic nucleus in the rat. J Comp Neurol. 1982;204:134–150. doi: 10.1002/cne.902040204. [DOI] [PubMed] [Google Scholar]
- Veenman CL, Reiner A, Honig MG. Biotinylated dextran amine as an anterograde tracer for single- and double-labeling studies. J Neurosci Methods. 1992;41:239–254. doi: 10.1016/0165-0270(92)90089-v. [DOI] [PubMed] [Google Scholar]
- Verberne AJ. Cuneiform nucleus stimulation produces activation of medullary sympathoexcitatory neurons in rats. Am J Physiol. 1995;268:R752–758. doi: 10.1152/ajpregu.1995.268.3.R752. [DOI] [PubMed] [Google Scholar]
- Verberne AJ, Lam W, Owens NC, Sartor D. Supramedullary modulation of sympathetic vasomotor function. Clin Exp Pharmacol Physiol. 1997;24:748–754. doi: 10.1111/j.1440-1681.1997.tb02126.x. [DOI] [PubMed] [Google Scholar]
- Ward DG, Gunn CG. Locus coeruleus complex: differential modulation of depressor mechanisms. Brain Res. 1976a;107:407–411. doi: 10.1016/0006-8993(76)90237-7. [DOI] [PubMed] [Google Scholar]
- Ward DG, Gunn CG. Locus coeruleus complex: elicitation of a pressor response and a brain stem region necessary for its occurrence. Brain Res. 1976b;107:401–406. doi: 10.1016/0006-8993(76)90236-5. [DOI] [PubMed] [Google Scholar]
- West WL, Yeomans DC, Proudfit HK. The function of noradrenergic neurons in mediating antinociception induced by electrical stimulation of the locus coeruleus in two different sources of Sprague-Dawley rats. Brain Res. 1993;626:127–135. doi: 10.1016/0006-8993(93)90571-4. [DOI] [PubMed] [Google Scholar]
- Westlund KN, Bowker RM, Ziegler MG, Coulter JD. Origins of spinal noradrenergic pathways demonstrated by retrograde transport of antibody to dopamine-beta-hydroxylase. Neurosci Lett. 1981;25:243–249. doi: 10.1016/0304-3940(81)90399-2. [DOI] [PubMed] [Google Scholar]
- Westlund KN, Bowker RM, Ziegler MG, Coulter JD. Descending noradrenergic projections and their spinal terminations. Prog Brain Res. 1982;57:219–238. doi: 10.1016/S0079-6123(08)64131-X. [DOI] [PubMed] [Google Scholar]
- Westlund KN, Bowker RM, Ziegler MG, Coulter JD. Noradrenergic projections to the spinal cord of the rat. Brain Res. 1983;263:15–31. doi: 10.1016/0006-8993(83)91196-4. [DOI] [PubMed] [Google Scholar]
- Westlund KN, Coulter JD. Descending projections of the locus coeruleus and subcoeruleus/medial parabrachial nuclei in monkey: axonal transport studies and dopamine-beta-hydroxylase immunocytochemistry. Brain Res. 1980;2:235–264. doi: 10.1016/0165-0173(80)90009-0. [DOI] [PubMed] [Google Scholar]
- Wouterlood FG, Jorritsma-Byham B. The anterograde neuroanatomical tracer biotinylated dextran-amine: comparison with the tracer Phaseolus vulgaris-leucoagglutinin in preparations for electron microscopy. J Neurosci Methods. 1993;48:75–87. doi: 10.1016/s0165-0270(05)80009-3. [DOI] [PubMed] [Google Scholar]
- Yeomans DC, Clark FM, Paice JA, Proudfit HK. Antinociception induced by electrical stimulation of spinally projecting noradrenergic neurons in the A7 catecholamine cell group of the rat. Pain. 1992;48:449–461. doi: 10.1016/0304-3959(92)90098-V. [DOI] [PubMed] [Google Scholar]
- Yeomans DC, Proudfit HK. Antinociception induced by microinjection of substance P into the A7 catecholamine cell group in the rat. Neuroscience. 1992;49:681–691. doi: 10.1016/0306-4522(92)90236-u. [DOI] [PubMed] [Google Scholar]
- Zemlan FP, Behbehani MM. Nucleus cuneiformis and pain modulation: anatomy and behavioral pharmacology. Brain Res. 1988;453:89–102. doi: 10.1016/0006-8993(88)90146-1. [DOI] [PubMed] [Google Scholar]