Abstract
Glycosaminoglycans (GAGs) vary widely in disaccharide and oligosaccharide content in a tissue-specific manner. Nonetheless, there are common structural features, such as the presence of highly sulfated non-reducing end domains on heparan sulfate (HS) chains. Less clear are the patterns of expression of GAGs on specific cell types. Leukocytes are known to express GAGs primarily of the chondroitin sulfate (CS) type. Little is known, however, regarding the properties and structures of the GAG chains, their ranges of variability among normal subjects, and changes in structure associated with disease conditions. We isolated peripheral blood leukocyte populations from four human donors and extracted GAGs. We determined the relative and absolute disaccharides abundances for HS and CS GAG classed using size exclusion chromatography-mass spectrometry (SEC-MS). We found that all leukocytes express HS chains with level of sulfation more similar to heparin than to organ-derived HS. The levels of HS expression follows the trend T Cells, B cells>monocytes, NK cells>polymorphonuclear leukocytes (PMNs). In addition, CS abundances were considerably higher than total HS but varied considerably in a leukocyte cell type specific manner. Levels of CS were higher for myeloid lineage cells (PMNs, monocytes) than for lymphoid cells (B, T, NK cells). This information establishes the ranges of GAG structures expressed on normal leukocytes and necessary for subsequent inquiry into disease conditions.
Keywords: glycosaminoglycan, heparan sulfate, chondroitin sulfate, leukocyte, lymphocyte, mass spectrometry
Introduction
Tissue and cell-type specific expression of glycosaminoglycans
Heparan sulfate (HS) chains are biosynthesized as nascent repeating units of (4GlcAβ1-4 GlcNAcα1-) attached to proteoglycan (PG) serine residues via a xylosyl tetrasaccharide linker (1,2). The nascent chains are processed by a series of enzymes including N-deacetylase/N-sulfotransferase, glucuronyl C5-epimerase, and O-sulfotransferases. Such O- sulfation may occur at the 2O-position of HexA, the N-, 3O-, and/or 6O-position of GlcN. Mature HS chains contain blocks of high, low and intermediate sulfation, the patterns of which are organ-specific (3). This tissue specific structure can be seen in compositions of disaccharides and oligosaccharides from different tissues and cell types (4,5).
Chondroitin/dermatan sulfate (CS/DS) chains are biosynthesized as repeating units of (4GlcAβ1-3GalNAcβ1-) attached to proteoglycan (PG) serine residues via a tetrasaccharide linker of the same monosaccharide structure as with HS(6–8). The nascent chains are processed by a series of enzymes including dermatan glucuronyl C5-epimerases, and O-sulfotransferases. Mature chains may contain sulfation at the 2O-position of HexA, the 4O-and/or 6O-positions of GalNAc. Chains that contain a significant percent of their uronic residues in IdoA form are referred to as DS. In CS/DS, IdoA residues may occur isolated among repeats containing GlcA, or alternating with GlcA repeats, or in long blocks of disaccharides.
Although HS chains vary in overall extent of sulfation, a highly sulfated non-reducing end domain has been observed regardless of the total level of chain sulfation for organ-derived HS (9). CS chains also vary in structure according to tissue and developmental state. Thus, characteristic CS sulfation patterns are associated with cartilage (10,11), skin (12,13), and neural (14) tissues. The expression of domains of CS/DS structure has been observed in a variety of tissues (15,16).
Experiments on organ tissue do not provide information regarding the structure of GAG made by single cell types owing to the heterogeneous cell populations making up each organ. As a result, comparatively little is known regarding detailed structures of GAGs expressed in a cell-type specific manner. Such information would help shed light on the mechanisms where by GAG structure reflects both normal and disease-specific phenotypes. We sought to determine patterns of GAG expression in primary cells isolated from single individuals. By collecting data in this manner we avoided questions of variability due to genetic makeup versus cell phenotype.
GAG expression in hematopoietic cells
The expression of GAGs in leukocytes was demonstrated in studies in which isolated hexosamine or alcian-blue-positive material co-migrated with CS analyzed by electrophoresis or chromatography (17,18). One line of evidence shows that leukocyte GAGs were predominantly 4-O-sulfated CS (19) and associated with granules (20). PMN GAGs are composed primarily of 4-sulfated CS with a minor proportion of HS (21). T Lymphocytes were found to both biosynthesize and secret GAGs consisting largely of CS with smaller amounts of HS (22).
Serglycin proteoglycan mRNA is transcribed in hematopoietic lineage cells (23,24). Serglycin-bound CS has been described as the major GAG present in hematopoietic cells (25). Connective tissue mast cells contain serglycin, a major function of which is to package lytic factors including chymases, tryptases, carboxypeptidases, histamine and serotonin (25). Among leukocytes, PMNs, CD8+ cytotoxic T lymphocytes (CTLs) and NK cells are known to contain large amounts of lytic proteins in their granules. The serglycins in the granules of CTLs and PMNs are stored or secreted in a regulated manner. In addition, serglycins are secreted constitutively in monocytes, B cells, CD4+ and CD8+ T cells (26).
Among leukocytes, PMN populations, consisting primarily of neutrophils, have been found to contain CS-type PGs on their surfaces (27). Serglycin has been found to be present in the Golgi apparatus of PMN more so than in mature granules, and is thought to help in transport of neutrophil elastase (28,29). Active, inhibitor resistant, neutrophil elastase released from degranulating PMN binds CS and HS proteoglycans on the cell surface in a high capacity, low affinity manner (30). Proteases are found on the surfaces of freshly isolated monocytes and B lymphocytes, including matripase (31). Cell surface cathepsin B on cytotoxic lymphocytes inactivates perforin molecules released during degranulation thereby preventing damage to the cells (32). It is therefore of interest to determine the extent to which GAG chains of myeloid derived cell lineages including PMNs and mononcytes resemble those expressed by lymphoid derived lymphocytes.
Hematopoietic cell GAGs and disease
Much of the information regarding proteoglycan expression and hematopoietic cell diseases has come through use of an enzyme-linked immunosorbent assay (ELISA) for syndecan-1(CD138). Syndecan-1 has been reported to be absent from all hematopoietic cells other than those of the B cell lineage where its expression helps classify B cell lymphomas including Hodgkin’s lymphoma, AIDS Burkitt lymphomas and systemic AIDS diffuse large cell lymphoma (33). In addition, syndecan-1 is elevated in sera of multiple myeloma patients and appears to enhance angiogenesis, growth and metastasis of tumor cells (34,35). Levels of syndecan-1 are elevated in chronic lymphocytic leukemia patients and are associated with shorter survival (36). Systemic lupus erythematosis, a disease characterized by loss of B cell tolerance, is also associated with elevation of circulating syndecan-1 on B cells (37). Because the results are from ELISA specific to syndecan-1, there is no information on structures of GAG chains. In addition, among leukocytes, syndecan-4 mRNA was detected only in inactivated CD4+ and CD8+ T cells. Its expression was increased in several lymphoma cell lines (38). Little is known about the structure of syndecan-4 in these cell lines.
Spurred by the correlations between disease states and proteoglycan expression, we sought to improve the understanding of the patterns of GAG expression by leukocytes. We applied mass spectrometric methods for GAG to define cell specific phenotypes in greater detail than available previously. Our goal was to define GAG structural expression patterns on leukocytes from normal donors as a basis for developing understanding of disease states. Our work shows unexpected expression patterns for CS and HS GAGs on leukocytes.
Results
Heparan sulfate and Chondroitin sulfate quantity in human leukocytes
Aliquots of GAGs extracted from B cells, T cells, NK cells, monocytes, peripheral blood mononuclear cells (PBMCs) and PMNs were digested exhaustively into disaccharides using either heparin lyase I, II and III or chondroitinase ABC. As determined from the abundances of the chromatographic peaks, heparin lyase digestion as >95% complete and chondroitinase digestion was >99% complete.
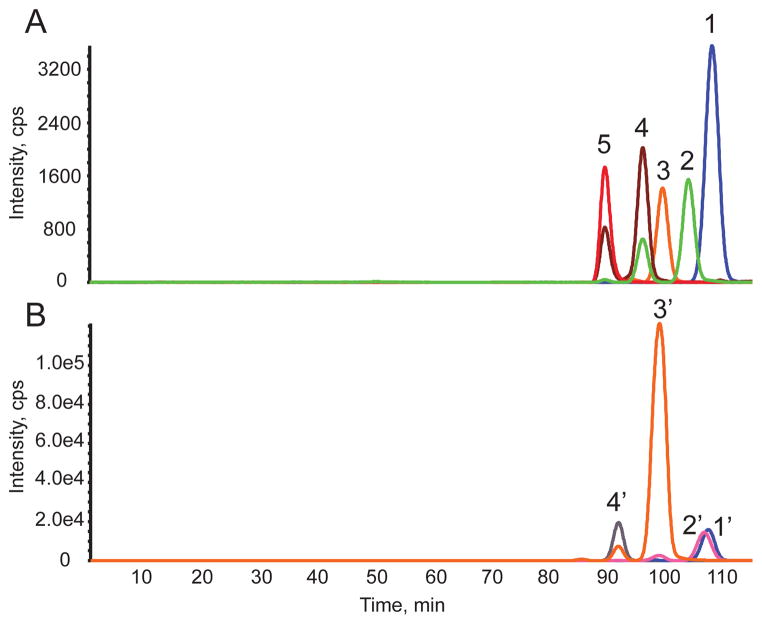
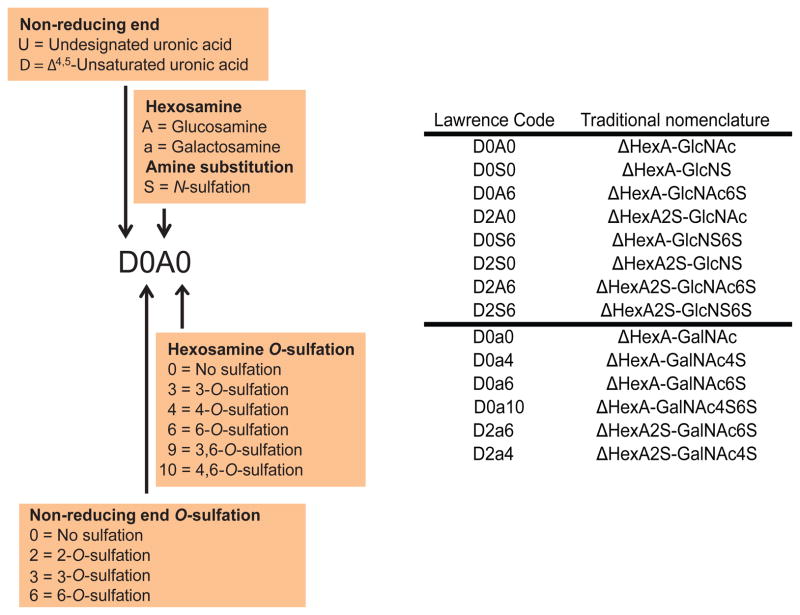
A set of representative size exclusion chromatography-mass spectrometry (SEC-MS) extracted ion chromatograms (EICs) for HS and CS data acquired on T cells and PMNs is shown in Fig. 1. The HS Δ4,5-unsaturated disaccharides released using heparin lyases I, II, and III digestion are shown in Fig. 1A. Representative primary data from which these chromatograms were extracted are shown in Suppl. Fig. 1. The abundances of CS Δ4,5-unsaturated disaccharides and GalNAcSO3 monosaccharide digested using chondroitinase ABC are shown in Fig. 1B. Representative primary data from which the CS chromatograms were produced are shown in Suppl. Fig. 2. The saccharides were identified based on their elution times and mass using SEC-MS (4). The structures of HS and CS disaccharides are designated using the coding system of Lawrence et al. (39), summarized in Scheme 1.
Figure 1.
Representative extracted ion chromatograms (EICs) for HS and CS disaccharides and monosaccharide for human leukocytes observed using SEC-MS. (A) Δ4,5- unsaturated HS disaccharides from T cells from Donor 2. 1, D0A0; 2, D0S0; 3, D0A6/D2A0; 4, D0S6/D2S0; 5, D2S6. D2A6 is not shown here because it was very low in abundance. Note that traces 2 and 4 were observed as two peaks due to in-source losses of SO3. These losses were corrected for in the quantitative calculations. (B) 4,5-unsaturated CS disaccharides and monosaccharide from PMNs from Donor 2. 1′, D0a0; 2′, GalNAcSO3; 3′, D0a4/D0a6; 4′, D0a10/D2a6/D2a4. Note that trace 3′ is observed as two peaks due to in-source loss of SO3. These losses were corrected for in the quantitative calculations. Trace 2′ was also observed as two peaks due to in-source fragmentation of D0A6/D2A0.
Scheme 1.
(Left) Nomenclature for heparan sulfate (HS) and chondroitin sulfate (CS) disaccharides using Lawrence code. (Right) Lawrence code (Lawrence, R., Lu, H., Rosenberg, R.D., Esko, J.D., and Zhang, L. (2008) Nat Methods 5, 291–292) in parallel with traditional nomenclature.
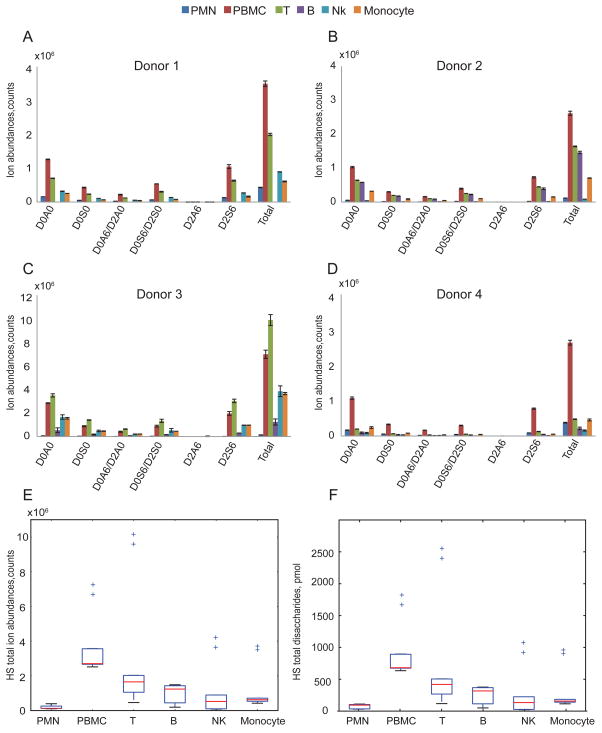
The ion abundances of Δ4,5-unsaturated disaccharides of HS from different leukocytes cell populations are shown in Fig. 2A–D. The data for each donor demonstrate that HS profiles differ among the leukocytes cell populations; thus, it is clear that HS expression differs among leukocyte populations at a given time. The PBMC population, representing lymphocytes, monocytes and dendritic cells, has the highest total HS expression for three of the four donors. Excluding PBMC, HS expression follows the trend T cells, B cells>monocytes, NK cells>PMNs as shown in Fig. 2E. Figure 2F gives absolute quantities (pmol) of total HS disaccharides per 107 cells that were calculated using external HS disaccharides standards, confirming HS expression trend among leukocytes demonstrated in Fig. 2E.
Figure 2.
Summary of ion abundances of HS Δ4,5-unsaturated disaccharides and total HS disaccharides from leukocytes from four donors. HS total ion abundance is the sum of six Δ4,5-unsaturated disaccharides ion abundances and is normalized to 10 million cells. The number of B cells isolated from donor 1(A) was too low that was below the limit of quantification. Triplicates samples of extracted GAGs were digested using heparin lyases I, II and III for donors 1(A), 2(B) and 4(D) for each cell population except B cells in which duplicates were used. Duplicates of extracted GAGs were digested with heparin lyases I, II and III for donor 3(C) for each cell population. Box-whisker plots of HS total disaccharides ion abundances in counts (E) and HS total disaccharides quantities in pmols (F), summarized from four donors. Box plot (E) shows that the median (range) for HS total disaccharides ion abundances in counts was 1.34*105 (1.16*105–3.94*105), 2.71*106 (2.52*106 –7.23*106), 1.65*106 (4.62*105–1.02*107), 1.24*106 (1.93*105–1.49*106), 5.26*105 (8.53*104–4.17*106) and 6.25*105(4.25*105 –7.16*106) for the PMN, PBMC, T, B, NK and monocyte, respectively. Box plot (F) shows that the median (range) for HS total disaccharides quantities in pmol was 94.03 (30.41–110.48), 680.80 (634.51–824.63), 418. 88 (117.81–2562.87), 316.50 (49.77–376.93), 133.69 (22.41–1078.462) and 157.34 (114.42–953.50) for the PMN, PBMC, T, B, NK and monocyte, respectively. The horizontal bar at the two ends represents the smallest and largest values. The values within the box are the first quartile (Q1), median and the third quartile (Q3). Outlier values are indicated using crosses, defined as 1.5(Q3-Q1) below Q1 or above Q3. The outliers in (E) and (F) represent values from donor 3 duplicates.
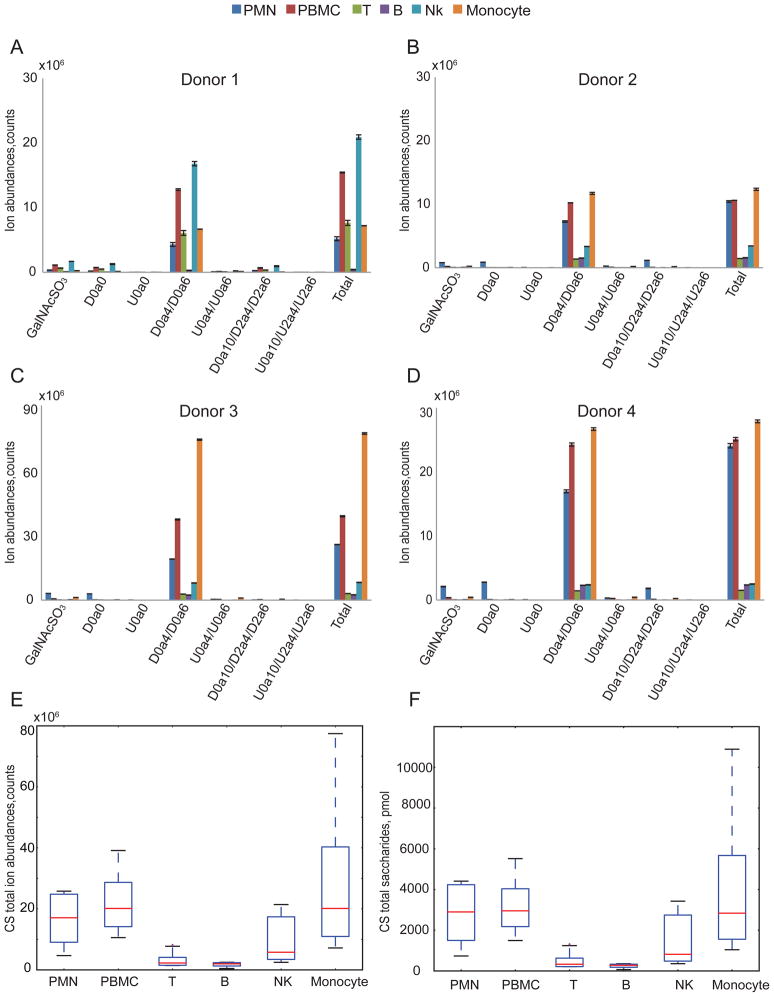
The ion abundances of CS saccharides from leukocyte cell populations are shown in Fig. 3A–D. For each donor, we detected CS expression level differences among leukocytes cell populations that showed a consistent trend (Fig. 3E). The absolute quantities (pmol) of total CS saccharides per 107 cells that were calculated using external CS disaccharides standards shown in Fig. 3F, giving very similar CS expression trend observed in Fig. 3E. For three of four donors, PMNs and monocytes populations displayed significantly higher total CS expression than lymphocytes. The donor 1 NK cells showed a high level of CS expression relative to the other three donors, skewing the overall trend in CS expression (Fig. 3E).
Figure 3.
Summary of CS saccharides ion abundances and total abundance from leukocytes from four donors. CS total ion abundance was calculated from the sum of 3 Δ4,5-unsaturated disaccharides, 3 saturated disaccharides and GalNAcSO3 and was normalized per 10 million cells. Triplicate samples of extracted GAGs were digested using chondroitinase ABC for donors 1(A), 2(B) and 4(D) for each population except for B cells for which duplicates were acquired. Duplicates of extracted GAGs were digested using chondroitinase ABC for donor 3(C) for each cell population. CS total ion abundances in counts (E) and CS total saccharides quantities in pmols (F) summarized from four donors. Box plot (E) shows that the median (range) for CS total ion abundances in counts was 1.06*107 (4.69*106–2.58*107), 1.56*107 (1.06*107 –3.91*107), 2.99*106 (1.51*106–8.14*106), 1.97*106 (3.80*105–2.49*106), 5.79*106 (2.47*106–2.14*107) and 1.26*107(7.19*106 –7.75*107) for the PMN, PBMC, T, B, NK and monocyte, respectively. Box plot (F) shows that the median (range) for CS total saccharides quantities in pmols was 2898.65 (733.94–4410.74), 2953.09 (1495.21–5517.81), 330.63(208.66–1307.76), 276.69(67.37–354.40), 817.80(354.10–3425.85) and 2838.23(1041.45–10890.79) for the PMN, PBMC, T, B, NK, and monocyte, respectively. Box-whisker plot notation was the same as shown in the Fig. 2 legend.
In order to determine the abundance of DS, we used chondroitinase B to digest GAGs from B cells, T cells, NK cells, monocytes, PBMCs and PMNs. This enzyme cleaves regions of the CS/DS chains that contain at least two adjacent disaccharide units with IdoA residues (40). We did not detect any disaccharide products from B cells, T cells, NK cells and PBMCs. The abundances of disaccharides in chondroitinase B digests of CS/DS from monocytes and PMS was less than 1% of that observed with chondroitinase ABC.
Comparison of total heparan sulfate and chondroitin sulfate in human leukocytes
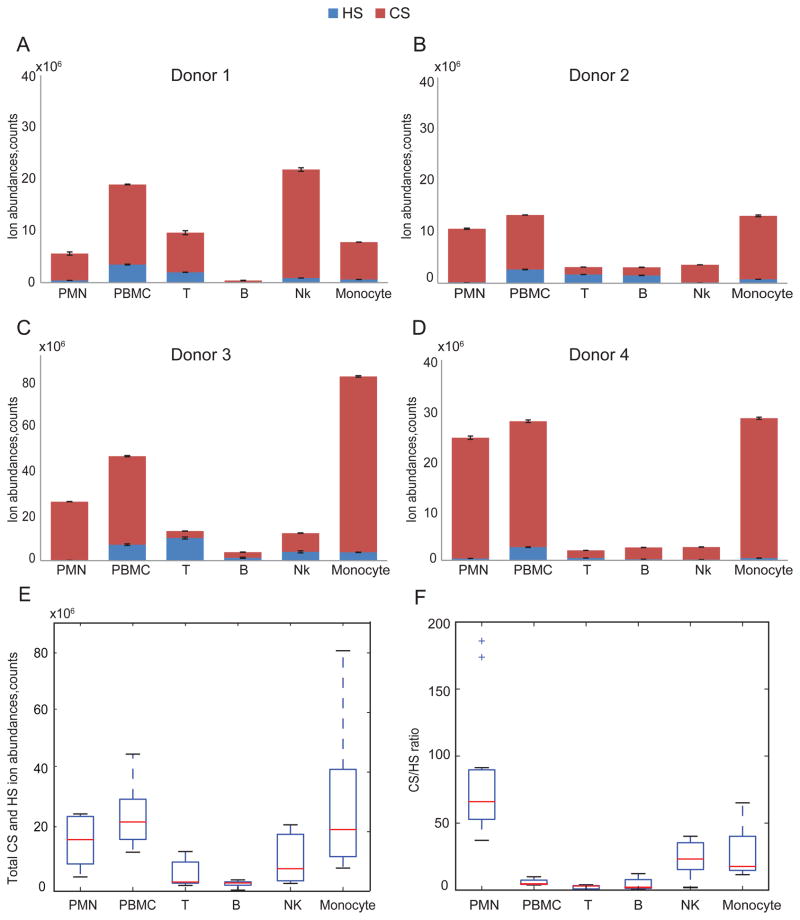
Fig. 4A–E compares the total HS and CS ion abundances for different leukocyte populations in four donors. Among the four donors there was a consistent trend in expression of total GAG. For these donors, GAG level per 107 cells was highest for PMN, PBMC and monocytes. The bulk of the GAG was CS but significant HS levels were detected for all populations. The total GAG in lymphocytes (T, B and NK cells) were significantly lower than monocytes and PBMC. In addition, for all cell populations, CS was considerably higher in abundance than HS (Fig. 4F). The CS/HS ratio is highest for PMN with, followed by monocytes and NK cells. The B and T cell populations showed the lowest CS/HS ratios. These data are consistent with the conclusion of cell type-specific expression of CS and HS among leukocyte classes.
Figure 4.
Summary of HS and CS ion abundances from leukocytes in donor 1(A), donor 2(B), donor 3(C), and donor 4(D). (E) Total HS and CS ion abundances summarized from four donors. Box plots show the median (range) were 1.07*107 (4.81*106–2.59*107), 1.91*107 (1.31*107 –4.69*107), 3.11*106 (1.97*106–1.33*107), 2.81*106 (3.80*105–3.83*106), 7.59*106 (2.67*106–2.23*107) and 1.33*107(7.78*106 –8.07*107) for the PMN, PBMC, T, B, NK and monocyte, respectively. (F) CS/HS ratio summarized from four donors. The median (range) were 66 (37.2–185.9), 4.6 (3.9–9.9), 3.1 (0.3–4.0), 2.0 (1.0–12.3), 23.2 (1.9–40.2), 17.7 (11.8–65.1) for the PMN, PBMC, T, B, NK and monocyte, respectively. The outliers in (F) represent values from donor 3 duplicates.
Highly sulfated HS in leukocytes
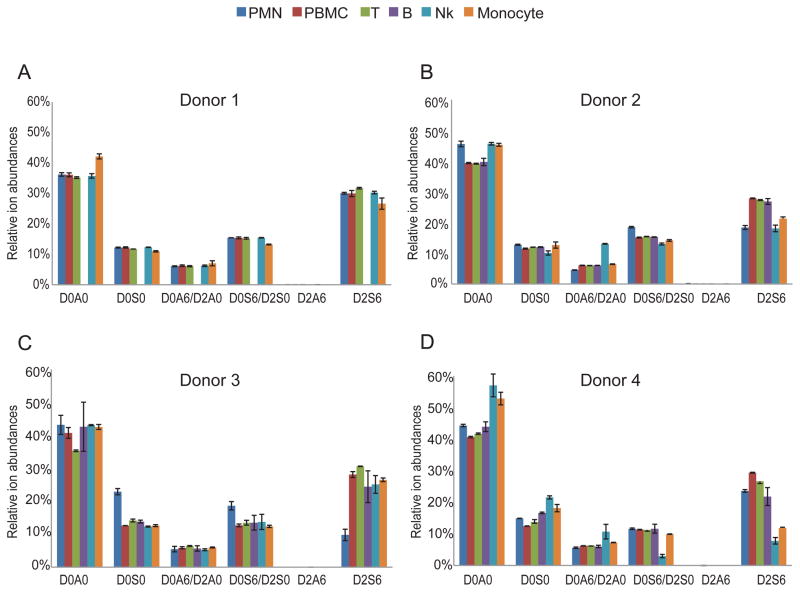
In addition to absolute GAG quantity in different cell types, we investigated relative HS chain composition (Fig. 5). The relative ion abundances of Δ4,5-unsaturated disaccharides yielded important information regarding HS structure. Organ-derived HS chains have characteristic disaccharide compositions (3). The ion abundances of highly sulfated disaccharides (D2S6) are less than 10% for even then relatively highly sulfated organ-derived HS other than from intestinal mucosa (4,9). Our data show that D2S6 relative ion abundances for HS from bovine kidney (HSBK) and syndecan-4 are within this range (Suppl. Fig. 3). The level of D2S6 in HS from porcine intestinal mucosa (HSPIM) was ~40%, as expected since it is structurally similar to heparin. To our surprise, we detected high ion abundances of D2S6 (~30%) in all leukocyte classes from the four donors (Fig. 5). We further elucidated this trend by calculating the overall HS sulfation levels, reflected by the number of sulfate groups per 100 disaccharides (Suppl. Fig. 4). For all leukocyte cell populations (except NK cells and monocytes in donor 4), the number of sulfate groups per 100 disaccharide units was higher than that of HSBK (Suppl. Fig. 3). The number of sulfate groups per 100 disaccharides for HSBK is similar to HS from other organs from a variety of species (4,9). In addition, T cells have highest overall sulfation level (with median of 130 sulfate groups per 100 disaccharides) among leukocytes in all 4 donors (Suppl. Fig. 4E).
Figure 5.
Summary of each HS disaccharides relative ion abundance from leukocytes in donor 1(A), donor 2(B), donor 3(C), and donor 4(D).
Shorter CS chain in PMNs than in different cell types of PBMCs
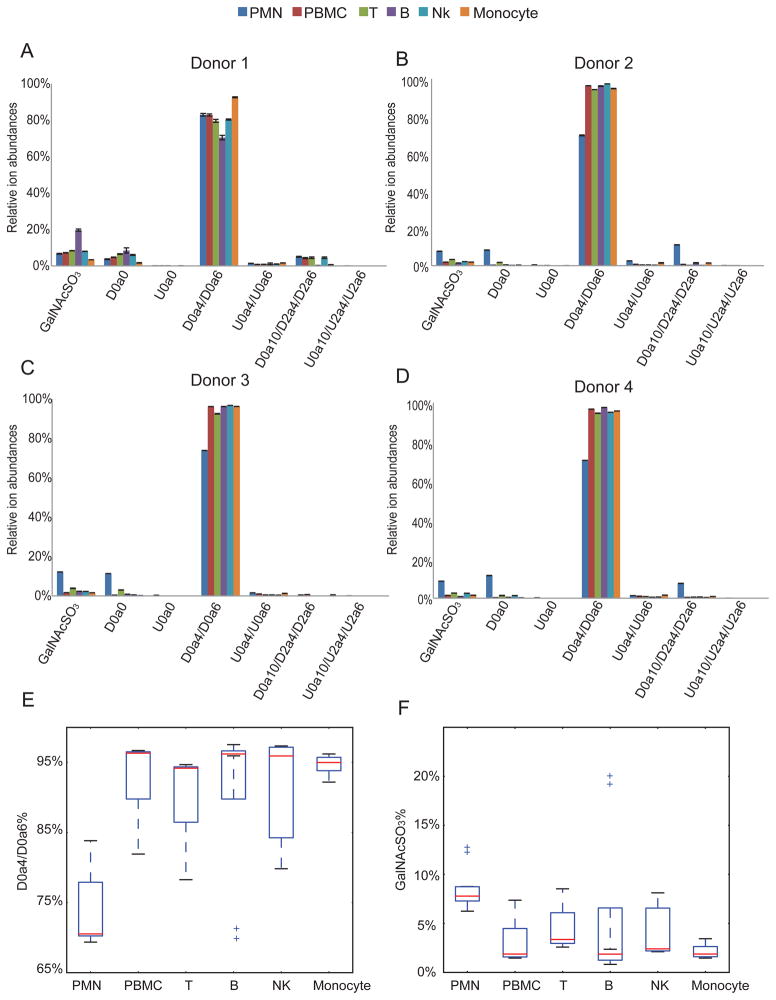
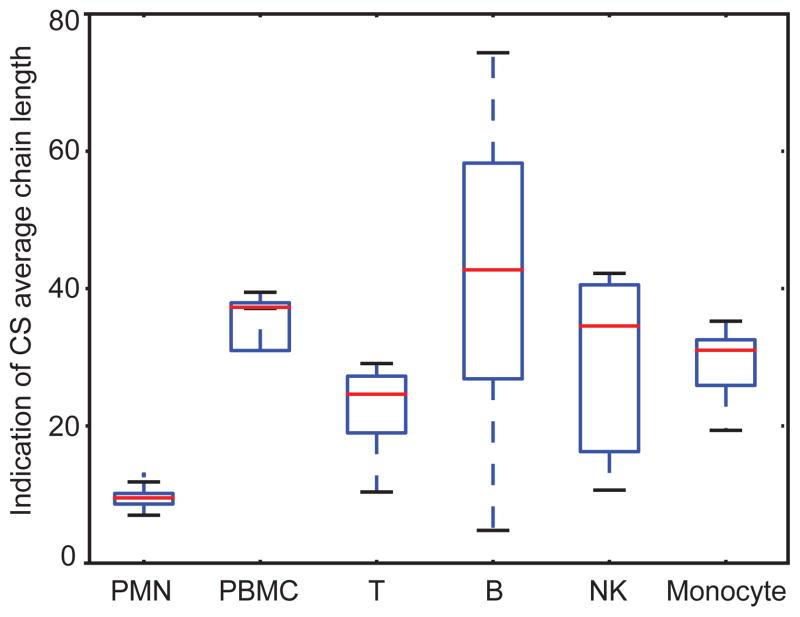
Fig. 6 shows the relative ion abundances of saccharides released by chondroitinase ABC digestion. Because of the high abundance of CS in leukocytes, we were able to quantify the saturated mono- and disaccharides deriving from the non-reducing end of the parent chains. Lymphocytes (B cells, T cells and NK cells) and monocytes showed very similar profiles, with >90% of D0a4/D0a6 in all the 4 donors. We note that PMNs in three (donors 2,3 and 4) out of four donors contain lower D0a4/D0a6 % but higher GalNAcSO3 % than other cell types of leukocytes. As CS chains may terminate with GalNAcSO3 or a HexA at the non-reducing end, we calculated the CS relative chain length by using the ratio of Δ4,5-unsaturated to saturated saccharides. As shown in Fig. 7, PMN showed significantly lower CS relative chain lengths than those of other leukocytes; B cells had the longest CS chains. From Fig. 3, monocytes and PMN have similar abundances of CS. The fact that PMN have considerably shorter chains indicates that there are many more chains modifying proteins for PMN relative to monocytes.
Figure 6.
Summary of each CS disaccharides or GalNAcSO3 relative ion abundances from leukocytes in donor 1(A), donor 2(B), donor 3(C), and donor 4(D). (E) D0a4/D0a6% summarized from four donors. Box plots show the median (range) were 70.5% (69.3%–83.8%), 96.3% (81.9%–96.6%), 94.2% (78.3%–94.6%), 96.2% (69.5%–97.5%), 95.9% (79.8%–97.3%), and 94.9% (92.2%–96.2%) for the PMN, PBMC, T, B, NK and monocyte, respectively. (F) GalNAcSO3% summarized from four donors. The median (range) were 7.8% (6.2%–12.1%), 1.9% (1.5%–7.4%), 3.4% (2.6%–8.5%), 1.9% (0.8%–20.0%), 2.4% (2.1%–8.0%), 1.9% (1.5%–3.4%) for the PMN, PBMC, T, B, NK and monocyte, respectively. The outliers in (E) represent values from donor 1 B cells duplicates and the outliers in (F) represent values from donor 3 PMN duplicates and donor 1 B cells duplicates.
Figure 7.
Box-whisker plot comparing CS average chain length from leukocytes from four donors. The average chain lengths were calculated from the total CS saccharide ion abundance/(GalNAcSO3 and saturated disaccharides ion abundances). The median (ranges) were 9 (7–13), 37 (12–39), 24 (10–29), 43 (10–29), 35 (5–74), and 31 (11–42) for the PMN, PBMC, T, B, NK and monocyte, respectively. The box-whisker plot notation was the same as given in the Fig. 2 legend.
Leukocyte CS is primarily 4-O-sulfated
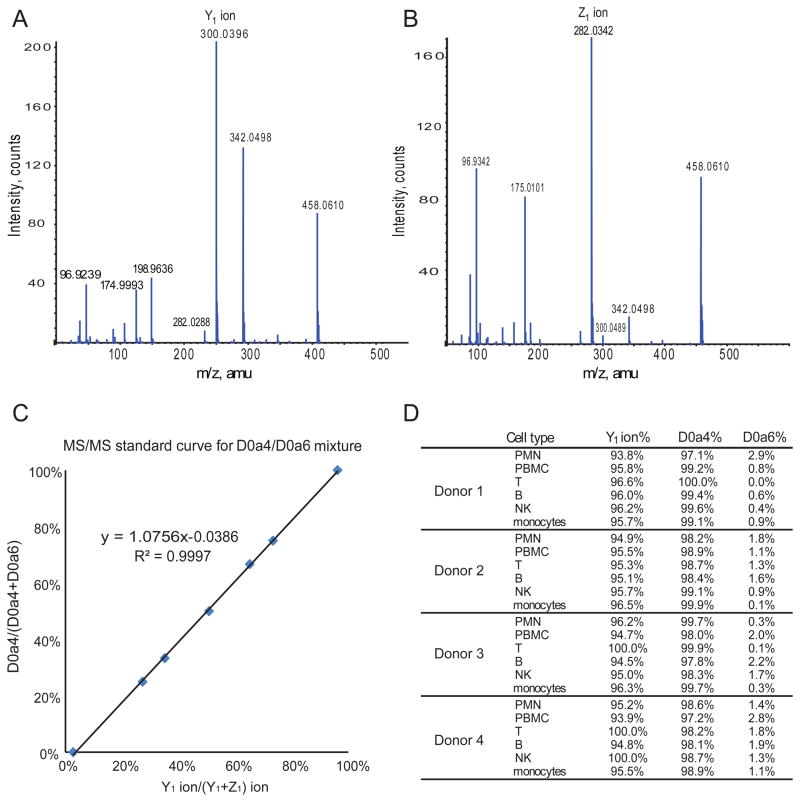
All leukocyte populations including PMN and PBMC (B cells, T cells, NK cells, and monocytes) have > 70% of monosulfated disaccharide units (D0a4/D0a6) (Fig. 6). In order to determine the position of sulfate group (4O-or 6O-) for these monosulfated disaccharides, we used tandem mass spectrometry. As shown in Fig. 8A and 8B, the Y1 ion (m/z 300.0484) is diagnostic for D0a4 while the Z1 ion (m/z 282.0362) is diagnostic for D0a6. We established a standard curve regarding the relationship between relative abundance of ion Y1 relative concentration of D0a4 (Fig. 8C). As shown in Fig. 8D, all leukocytes contained predominantly D0a4 with very low levels of D0a6, which is consistent with previous reports (19,20). Thus, the primary CS chain characteristics that vary among leukocytes are length and number of chains.
Figure 8.
Determination of abundances of 4O- versus 6O-sulfated disaccharide abundances using tandem MS. (A) Tandem mass spectrometry for D0a4 standard showing Y1 ion as a diagnostic ion. (B) Tandem mass spectrometry for D0a6 standard with Z1 ion as a diagnostic ion. (C) The linear relationship between D0a4/(D0a4+D0a6) and Y1/(Y1+Z1). (D) Table showing the D0a4 relative abundances for human leukocyte cell populations.
Discussion
Cell type-specific expression of CS and HS
In order to correlate GAG expression and disease conditions, it is necessary to understand the expression of GAGs in the context of normal human genetic variability. Previous studies have demonstrated organ tissue-specific GAG expression patterns (3,4). In addition, a highly sulfated non-reducing terminal domain seems to be common to HS from different organs (9). Much less information is known regarding comparative GAG structural expression on specific cell types. Further, the extent to which GAG expression varies for a given cell type among different individuals has not been established.
Blood cell types derive from either myeloid lineage (red blood cells, monocytes, PMNs, dendritic cells) or lymphoid lineage (B cells, T cells and NK cells), both of which arise from hematopoietic stem cell differentiation. Our data showed that HS and CS were expressed in leukocyte cell type-specific patterns characterized by consistent trends among four donors. Among the four donors, the trends showed that lymphocytes, especially T and B cells, express higher levels of HS and with higher overall sulfation levels than monocytes or PMN; however, monocytes and PMNs express much more CS than lymphocytes. We find that PMNs display shorter average CS chain length than that of monocytes, while the two cell types have similar CS abundances. We conclude that there are more CS chains attached to serine residues of core proteins of PMNs relative to monocytes. While our experiments did not differentiate between intracellular and cell surface locations, these results are consistent with differences in CS expression related to protein binding on the surfaces of PMN versus monocytes (28,29).
Our results show that all leukocytes express more CS than HS, a trend most pronounced for PMNs and monocytes. Viewed according to similarity of GAG structure, monocytes and PMNs versus lymphocytes constitute two groups related by patterns of HS and CS total abundances. The GAG expression difference between myeloid lineages (PMNs and monocytes from our study) and lymphoid lineage (B cells, T cells and NK cells) may correlate with the hematopoietic stem cell differentiation process. Detailed studies of mRNAs level of respective enzymes in precursor stem cells are necessary in order to reach solid conclusions.
Our results shed new light on GAG expression in peripheral blood cells. Such expression has traditionally been regarded as homotypic (20). Our data show, however, that CS chain length varies among leukocytes and that PMNs have elevated levels of disulfated disaccharide units with respect to other leukocytes. All leukocytes expressed highly sulfated HS chains, irrespective of their relative cytotoxicities. We were not able to determine HS relative chain lengths from these data due to low abundance. Our results demonstrate the need to isolate intracellular versus cell surface GAGs in order to provide better understanding of GAG structure and its possible roles in leukocyte biology.
Serglycin, the most abundant proteoglycan in leukocytes
Fadnes et al in their recent paper (38) demonstrated that the intracellular proteoglycan serglycin mRNA is dominant in lymphocytes including CD4+ T cells, CD8+ T cells, B cells and NK cells. They also showed that no syndecan or glypican mRNA was detected in lymphocytes, except for syndecan-4 in CD4+ T cells and CD8+ T cells. Syndecan-1 has been reported from ELISA results to be absent from hematopoietic lineage cells other than B cells (33). Because the levels of syndecan-1 in B cells are low, we conclude that the majority of HS and CS detected in our study are associated with serglycin and/or intracellular granules. Serglycin is found in intracellular granules of mast cells, macrophages, neutrophils, cytotoxic T cells and endothelial cells (41). Human serglycin has eight potential GAG attachment sites that are primarily CS except in connective mast cells where heparin is attached to the core protein. It is well established that heparin in connective mast cells participates in storage of granule proteases and in tryptase activation (42–44). Previous studies also show that serglycin is required for elastase storage in neutrophils and granzyme B storage in CTLs (25); however, the mechanisms involved in such enzyme storage are not yet clear. Therefore, it is reasonable to suspect that serglycin in neutrophils and CTLs might express highly sulfated heparin-like GAGs to promote binding of positively charged elastase and granzyme B by electrostatic interactions. To date, there have been no studies showing the detailed HS structures/compositions in leukocytes needed to develop an understanding of the storage mechanism. As shown in our study, HS expression is low in leukocytes and therefore it is difficult to get sufficient information about the HS structure using traditional biochemistry tools.
The SEC-MS methods we used show structural details of HS extracted from leukocytes. To our surprise, all the cell leukocytes populations, especially T cells, contain levels of D2S6 (around 30%) considerably higher than observed for organ derived HS other than from intestinal mucosa (4). Therefore, our study supports that such heparin-like HS plays a common role in leukocytes. This may include intracellular protease transport and storage as well as cell-surface binding of proteases. In order to support this theory, we plan to isolate intracellular and cell-surface associated GAGs in order to determine the patterns of expression of heparin-like HS. In addition, highly sulfated HS may have other biological functions that are so far not clear.
PBMC compositions in normal adults are approximately 60% T cells, 15% monocytes/macrophages, 10% B cells and 15% NK cells (45), consistent with our results (Suppl. Table 1). Thus, the levels of GAG observed in PBMC reflect a combination of the levels in T cells, B cells, NK cells and monocytes. We observed, however, that the level of HS in PBMC was higher than for T cells, B cells, NK cells and monocytes. The level of CS in PBMC was close to that of monocytes but much higher than for T cells, B cells and NK cells. We speculate that either: 1) a population of cells not isolated from PBMC contained a high level of HS and CS; or 2) the low levels of HS and CS in lymphocytes resulted from a serglycin secretion process that occurred during cell isolation (38).
GAG expression and cell activation
Our study focused on comparative glycomics of leukocyte GAGs from four healthy donors. We note that biosynthesis shifts from CS-4 (D0a4) to a mixture of CS-4 (D0a4) and CS-E (D0a10/D2a6/D2a4) when monocytes differentiate into macrophages. In addition, the expression of CS-E is further increased when macrophages are activated after differentiation (46,47). From our data, PMN from donors 2 and 4 showed higher abundances of CS-E (D0a10/D2a6/D2a4) than other cell populations. We therefore suspect that the increase in CS-E in donor 2 and donor 4 may indicate PMN activation; PMN are easily activated during isolation and the degree to which this occurs is likely to be donor-specific. Further controlled studies on GAG expression during PMN activation are needed to verify these observations.
Cell surface HS in activated CD+4 T cells are also involved in entry of human T cell leukemia virus type 1 (HTLV-1) (48). In addition, sydecans-1 and -2, bearing short heparin-like chains, are required for HTLV-1 entry into activated T cells (49). Although among syndecans, only syndecan-4 mRNA levels have been detected in inactivated T cells, both syndecan-4 and sydecan-1 mRNA levels increase during T cell activation (38). Therefore it is of interest to investigate HS structural changes in sydecan-4 and sydecan-1 proteoglycans after T cell activation.
Experimental procedures
Materials
Fresh human buffy coat was purchased from Research Blood Components, LLC (Boston, MA). Dextran solution was prepared by dissolving 20 g dextran (Sigma-Aldrich, St. Louis, MO) and 9 g NaCl in 1000 ml distilled water. The B Cell Isolation Kit II (human), Pan T Cell Isolation Kit (human), NK cell Isolation kit (human) and Pan Monocyte Isolation Kit (human) were purchased from Miltenyi Biotec (Boston, MA). Heparin lyase I was purchased from New England Biolabs (Andover, MA) and heparin lyases II and III were generous gifts from Prof. Jian Liu (UNC Eshelman School of Pharmacy, USA). Recombinant human syndecan-4 was purchased from R&D Systems (Minneapolis, MN). Heparan sulfate sodium salt from bovine kidney (HSBK) was from Sigma-Aldrich. Heparan sulfate sodium salt from porcine intestinal mucosa (HSPIM) was purchased from Celsus Laboratories (Cincinnati, OH).
Isolation of PMNs and PBMCs from human buffy coat
One unit of human blood produced approximately 50 ml buffy coat. The buffy coat was allowed to separate into two sections after adding 50 ml dextran solution for 30 min at room temperature, followed by drawing off the upper section. The lower layer was centrifuged for 10 mins at 200x g at room temperature and the pellets were re-suspended in 20 ml phosphate buffered saline (PBS) without calcium and magnesium. A volume of 10 ml Ficoll-paque Plus (GE healthcare) was then added and the mixture was centrifuged at 300x g at room temperature for 30 min. Subsequently, the white layer of cells on the top of the Ficoll-paque layer was carefully transferred into a 50 ml tubes. The cells in the white layer are PBMCs containing lymphocytes and monocytes. The PBMC layer was washed twice using PBS without calcium and magnesium and then stored at 4 °C. The pellets under the ficoll layer corresponded to the mixture of red blood cells and PMNs. The pellets were re-suspended in 10 ml endoxin-free water and mixed continuously for 30 s, followed by addition of 10 ml 1.8% NaCl. The cells were centrifuged at 200x g for 3 min at 10 °C and the pellets were re-suspended in 10 ml 0.2% NaCl. The suspension was mixed continuously for 15 s and 10ml 1.8% NaCl was added. The suspension was centrifuged at 200x g for 3 min at 10 °C to pellet PMN. The pellets were re-suspended with PBS containing 0.9 mM calcium and 0.5 mM magnesium. The cell numbers of PBMCs and PMNs were counted in three fields of a hemacytometer (Fisher Scientific). Cell viabilities were observed to be greater than 95%. Cells were counted using the formula: .
Isolation of B cells, T cells, NK cells and monocytes by negative selection kits
Taking B cell isolation for example, human B cells are isolated by depletion of non-B cells (negative selection). The commercial kit protocols were followed for this purpose.
GAG extraction from cells
Purified B cells, T cells, NK cells, monocytes, PMNs and PBMCs were divided into three aliquots and GAGs were extracted from cells in parallel except Donor 2 with GAGs extraction from only two aliquots from each purified cell populations. A 1 ml volume of cell lysis buffer (PBS buffer with 1% Triton X-100) was added to the cell pellets immediately after purification, followed by end-over-end mixing overnight at 4 °C. A 0.1 ml cell lysis buffer containing 0.2 mg protease from Streptomyces griseus (Sigma-Aldrich) was added and the lysate was incubated for 12 h at 55 °C with end-over-end mixing. After heat inactivation of the protease at 100 °C, the buffer was adjusted to 2 mM MgCl2 and 300 mU of benzonase (Sigma-Aldrich) was added. The sample was incubated at 37 °C for 3 hours. The samples were adjusted to 0.5 M NaOH and mixed end-over-end overnight at 4 °C. The pH of the samples was lowered to 5.0 using acetic acid. The samples were centrifuged at 20,000x g for 5 min at room temperature and the supernatants were transferred to a clean tube. The supernatants were diluted with 2–3 ml distilled water and then applied to a DEAE-Sepharose column. The DEAE-Sepharose columns were prepared by adding 1.4 ml DEAE-Sepharose (Sigma-Aldrich) to a 10 ml empty column (Bio-Rad). GAGs were eluted with 2.5 ml of 1 M NaCl, 20 mM NaOAc pH 6.0, and the eluates were desalted using PD-10 columns (GE healthcare). Finally, each sample was divided into three aliquots (one for heparin lyase I–III digestion and one for chondroitinase ABC digestion) and dried overnight in a vacuum concentrator.
Enzyme digestions for heparan sulfate and chondroitin sulfate
For HS digestion, one aliquot of GAG was digested with 100 mU of heparin lyase I, 10 mU of heparin lyase II, and 10 mU of heparin lyase III in a final volume of 30 μl of 20 mM Tris/HCl buffer pH7.4, in the presence of 5 mM CaCl2. The digestion was incubated at 37 °C for 5 h and a second aliquot of the lyase I, II, III mixture was added prior to overnight incubation at 37 °C (4).
For CS digestion, one aliquot of GAG was digested with 20 mU of chondroitinase ABC in a final volume of 30 μl of 25 mM Tris/HCl buffer pH8.0, in the presence of 5 mM NH4OAc. The digestion was incubated at 37 °C for 5 h and a second aliquot of chondroitinase ABC was the added prior to overnight incubation at 37 °C.
SEC-MS analysis
The SEC column (Superdex™ peptide PC 3.2/30) was purchased from GE healthcare. The mobile phase for disaccharides analysis was 90% 12.5 mM formate acid, pH adjusted to 4.4 using ammonium hydroxide, 10% acetonitrile. The liquid chromatography was conducted using a Waters Acquity UltraPerformance LC system and disaccharides were analyzed using an Applied Biosystems QSRAR Pulsar-I mass spectrometer operating in negative mode, as previously described (4). A 20 pmol quantity of ΔHexA2S-GlcNCoEt(6S) (Iduron) was added to all samples as an internal standard. An Ionization efficiency correction factor for each disaccharide relative to nonsulfated disaccharide DOA0 was applied to calculation of disaccharide abundances. The abundances of disaccharides were normalized to 10 million cells.
Tandem Mass Spectrometry for D0a4/D0a6 mixture
Using SEC-MS, the elution time for monosulfated disaccharide D0a4/D0a6 is 99 min. Collision energy (−30 eV) was applied from 95.5 min to 102.5 min. A set of D0a4/D0a6 disaccharide standards mixtures (1:0, 3:1, 2:1,1:1,1:2, 1:3, and 0:1) was made using commercial standards (V-Labs) and injected separately for SEC-tandem mass spectrometry analysis to establish a relationship between D0a4/(D0a4+D0a6) and Y1 ion/(Y1+Z1) ion.
Supplementary Material
Acknowledgments
This work was supported by NIH grants P41GM104603 and R01HL098950.
Abbreviations list
- CS
chondroitin sulfate
- CTLs
cytotoxic T lymphocytes
- DS
dermatan sulfate
- ELISA
enzyme-linked immunosorbent assay
- EICs
extracted ion chromatograms
- GAGs
glycosaminoglycans
- Gal
galactose
- GalNAc
N-acetylgalactosamine
- GlcNAc
N-acetylglucosamine
- GlcN
glucosamine
- HexA
hexuronic acid
- HS
heparan sulfate
- HSBK
HS from bovine kidney
- HSPIM
HS from porcine intestinal mucosa
- IdoA
iduronic acid
- PBMCs
peripheral blood mononuclear cells
- PGs
proteoglycans
- PMNs
polymorphonuclear leukocytes
- SEC-MS
size exclusion chromatography-mass spectrometry
- TIC
total ion chromatograms
- Xyl
xylose
Footnotes
List of supplementary material:
One pdf file containing Supplementary Figures 1-4 and Supplementary Table 1.
References
- 1.Esko JD, Selleck SB. Annu Rev Biochem. 2002;71:435–471. doi: 10.1146/annurev.biochem.71.110601.135458. [DOI] [PubMed] [Google Scholar]
- 2.Bulow HE, Tjoe N, Townley RA, Didiano D, van Kuppevelt TH, Hobert O. Curr Biol. 2008;18:1978–1985. doi: 10.1016/j.cub.2008.11.023. [DOI] [PMC free article] [PubMed] [Google Scholar]
- 3.Maccarana M, Sakura Y, Tawada A, Yoshida K, Lindahl U. J Biol Chem. 1996;271:17804–17810. doi: 10.1074/jbc.271.30.17804. [DOI] [PubMed] [Google Scholar]
- 4.Shi X, Zaia J. J Biol Chem. 2009;284:11806–11814. doi: 10.1074/jbc.M809637200. [DOI] [PMC free article] [PubMed] [Google Scholar]
- 5.Staples GO, Shi X, Zaia J. PLoS ONE. 2011;6:e16689. doi: 10.1371/journal.pone.0016689. [DOI] [PMC free article] [PubMed] [Google Scholar]
- 6.Maccarana M, Olander B, Malmstrom J, Tiedemann K, Aebersold R, Lindahl U, Li JP, Malmstrom A. J Biol Chem. 2006;281:11560–11568. doi: 10.1074/jbc.M513373200. [DOI] [PubMed] [Google Scholar]
- 7.Silbert JE, Sugumaran G. IUBMB Life. 2002;54:177–186. doi: 10.1080/15216540214923. [DOI] [PubMed] [Google Scholar]
- 8.Sugumaran G, Silbert JE. J Biol Chem. 1989;264:3864–3868. [PubMed] [Google Scholar]
- 9.Staples GO, Shi X, Zaia J. J Biol Chem. 2010;285:18336–18343. doi: 10.1074/jbc.M110.101592. [DOI] [PMC free article] [PubMed] [Google Scholar]
- 10.Hardingham T, Bayliss M. Semin Arthritis Rheum. 1990;20:12–33. doi: 10.1016/0049-0172(90)90044-g. [DOI] [PubMed] [Google Scholar]
- 11.Bayliss MT, Osborne D, Woodhouse S, Davidson C. J Biol Chem. 1999;274:15892–15900. doi: 10.1074/jbc.274.22.15892. [DOI] [PubMed] [Google Scholar]
- 12.Fransson LA, Coster L, Havasmark B, Malmstrom A, Sjoberg I. Biochem J. 1974;143:379–389. doi: 10.1042/bj1430379. [DOI] [PMC free article] [PubMed] [Google Scholar]
- 13.Fransson LA, Coster L, Malmstrom A, Sjoberg I. Biochem J. 1974;143:369–378. doi: 10.1042/bj1430369. [DOI] [PMC free article] [PubMed] [Google Scholar]
- 14.Sugahara K, Mikami T. Curr Opin Struct Biol. 2007;17:536–545. doi: 10.1016/j.sbi.2007.08.015. [DOI] [PubMed] [Google Scholar]
- 15.Cheng F, Heinegard D, Malmstrom A, Schmidtchen A, Yoshida K, Fransson LA. Glycobiology. 1994;4:685–696. doi: 10.1093/glycob/4.5.685. [DOI] [PubMed] [Google Scholar]
- 16.Desaire H, Sirich TL, Leary JA. Anal Chem. 2001;73:3513–3520. doi: 10.1021/ac010385j. [DOI] [PubMed] [Google Scholar]
- 17.Kerby GP. The Journal of clinical investigation. 1955;34:1738–1743. doi: 10.1172/JCI103228. [DOI] [PMC free article] [PubMed] [Google Scholar]
- 18.Clausen J, Andersen V. Clinica Chimica Acta. 1963;8:505–512. doi: 10.1016/0009-8981(63)90096-2. [DOI] [PubMed] [Google Scholar]
- 19.Olsson I, Gardell S. Biochimica et biophysica acta. 1967;141:348–357. doi: 10.1016/0304-4165(67)90109-2. [DOI] [PubMed] [Google Scholar]
- 20.Kolset SO, Gallagher JT. Biochimica et biophysica acta. 1990;1032:191–211. doi: 10.1016/0304-419x(90)90004-k. [DOI] [PubMed] [Google Scholar]
- 21.Levitt D, Porter R, Wagner-Weiner L. Mol Immunol. 1986;23:1125–1132. doi: 10.1016/0161-5890(86)90011-8. [DOI] [PubMed] [Google Scholar]
- 22.Hart GW. Biochemistry. 1982;21:6088–6096. doi: 10.1021/bi00267a010. [DOI] [PubMed] [Google Scholar]
- 23.Stevens RL, Kamada MM, Serafin WE. Curr Top Microbiol Immunol. 1989;140:93–108. doi: 10.1007/978-3-642-73911-8_8. [DOI] [PubMed] [Google Scholar]
- 24.Stellrecht CM, Mars WM, Miwa H, Beran M, Saunders GF. Differentiation. 1991;48:127–135. doi: 10.1111/j.1432-0436.1991.tb00251.x. [DOI] [PubMed] [Google Scholar]
- 25.Pejler G, Abrink M, Wernersson S. BioFactors. 2009;35:61–68. doi: 10.1002/biof.11. [DOI] [PubMed] [Google Scholar]
- 26.Kolset SO, Prydz K, Pejler G. Biochem J. 2004;379:217–227. doi: 10.1042/BJ20031230. [DOI] [PMC free article] [PubMed] [Google Scholar]
- 27.Petersen F, Brandt E, Lindahl U, Spillmann D. The Journal of biological chemistry. 1999;274:12376–12382. doi: 10.1074/jbc.274.18.12376. [DOI] [PubMed] [Google Scholar]
- 28.Niemann CU, Abrink M, Pejler G, Fischer RL, Christensen EI, Knight SD, Borregaard N. Blood. 2007;109:4478–4486. doi: 10.1182/blood-2006-02-001719. [DOI] [PubMed] [Google Scholar]
- 29.Niemann CU, Cowland JB, Klausen P, Askaa J, Calafat J, Borregaard N. J Leukocyte Biol. 2004;76:406–415. doi: 10.1189/jlb.1003502. [DOI] [PubMed] [Google Scholar]
- 30.Campbell EJ, Owen CA. The Journal of biological chemistry. 2007;282:14645–14654. doi: 10.1074/jbc.M608346200. [DOI] [PubMed] [Google Scholar]
- 31.Kilpatrick LM, Harris RL, Owen KA, Bass R, Ghorayeb C, Bar-Or A, Ellis V. Blood. 2006;108:2616–2623. doi: 10.1182/blood-2006-02-001073. [DOI] [PubMed] [Google Scholar]
- 32.Balaji KN, Schaschke N, Machleidt W, Catalfamo M, Henkart PA. The Journal of experimental medicine. 2002;196:493–503. doi: 10.1084/jem.20011836. [DOI] [PMC free article] [PubMed] [Google Scholar]
- 33.Sanderson RD, Borset M. Ann Hematol. 2002;81:125–135. doi: 10.1007/s00277-002-0437-8. [DOI] [PubMed] [Google Scholar]
- 34.Manon-Jensen T, Itoh Y, Couchman JR. FEBS J. 2010;277:3876–3889. doi: 10.1111/j.1742-4658.2010.07798.x. [DOI] [PubMed] [Google Scholar]
- 35.Ramani VC, Pruett PS, Thompson CA, DeLucas LD, Sanderson RD. J Biol Chem. 2012;287:9952–9961. doi: 10.1074/jbc.M111.330803. [DOI] [PMC free article] [PubMed] [Google Scholar]
- 36.Jilani I, Wei C, Bekele BN, Zhang ZJ, Keating M, Wierda W, Ferrajoli A, Estrov Z, Kantarjian H, O’Brien SM, Giles FJ, Albitar M. Int J Lab Hematol. 2009;31:97–105. doi: 10.1111/j.1751-553X.2007.01010.x. [DOI] [PMC free article] [PubMed] [Google Scholar]
- 37.Minowa K, Amano H, Nakano S, Ando S, Watanabe T, Nakiri Y, Amano E, Tokano Y, Morimoto S, Takasaki Y. Autoimmunity. 2011;44:357–362. doi: 10.3109/08916934.2010.545846. [DOI] [PubMed] [Google Scholar]
- 38.Fadnes B, Husebekk A, Svineng G, Rekdal O, Yanagishita M, Kolset SO, Uhlin-Hansen L. Glycoconjugate journal. 2012;29:513–523. doi: 10.1007/s10719-012-9427-9. [DOI] [PMC free article] [PubMed] [Google Scholar]
- 39.Lawrence R, Lu H, Rosenberg RD, Esko JD, Zhang L. Nat Methods. 2008;5:291–292. doi: 10.1038/nmeth0408-291. [DOI] [PubMed] [Google Scholar]
- 40.Thelin M, Svensson KJ, Shi X, Bagher M, Axelsson J, Isinger-Ekstrand A, van Kuppevelt TH, Johansson J, Nilbert M, Zaia J, Belting M, Maccarana M, Malmstrom A. Cancer Res. 2012;72:1943–1952. doi: 10.1158/0008-5472.CAN-11-1351. [DOI] [PMC free article] [PubMed] [Google Scholar]
- 41.Kolset SO, Tveit H. Cell Mol Life Sci. 2008;65:1073–1085. doi: 10.1007/s00018-007-7455-6. [DOI] [PMC free article] [PubMed] [Google Scholar]
- 42.Humphries DE, Wong GW, Friend DS, Gurish MF, Qiu WT, Huang C, Sharpe AH, Stevens RL. Nature. 1999;400:769–772. doi: 10.1038/23481. [DOI] [PubMed] [Google Scholar]
- 43.Hallgren J, Spillmann D, Pejler G. The Journal of biological chemistry. 2001;276:42774–42781. doi: 10.1074/jbc.M105531200. [DOI] [PubMed] [Google Scholar]
- 44.Forsberg E, Pejler G, Ringvall M, Lunderius C, Tomasini-Johansson B, Kusche-Gullberg M, Eriksson I, Ledin J, Hellman L, Kjellen L. Nature. 1999;400:773–776. doi: 10.1038/23488. [DOI] [PubMed] [Google Scholar]
- 45.Plebanski M. Preparation of lymphocytes and idenfication of lymphocyte subpopulations. In: Rowland-Jones S, McMichael AJ, editors. Lymphocytes: A Practical Approach. Oxford University Press; 1999. p. 10. [Google Scholar]
- 46.Kolset SO, Kjellen L, Seljelid R, Lindahl U. The Biochemical journal. 1983;210:661–667. doi: 10.1042/bj2100661. [DOI] [PMC free article] [PubMed] [Google Scholar]
- 47.Kolset SO, Seljelid R, Lindahl U. The Biochemical journal. 1984;219:793–799. doi: 10.1042/bj2190793. [DOI] [PMC free article] [PubMed] [Google Scholar]
- 48.Jones KS, Petrow-Sadowski C, Bertolette DC, Huang Y, Ruscetti FW. J Virol. 2005;79:12692–12702. doi: 10.1128/JVI.79.20.12692-12702.2005. [DOI] [PMC free article] [PubMed] [Google Scholar]
- 49.Tanaka A, Jinno-Oue A, Shimizu N, Hoque A, Mori T, Islam S, Nakatani Y, Shinagawa M, Hoshino H. J Virol. 2012;86:2959–2969. doi: 10.1128/JVI.05783-11. [DOI] [PMC free article] [PubMed] [Google Scholar]
Associated Data
This section collects any data citations, data availability statements, or supplementary materials included in this article.


