Abstract
Chitosan has been used as a scaffolding material in tissue engineering due to its mechanical properties and biocompatibility. With increased appreciation of the effect of micro- and nanoscale environments on cellular behavior, there is increased emphasis on generating microfabricated chitosan structures. Here we employed a microfluidic coaxial flow-focusing system to generate cell adhesive chitosan microtubes of controlled sizes by modifying the flow rates of a chitosan pre-polymer solution and phosphate buffered saline (PBS). The microtubes were extruded from a glass capillary with a 300 μm inner diameter. After ionic crosslinking with sodium tripolyphosphate (TPP), fabricated microtubes had inner and outer diameter ranges of 70-150 μm and 120-185 μm. Computational simulation validated the controlled size of microtubes and cell attachment. To enhance cell adhesiveness on the microtubes, we mixed gelatin with the chitosan pre-polymer solution and adjusted the pH values of the chitosan pre-polymer solution with gelatin and TPP. During the fabrication of microtubes, fibroblasts suspended in core PBS flow adhered to the inner surface of chitosan-gelatin microtubes. To achieve physiological pH values, we adjusted pH values of chiotsan pre-polymer solution and TPP. In particular, we were able to improve cell viability to 92% with pH values of 5.8 and 7.4 for chitosan and TPP solution respectively. Cell culturing for three days showed that the addition of the gelatin enhanced cell spreading and proliferation inside the chitosan-gelatin microtubes. The microfluidic fabrication method for ionically crosslinked chitosan microtubes at physiological pH can be compatible with a variety of cells and used as a versatile platform for microengineered tissue engineering.
Keywords: Chitosan-Gelatin Hydrogel, Microfluidic Flow-Focusing, Microtube, Cell Viability
1 Introduction
One approach in tissue engineering focuses on cell-laden microstructures to generate tissue-like structures (Khademhosseini et al. 2006; Khademhosseini and Langer 2007; Nichol et al. 2010). The use of natural polymers as biomaterials for tissue engineering applications is especially advantageous due to their biocompatibility and close structural and biological similarity to the extracellular matrix (ECM) (Cortes-Morichetti et al. 2007; Kang et al. 2011; Mano et al. 2007; Nicodemus and Bryant 2008; Tan and Takeuchi 2007; Williams et al. 2005). Chitosan, a naturally occurring biopolymer known for its biocompatibility and biodegradability, is one such material (Peniche et al. 2003; Shi et al. 2006). Chitosan is a natural cationic polysaccharide consisting of D-glucosamine and N-acetyl-D-glucosamine units (Francis Suh and Matthew 2000). Due to its cationic nature, it is intrinsically bioadhesive, hemostatic and antimicrobial (Arca and Senel 2008; Domb et al. 2011; Pati et al. 2011). Chitosan is also known to bind and prolong the activity of growth factors, which promotes both cell-cell and cell-matrix interactions (Fuller et al. 1991; Kim et al. 2001; Lenlein and Sisson 2011; Malafaya et al. 2007). Furthermore, chitosan readily forms a hydrogel by ionic crosslinking. Therefore, chitosan has been widely used in various biomedical applications such as drug delivery, wound dressing, and implantable artificial tissue scaffolds (Eser Elcin et al. 1998; Fukuda et al. 2006; Ji et al. 2011a; Ji et al. 2011b; Jin et al. 2006; Richardson et al. 2008; Senel and McClure 2004; Shi et al. 2006; Zhang and Zhang 2004).
Recently, several microfabrication techniques have been utilized to develop chitosan-based microstructures to maximize the utility of chitosan in tissue engineering applications. Currently there are three major types of chitosan microstructures used in tissue engineering; microspheres, microfibers, and thin films. Chitosan microspheres are commonly fabricated by emulsions crosslinking with pre-polymer solutions, where the emulsions are generated either by water-in-oil emulsification or microfluidic flow-focusing (Lee et al. 2004; Mercier et al. 2005; Sinha et al. 2004). Chitosan microspheres have been successfully used for the delivery of adipose-derived mesenchymal stem cell into collagen gels (Natesan et al. 2010). Chitosan microfibers were generated by using microfluidic flow-focusing or electrospinning techniques (Kang et al. 2010; Yeh et al. 2010; Yeh et al. 2009; Zhang et al. 2006). Chitosan core and sodium tripolyphosphate (TPP) sheath flow formed ionically crosslinked chitosan microfibers for engineering a bio-artificial liver chip (Lee et al. 2010). Electrospun chitosan microfiber was also used as a scaffold to support attachment and viability of rat muscle-derived stem cells (Kang et al. 2010; Yeh et al. 2010; Zhang et al. 2006). Chitosan thin films were patterned by casting chitosan in acetic acid for bone cell attachment and growth studies, and by evaporating anhydroalcoholic solutions of chitosan hydrochloride for the treatment of third-degree burn injuries (Boucard et al. 2007; Hamilton et al. 2007; Ligler et al. 2001; Sionkowska et al. 2006).
Although these types of microstructures have been used to study cell behaviors in different microenvironments, two main challenges remain for the employment of chitosan for tissue engineering. One is the lack of miniaturization techniques for patterning and crosslinking chitosan to create functional and well-defined 3D microstructures. The second challenge is the acidic condition of chitosan and TPP during processing steps, which results in cytotoxicity and precludes the in situ cell-loading of chitosan microstructures. This leads to a cumbersome three-step fabrication procedure consisting of microstructure generation, pH neutralization, and finally cell seeding on the surface of the microstructure (Lee et al. 2010).
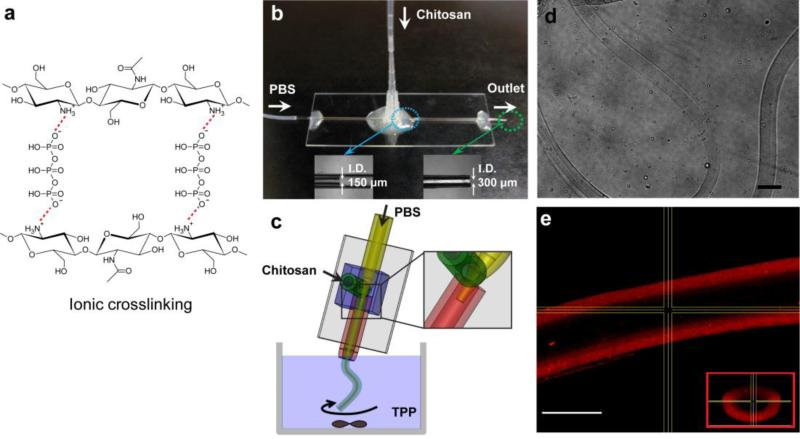
To address these challenges, we propose a microfluidic method for generating cell adhesive chitosan microtubes in a single fabrication step. Simple glass capillary system (Fig. 1b-c) was fabricated for coaxial flow of chitosan pre-polymer solution as the outer phase and buffered solution as the inner phase. This one-step microfluidic system is capable of continuously generating microtubes of controlled sizes by changing flow rates of the two liquid phases (Lee et al. 2011; Takei et al. 2010). After exiting the collection capillary into an off-chip reservoir containing TPP, an ionic crosslinker, the chitosan pre-polymer was instantly crosslinked to form microtube. Computer simulation was used to correlate the relationship between the reaction parameters, such as concentration and flow rate, with the microtube dimensions. In addition, we investigated the effect of pH values of the chitosan pre-polymer solution and TPP on cell adhesion and viability in culture.
Fig. 1.
(a) Ionic interaction of chitosan with the crosslinker TPP, (b) photograph of the flow-focusing microtube generator on a 25 mm × 75 mm glass slide, (c) schematic of chitosan microtube fabrication, (d) phase-contrast photograph of a long chitosan microtube (scale bar: 200 μm), and (e) confocal microscopic image of a chitosan microtube with fluorescently labeled BSA in PBS (scale bar: 100 μm). The inset shows the microtube cross-section.
2 Materials and methods
2.1 Materials
Chitosan powder was purchased from Sigma-Aldrich (St. Louis, MO, USA) and dissolved in a 0.5 M solution of acetic acid. The degree of deacetylation was 75-85% and the molecular weight was 50-190 kDa. Chitosan is a weak cationic polysaccharide; the pKa value of the D-glucosamine residue is reported in the literature to be 6.5 (Anthonsen and Smidsrød 1995). TPP was also obtained from Sigma-Aldrich and a 1% (w/v) solution in deionized water was used. All other reagents used in this study were of analytical grade.
2.2 Microfluidic device for coaxial flow-focusing
Fig. 1 shows the microfluidic device consisting of two glass capillaries, two inlets for a chitosan pre-polymer solution and PBS, and one outlet. Using the heat-drawing process, two glass capillaries (World Precision Instruments, Inc., FL, USA) with inner diameters of 580 μm were manually pulled to reach inner diameters of 150 μm for PBS inlet and 300 μm for the outlet, respectively. Smaller capillary was inserted into the larger one. The outer surface of the larger glass capillary (used as the collection capillary) was coated with poly(dimethylsiloxane) (PDMS) to prevent wetting at the end of outlet. Both capillaries were glued to a 25 mm × 75 mm glass slide using an epoxy. Then, two holes on the bottom of a 0.1-10 μL pipette tip were cut with a razor blade. The tip was fitted and permanently glued over the connection point of two capillaries. This carved tip was used as the inlet connector for the chitosan pre-polymer solution.
2.3 Simulation for predicting microtube fabrication
A 3D model using COMSOL Multiphysics was generated to analyze velocity and diffusion of chitosan pre-polymer solution and PBS (Fig. 2). The modeled geometry had the same dimensions as the flow-focusing structure. In correspondence with the experiments, the chitosan pre-polymer solution and PBS were introduced into a main glass capillary as outer (shell) and inner (core) phases. Assuming laminar flow and steady state, laminar flow variables were solved using incompressible Navier-Stokes equations:
| (1) |
| (2) |
, where ρ is fluid density (1000 kg/m3), p is fluid pressure, I is a unit diagonal matrix, η is dynamic viscosity (0.294 Pa·s for the measured viscosity of 3% (w/v) chitosan pre-polymer solution and 0.001 Pa·s for the viscosity of PBS equivalent to water), u=(x, y, z) is velocity, and F is the volume force leading to material deformation (F=0 in this case). Boundary conditions were velocities of PBS (0.047, 0.063, and 0.078 m/s) and the chitosan pre-polymer (0.0082 m/s) solution at the inlet of the capillary, zero pressure at the outlet, and no-slip condition on the capillary wall. In the multiphysics of Convection and Diffusion, assuming steady state, variables were solved using the equation:
| (3) |
, where c is the concentration, D is the diffusion coefficient (2.87×10⁻¹⁰ m2/s for chitosan diffusion coefficient in PBS from the Wilke-Chang diffusion equation (Miyabe and Isogai 2011)), and Rt is the reaction rate (Rt = 0, because the crosslinking begins after the generation of microtubes). Here, the boundary conditions included concentration values at the capillary inlet (0.25 and 0 mol/m3 for initial concentrations of the chitosan pre-polymer and PBS, respectively), convective flux at the capillary outlet, and insulation/symmetry as the default on the wall.
Fig. 2.
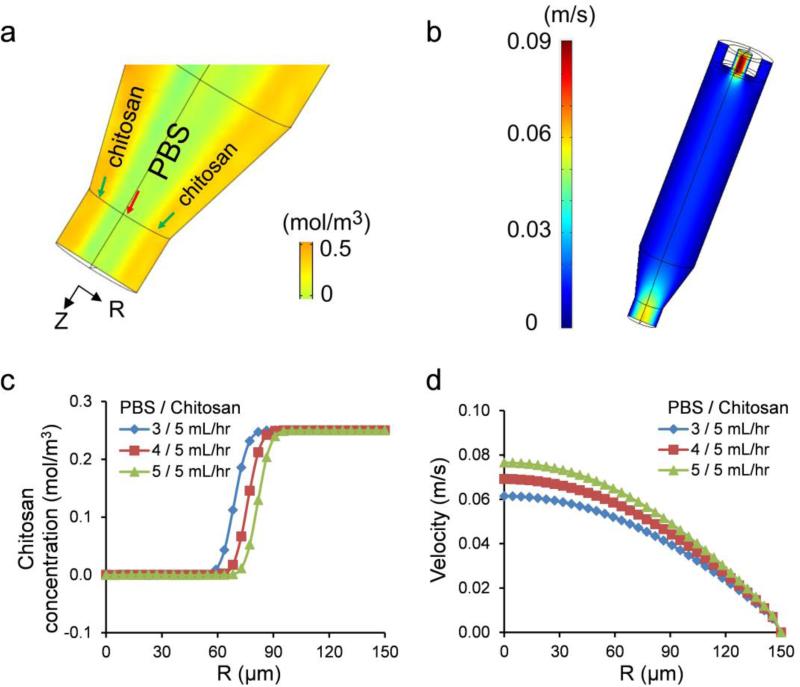
3D simulation results for 3% chitosan microtube generation at the flow rates of 3, 4, and 5 mL/hr (PBS) and 5 mL/hr (chitosan pre-polymer solution); (a) concentration (mol/m3) profile (yellow: chitosan and light green: PBS), (b) velocity (m/s) profile, (c) chitosan concentration at the cross-section of microtube outlet, and (d) velocity of the flowing liquids at the end of outlet as a function of structure radius and PBS flow rate.
Extremely fine mesh was selected from predefined mesh sizes list. First, variables in the incompressible Navier-Stokes relation were solved and stored using the PARDISO solver sequence. Then, we used these values to compute diffusion variables. Velocity, concentration, and particle tracking plots were generated in the post-processing and visualization step. With the particle tracking plot option, particle pathlines can be visualized as trajectories of particle released in a flow field. The motion of particles does not affect the flow field.
2.4 Fabrication of chitosan microtubes
A 3% (w/v) chitosan pre-polymer solution and a 1% (w/v) TPP solution were prepared by dissolving chitosan powder and TPP in a 0.5 M acetic acid solution and deionized water, respectively, under continuous stirring. After filtering through a syringe filter, the homogeneous solutions were transferred to two gastight glass syringes. The syringes were controlled using high-precision syringe pumps (Harvard PhD 2000, Harvard Apparatus, MA, USA).
As shown in the fabrication schematic (Fig. 1c), one syringe pump was used to infuse PBS into the large glass capillary via tubing; the second syringe pump independently injected the chitosan pre-polymer solution into the micropipette tip. In this arrangement PBS and the chitosan pre-polymer solution formed core and sheath flows inside the small glass capillary, without breaking up into droplets or forming unstable jetting flow. The inner diameter of chitosan microtube was controlled by modifying flow rates of the chitosan pre-polymer solution relative to the PBS flow rate. The tested flow rates were 3/5, 4/5, and 5/5 (PBS/chitosan, all in mL/hr). We measured the inner and outer diameters of the formed microtubes in wet and dry states using an inverted microscope (TE 2000-U, Nikon, Japan). To verify that the generated microtubes were hollow, we fabricated microtubes with fluorescently labeled Bovine Serum Albumin (BSA) and imaged it at a magnification of 20X under a confocal fluorescence microscope (SP5 X MP Inverted, Leica, Germany).
2.5 Mechanical testing
Mechanical properties of the chitosan and chitosan-gelatin composite hydrogels were determined in an unconfined compression test using the materials testing system (Instron 5542, Norwood, MA, USA). The load was measured using a 10 N load cell and the strain rate was fixed at 1 mm/min. Cylindrical samples with 8 mm in diameter and 2 mm in thickness were prepared. All samples were allowed to swell for 6 hours in PBS at room temperature before the mechanical testing. The compressive modulus E was determined by calculating the slope of the linear region in the 0-10% strain. Fractured stress and fractured strain were determined from the point where a sudden decrease (10%) in stress was observed.
2.6 Cell culture
NIH-3T3 fibroblasts were cultured in Dulbecco's Modified Eagle Medium (DMEM, high glucose, Invitrogen, NY, USA) supplemented by 10% fetal bovine serum (FBS, Invitrogen, NY, USA) and 1% penicillin-streptomycin (Invitrogen, NY, USA). The cells were incubated at 5% of CO2 and 37 °C, passaged every four days and the media was refreshed every two days.
2.7 Microfluidic fabrication of cell adhesive chitosan microtubes
Chitosan pre-polymer solutions were prepared by adjusting the pH values to 3.5, 4.1, and 5.8 with 1 M NaOH, then mixed with 1% (w/v) gelatin for improving biocompatibility and mechanical stability (Huang et al. 2005). TPP solutions were adjusted to the pH values of 9.5, 8.5, 8.0, and 7.4 with 1 M HCl.
NIH-3T3 fibroblasts (2×10⁷ cells/mL) were trypsinized, collected and resuspended in PBS. The cell solution was passed through a 25G needle to filter out large cell aggregates and transferred into a 5 mL gastight syringe.
Chitosan-gelatin pre-polymer solution and cell-containing PBS were introduced into the device. Microtubes were continuously generated at flow rates of 5 mL/hr for both PBS and chitosan pre-polymer solution and subsequently polymerized in TPP. Crosslinked microtubes were washed with PBS three times.
After culturing the cells inside the microtubes for 5 hours, cell viability was examined using the LIVE/DEAD® Viability Cytotoxicity Kit (Invitrogen, NY, USA). The LIVE/DEAD assay of 0.5 μL/mL calcein-AM (green) and 2 μL/mL ethidium homodimer-1 (red) was diluted in PBS. Microtubes with cells in the assay were incubated at 37 °C for 15 minutes and washed with PBS three times. Green-fluorescent live cells and redflorescent dead cells were imaged under an inverted fluorescence microscope.
2.8 Statistical analysis
One-way ANOVA was used to determine statistical significant difference between two groups. p<0.05 was considered statistically significant and reported here. All experimental tests were conducted with n=4 and the results listed here are shown as mean ± standard deviation.
3 Results and Discussion
3.1 Size-controlled chitosan microtubes
The microfluidic device was developed in this study to allow a coaxial flow of two different solutions (Fig 1a-b). Due to the large difference in viscosity between 3% chitosan pre-polymer solution (0.294 Pa·s) and PBS (0.001 Pa·s), we predicted that the two solutions would not undergo significant mixing within the coaxial flow channel above a certain flow rate and chitosan concentration. The microtubular shape of the chitosan solution would then be maintained upon exiting the channel outlet and into the TPP reservoir, due to the instantaneous ionic crosslinking reaction between chitosan and TPP (Fig. 1c).
To determine the relationship between the PBS flow rates and microtube dimensions, a computer-based simulation model was applied to solve the two-phase laminar flow problem coupled with diffusion. According to the simulation results in Fig. 2, the outer diameter of chitosan microtubes is set by the inner diameter (300 μm) of the glass capillary, while the inner diameter of microtubes is proportional to the PBS flow rate. At the PBS flow rates of 3, 4, and 5 mL/hr, the average inner diameters of the microtubes were predicted to be approximately 130, 150, and 170 μm, respectively. In addition, there is no apparent diffusion of chitosan solution into PBS (Fig. 2a, c), which indicates that the difference in viscosity and the flow rate of PBS was sufficient to minimize the mixing between the two solutions. Outlet velocity results show that there was a significant difference in outlet velocity between outer chitosan pre-polymer solution and inner PBS also contributes to the minimal diffusion between the two solutions (Fig. 2b, d). On the other hand, when the concentration of chitosan pre-polymer solution was 2 % (viscosity: 0.09 Pa·s), and the flow rates of PBS and chitosan pre-polymer solution were 0.3 and 1 mL/hr, there was significant diffusion of chitosan into PBS (Supporting Information; Fig. S1).
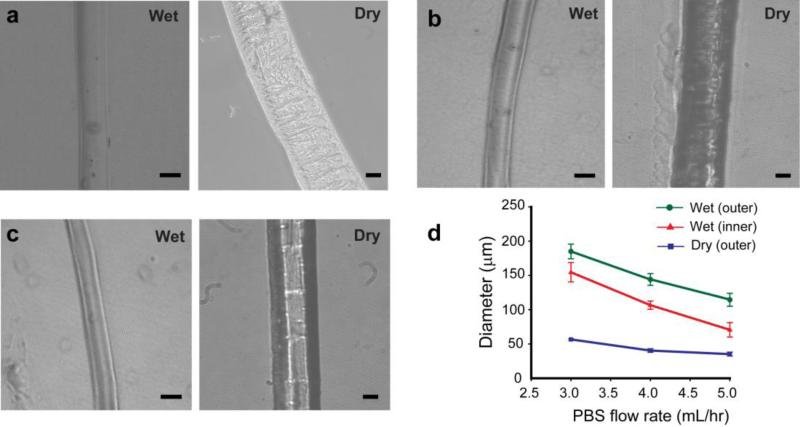
The chitosan microtubes with a uniform diameter and a well-defined inner channel were generated (Fig. 1d-e). In addition, the inner diameter of the chitosan microtube could be controlled by varying the flow rate of PBS from 3 to 5 mL/hr, as predicted by the simulation (Fig. 3). We used computational simulation to predict initial inner diameter of the microtube generated in the device prior to crosslinking. With this result, we investigated a relationship between the tube size change and chitosan amount after crosslinking. It is that thicker tube includes more chitosan amount resulting in more shrinkage. Therefore, the overall dimensions of the microtubes became smaller over time. The microtubes continued to shrink and became opaque with rougher surface after initial gelation. As a result, the diameter and thickness of all microtubes were decreased during the crosslinking reaction. These observations indicate that there was a gradual increase in crosslinking density by the influx of TPP into the microtubes. Also, thicker microtubes, at higher flow rate of PBS, became proportionally narrower than thinner ones. We hypothesize that thicker microtubes contained larger amounts of chitosan molecules ionically crosslinked. More ionic bonds led to a higher shrinkage factor. These results indicate the flexibility in fabricating various sizes of chitosan microtubes using the same device simply by adjusting flow rates of the chitosan pre-polymer solution and PBS.
Fig. 3.
Microtubes generated at flow rates of (a) 5 mL/hr (chitosan pre-polymer solution) and 3 mL/hr (PBS), (b) 5 mL/hr and 4 mL/hr, and (c) 5 mL/hr and 5 mL/hr. (d) Variation in size of chitosan microtubes as a function of PBS flow rate. (scale bar: 100 μm in wet and 20 μm in dry state)
Separately, we have fabricated microtubes with chitosan concentration of 2 % (w/v) and the flow rates of 0.3 mL/hr (PBS) and 1 mL/hr (chitosan pre-polymer solution), which were expected to show significant diffusion of chitosan into PBS by the simulation result (Fig. S1). As predicted, the inner channel of microtube was not properly formed, as evidenced by intrusions from the microtube wall to the channel (Supporting Information; Fig. S2). In addition, at the low chitosan concentration, the microtube structure did not maintain properly in TPP, likely due to the low crosslinking density.
3.2 Mechanical testing
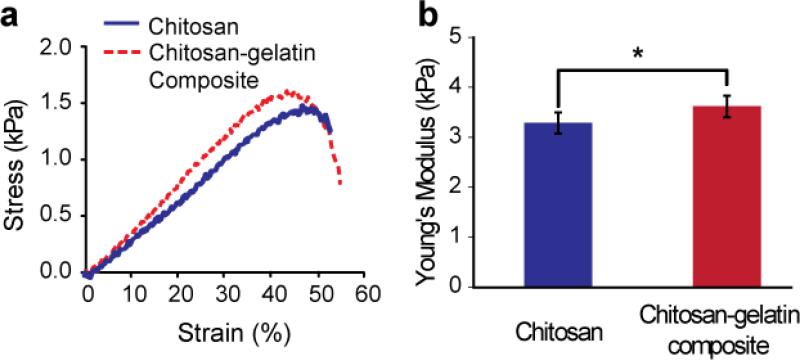
The mechanical properties of chitosan and chitosan-gelatin hydrogels were determined in an unconfined compression test and the representative stress-strain curves of each composition are summarized in Fig. 4. Gelatin was incorporated into chitosan hydrogel for the purpose of promoting cell attachment. A linear increase in stress was observed with increasing strain in both samples. The Young's modulus of the hydrogel was determined from the initial slope of the stress-strain curve. The compressive moduli of chitosan and chitosan-gelatin hydrogels were 3.29±0.21 kPa and 3.62±0.22 kPa, respectively. A statistically significant increase (10%) in modulus was observed upon addition of gelatin. It is suggested that the interaction between chitosan and gelatin molecules may have led to a greater structurally rigidity than the pure chitosan hydrogel (Thein-Han et al. 2009). The fracture stress for chitosan-gelatin hydrogels (1.4±0.05 kPa) was slightly higher compared to the chitosan hydrogels (1.25±0.25 kPa), however no significant difference was observed. Similarly, no significant difference was observed in fracture strain for chitosan (43±6.7%) and chitosan-gelatin (47±1.2%).
Fig. 4.
Compressive strength test results. (a) Stress-strain curves and (b) Young's modulus of chitosan and chitosan-gelatin composite hydrogels. (*p < 0.05)
3.3 Promoting biocompatibility of chitosan-gelatin microtubes by adjusting pH
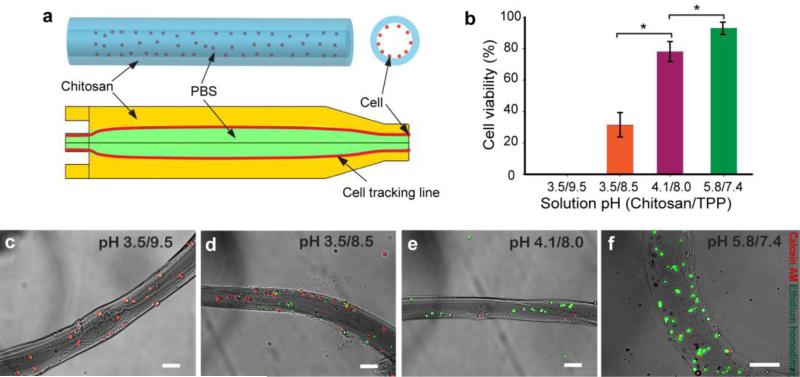
To demonstrate the applicability of the one-step method for generating cell adhesive chitosan microtubes, we adjusted pH values of the chitosan-gelatin pre-polymer solution as well as TPP. The particle tracking simulation indicated cell attachment to the inner wall of the microtubes at the applied flow rate of 5 mL/hr rather than all cells remaining in the PBS phase (Fig. 5a). From the expected pathline of cells in a simulated flow field, cells released close to the inner wall of the microtube have a chance to be attached. However, cells released at the center of the microtube will be passed through the microtube. As predicted, the majority of cells were attached on the inner wall of the microtubes. In addition, the presence of cells did not affect the shape of the generated microtubes.
Fig. 5.
Cells were seeded inside chitosan-gelatin microtubes. (a) Schematic description of the microtube with cells suspended in the inner phase and the result of the cell tracking simulation showing cells (red line) passing the chitosan-gelatin outer phase. (b) The cell viability in response to pH changes in chitosan pre-polymer and TPP solutions. (c), (d), (e), and (f) show live/dead microscopy images of 3T3 fibroblasts (green: live cells; red: dead cells) at viability values of 0, 31.5±7.6, 76.6±6.1, and 91.7±3.1%. (scale bar: 100 μm)
The cell viability results show that the acidic chitosan-gelatin solution was still toxic to cells (Fig. 5b), although the pH of 3.5 was neutralized during crosslinking with TPP at pH 9.5. In comparison, lowering the pH of TPP to 8.5 increased the cell viability up to 31.5±7.6%, although the chitosan-gelatin pH value remained unchanged (Fig. 5c). Further increase of the pre-polymer solution pH and decrease of TPP pH values improved the cell viability up to 92% (Fig. 5c-d). A pH value of 5.8 of the pre-polymer solution was the highest value we could obtain without causing chitosan precipitation. By mediating both pH values of the pre-polymer solution and TPP from 3.5 to 5.8 and from 9.5 to 7.4, respectively, cell viability was significantly improved (Fig. 5b-f).
3.4 Cell viability and morphology in cell-adhesive chitosan microtubes
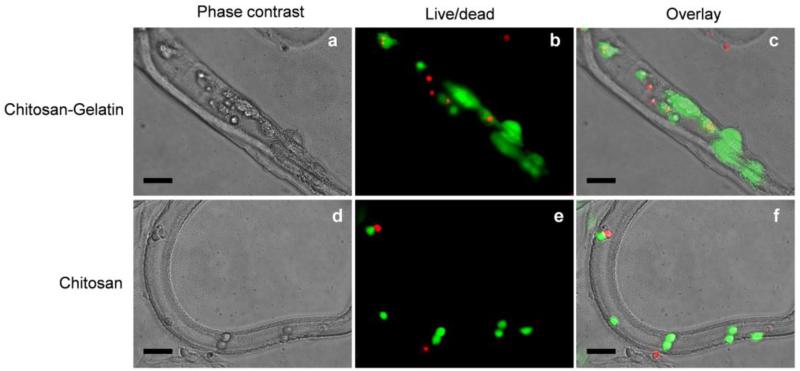
Cells within the microtubes were cultured for 3 days, and their viability was measured to evaluate the effect of chitosan and chitosan-gelatin microtubes (Fig. 6). Cells within chitosan microtubes were alive after 3 days but remained as single cells with round morphology. On the other hand, cells within chitosan microtubes presenting gelatin spread out on the inner wall over time. This result demonstrates that cell adhesion and proliferation could be enhanced by incorporating cell-responsive molecules to the chitosan microtubes.
Fig. 6.
Cells were cultured inside chitosan-gelatin microtubes (a-c) and chitosan microtubes (d-f) for 3 days. The cell viability and morphology were evaluated by live/dead assay. (scale bar: 100μm)
One of promising application of the fabricated microtubes is blood vessel tissue engineering. Small-diameter (< 5mm) vascular graft for bypass surgery has long been desired for cardiovascular tissue engineering (Nerem and Ensley 2004). Despite numerous scaffolds that have been developed through various tissue engineering techniques, the construction of an entirely biomimetic blood vessels is still underway (Nemeno-Guanzon et al. 2012). The microtubes with the capability of multiple cell culturing and inner/outer diameter control will be a major benefit of the scaffold for repopulating endothelial and smooth muscle cells to form tissue-engineered blood vessels.
Chitosan-gelatin scaffolds reported in (Huang et al. 2005; Thein-Han et al. 2009) provided the necessary support as artificial extracellular matrices allowing fibroblasts and human umbilical vein endothelial cells (HUVECs) to maintain cell viability for several weeks. However, because of the strong acidic condition of chitosan pre-polymer solution, it has been difficult to use chitosan for in situ fabrication of cell embedding scaffolds with specific shapes. In this paper, we focused on demonstrating that chitosan-gelatin with cells can be fabricated to microtube-like structures to serve as a template in guiding the development of tissue-engineered blood vessels.
4 Conclusions
Simple microfluidic device generating a coaxial flow of two solutions was developed to fabricate the chitosan microtubes. We demonstrated computationally and experimentally that microtube dimensions could be controlled by adjusting the flow rates and viscosities of two solutions. Furthermore, cells could be simultaneously attached on the inner wall of the microtubes during the fabrication step. Adjusting pH values of acidic chitosan solution and basic TPP solution promoted higher cell viability. The microtubes incorporating cell-adhesive proteins allowed viability and proliferation of the adhered cells. Overall, the microtube fabrication technique combined with pH control method can facilitate microfluidic fabrication of cell adhesive chitosan microtubes without additional neutralization process. We expect that the capability of co-culturing cells on the inner and outer wall of mictotubes will be highly advantageous for microengineered tissue engineering applications.
Supplementary Material
Acknowledgements
This research was funded by National Science Foundation CAREER Award (DMR 0847287), the Office of Naval Research Young National Investigator Award, National Institutes of Health (HL092836, EB008392, DE021468, AR057837, EB012597, HL099073, GM095906), and US Army Corps of Engineers. We thank the following funding sources for support: Natural Sciences and Engineering Research Council of Canada Postdoctoral Fellowship (K.K.) and Innovative Medical Tech Co. (J.O.). J.O., K.K., and S.W.W. contributed equally to this work. J.O., K.K., S.W.W., and A.K. designed the research strategy. J.O., K.K., and S.W.W. conducted the experiments and analyzed the data. C.C. prepared materials and performed cell experiment. A.G. measured mechanical properties of chitosan and chitosan-gelatin composite hydrogels. J.O., K.K., S.W.W., A.G., C.C., and A.K. wrote the manuscript with comments and editing by S.S., H.B., K.H.L., D.H.L., and S.-H.L..
References
- Anthonsen MW, Smidsrød O. Carbohydr. Polymers. 1995;26:303–305. [Google Scholar]
- Arca HC, Senel S. FABAD J. Pharm. Sci. 2008;33:35–49. [Google Scholar]
- Boucard N, Viton C, Agay D, Mari E, Roger T, Chancerelle Y, Domard A. Biomaterials. 2007;28:3478–3488. doi: 10.1016/j.biomaterials.2007.04.021. [DOI] [PubMed] [Google Scholar]
- Cortes-Morichetti M, Frati G, Schussler O, Duong Van Huyen JP, Lauret E, Genovese JA, Carpentier AF, Chachques JC. Tissue Eng. 2007;13:2681–2687. doi: 10.1089/ten.2006.0447. [DOI] [PubMed] [Google Scholar]
- Domb AJ, Kumar N, Ezra A. Biodegradable Polymers in Clinical Use and Clinical Development. John Wiley & Sons Inc.; Hoboken, New Jersey: 2011. [Google Scholar]
- Eser Elcin A, Elcin YM, Pappas GD. Neurol. Res. 1998;20:648–54. doi: 10.1080/01616412.1998.11740578. [DOI] [PubMed] [Google Scholar]
- Francis Suh JK, Matthew HWT. Biomaterials. 2000;21:2589–2598. doi: 10.1016/s0142-9612(00)00126-5. [DOI] [PubMed] [Google Scholar]
- Fukuda J, Khademhosseini A, Yeo Y, Yang X, Yeh J, Eng G, Blumling J, Wang C-F, Kohane DS, Langer R. Biomaterials. 2006;27:5259–5267. doi: 10.1016/j.biomaterials.2006.05.044. [DOI] [PubMed] [Google Scholar]
- Fuller K, Gallagher AC, Chambers TJ. Biochem. Biophys. Res. Commun. 1991;181:67–73. doi: 10.1016/s0006-291x(05)81382-8. [DOI] [PubMed] [Google Scholar]
- Hamilton V, Yuan Y, Rigney DA, Chesnutt BM, Puckett AD, Ong JL, Yang Y, Haggard WO, Elder SH, Bumgardner JD. Polym. Int. 2007;56:641–647. [Google Scholar]
- Huang Y, Onyeri S, Siewe M, Moshfeghian A, Madihally SV. Biomaterials. 2005;26:7616–7627. doi: 10.1016/j.biomaterials.2005.05.036. [DOI] [PubMed] [Google Scholar]
- Ji C, Annabi N, Khademhosseini A, Dehghani F. Acta Biomater. 2011;7:1653–1664. doi: 10.1016/j.actbio.2010.11.043. [DOI] [PubMed] [Google Scholar]
- Ji C, Khademhosseini A, Dehghani F. Biomaterials. 2011;32:9719–9729. doi: 10.1016/j.biomaterials.2011.09.003. [DOI] [PubMed] [Google Scholar]
- Jin H, Kim TH, Hwang S-K, Chang S-H, Kim HW, Anderson HK, Lee H-W, Lee K-H, Colburn NH, Yang H-S, Cho M-H, Cho CS. Mol. Cancer Ther. 2006;5:1041–1049. doi: 10.1158/1535-7163.MCT-05-0433. [DOI] [PubMed] [Google Scholar]
- Kang E, Jeong GS, Choi YY, Lee KH, Khademhosseini A, Lee S-H. Nat. Mater. 2011;10:877–883. doi: 10.1038/nmat3108. [DOI] [PubMed] [Google Scholar]
- Kang YM, Lee BN, Ko JH, Kim GH, Kang KN, Kim DY, Kim JH, Park YH, Chun HJ, Kim CH, Kim MS. Int. J. Mol. Sci. 2010;11:4140–4148. doi: 10.3390/ijms11104140. [DOI] [PMC free article] [PubMed] [Google Scholar]
- Khademhosseini A, Langer R, Borenstein J, Vacanti J. Proc. Nat. Acad. Sci. USA. 2006;103:2480–2487. doi: 10.1073/pnas.0507681102. [DOI] [PMC free article] [PubMed] [Google Scholar]
- Khademhosseini A, Langer R. Biomaterials. 2007;28:5087–5092. doi: 10.1016/j.biomaterials.2007.07.021. [DOI] [PubMed] [Google Scholar]
- Kim SE, Cho YW, Kang EJ, Kwon IC, Lee EB, Kim JH, Chung H, Jeong SY. Fibers Polym. 2001;2:64–70. [Google Scholar]
- Lee JE, Kim KE, Kwon IC, Ahn HJ, Lee S-H, Cho H, Kim HJ, Seong SC, Lee MC. Biomaterials. 2004;25:4163–4173. doi: 10.1016/j.biomaterials.2003.10.057. [DOI] [PubMed] [Google Scholar]
- Lee KH, Shin SJ, Kim C-B, Kim JK, Cho YW, Chung BG, Lee S-H. Lab Chip. 2010;10:1328–1333. doi: 10.1039/b924987g. [DOI] [PubMed] [Google Scholar]
- Takei T, Kishihara N, Sakai S, Kawakami K. Biochem. Eng. J. 2010;49:143–147. [Google Scholar]
- Lee BR, Lee KH, Kang E, Kim DS, Lee SH. Biomicrofluidics. 2011;5:9. doi: 10.1063/1.3576903. [DOI] [PMC free article] [PubMed] [Google Scholar]
- Lenlein A, Sisson A. Handbook of Biodegradable Polymers. Wiley-VCH; Weinheim, Germany: 2011. [Google Scholar]
- Ligler FS, Lingerfelt BM, Price RP, Schoen PE. Langmuir. 2001;17:5082–5084. [Google Scholar]
- Malafaya PB, Silva GA, Reis RL. Adv. Drug Deliv. Rev. 2007;59:207–233. doi: 10.1016/j.addr.2007.03.012. [DOI] [PubMed] [Google Scholar]
- Mano JF, Silva GA, Azevedo HS, Malafaya PB, Sousa RA, Silva SS, Boesel LF, Oliveira JM, Santos TC, Marques AP, Neves NM, Reis RL, Soc JR. Interface. 2007;4:999–1030. doi: 10.1098/rsif.2007.0220. [DOI] [PMC free article] [PubMed] [Google Scholar]
- Mercier NR, Costantino HR, Tracy MA, Bonassar LJ. Biomaterials. 2005;26:1945–1952. doi: 10.1016/j.biomaterials.2004.06.030. [DOI] [PubMed] [Google Scholar]
- Miyabe K, Isogai R. J. Chromatogr. 2011;A 1218:6639–6645. doi: 10.1016/j.chroma.2011.07.018. [DOI] [PubMed] [Google Scholar]
- Natesan S, Baer DG, Walters TJ, Babu M, Christy RJ. Tissue Eng. 2010;A 16:1369–1384. doi: 10.1089/ten.tea.2009.0404. [DOI] [PMC free article] [PubMed] [Google Scholar]
- Nichol JW, Koshy ST, Bae H, Hwang CM, Yamanlar S, Khademhosseini A. Biomaterials. 2010;31:5536–5544. doi: 10.1016/j.biomaterials.2010.03.064. [DOI] [PMC free article] [PubMed] [Google Scholar]
- Nicodemus GD, Bryant SJ. Tissue Eng. B, Rev. 2008;14:149–165. doi: 10.1089/ten.teb.2007.0332. [DOI] [PMC free article] [PubMed] [Google Scholar]
- Pati F, Adhikari B, Dhara S. J. Appl. Polym. Sci. 2011;121:1550–1557. [Google Scholar]
- Peniche C, Argüelles-Monal, H. Peniche W, Acosta N. Macromol. Biosci. 2003;3:511–520. [Google Scholar]
- Richardson SM, Hughes N, Hunt JA, Freemont AJ, Hoyland JA. Biomaterials. 2008;29:85–93. doi: 10.1016/j.biomaterials.2007.09.018. [DOI] [PubMed] [Google Scholar]
- Rivas-Araiza R, Alcouffe P, Rochas C, Montembault A, David L. Langmuir. 2010;26:17495–17504. doi: 10.1021/la102907u. [DOI] [PubMed] [Google Scholar]
- Senel S, McClure SJ. Adv. Drug Deliv. Rev. 2004;56:1467–1480. doi: 10.1016/j.addr.2004.02.007. [DOI] [PubMed] [Google Scholar]
- Shi C, Zhu Y, Ran X, Wang M, Su Y, Cheng T. J. Surg. Res. 2006;133:185–192. doi: 10.1016/j.jss.2005.12.013. [DOI] [PubMed] [Google Scholar]
- Sinha VR, Singla AK, Wadhawan S, Kaushik R, Kumria R, Bansal K, Dhawan S. Int. J. Pharm. 2004;274:1–33. doi: 10.1016/j.ijpharm.2003.12.026. [DOI] [PubMed] [Google Scholar]
- Sionkowska A, Wisniewski M, Skopinska J, Poggi GF, Marsano E, Maxwell CA, Wess TJ. Polym. Degrad. Stab. 2006;91:3026–3032. [Google Scholar]
- Tan WH, Takeuchi S. Adv. Mater. 2007;19:2696–2701. [Google Scholar]
- Thein-Han WW, Saikhun J, Pholpramoo C, Misra RDK, Kitiyanant Y. Acta Biomater. 2009;5:3453–3466. doi: 10.1016/j.actbio.2009.05.012. [DOI] [PubMed] [Google Scholar]
- Tsaih ML, Chen RH. J. Appl. Polym. Sci. 1999;73:2041–2050. [Google Scholar]
- Williams CG, Malik AN, Kim TK, Manson PN, Elisseeff JH. Biomaterials. 2005;26:1211–1218. doi: 10.1016/j.biomaterials.2004.04.024. [DOI] [PubMed] [Google Scholar]
- Yeh C-H, Lin P-W, Lin Y-C. Microfluid. Nanofluid. 2010;8:115–121. [Google Scholar]
- Yeh C-H, Lin P-W, Zhao Q, Chou T-C, Lin Y-C. Proc. 4th IEEE International Conference on Nano/Micro Engineered and Molecular Systems; Shenzhen, China. 2009.pp. 904–906. [Google Scholar]
- Zhang L, Ao Q, Wang A, Lu G, Kong L, Gong Y, Zhao N, Zhang X. J. Biomed. Mater. Res. A. 2006;77A:277–284. doi: 10.1002/jbm.a.30614. [DOI] [PubMed] [Google Scholar]
- Zhang Y, Zhang M. J. Mater. Sci.- Mater. Med. 2004;15:255–260. doi: 10.1023/b:jmsm.0000015485.94665.25. [DOI] [PubMed] [Google Scholar]
- Nerem RM, Ensley AE. Am. J. Transplant. 2004;4:36–42. doi: 10.1111/j.1600-6135.2004.0343.x. [DOI] [PubMed] [Google Scholar]
- Nemeno-Guanzon JG, Lee S, Berg JR, Jo YH, Yeo JE, Nam BM, Koh Y-G, Lee JI. J. Biomed. Biotechnol. 2012;2012:1–14. doi: 10.1155/2012/956345. [DOI] [PMC free article] [PubMed] [Google Scholar]
Associated Data
This section collects any data citations, data availability statements, or supplementary materials included in this article.


