

Summary
Purpose
Dysfunction of the blood–brain barrier (BBB) is a common finding during seizures or following epileptogenic brain injuries, and experimentally induced BBB opening promotes seizures both in naive and epileptic animals. Brain albumin extravasation was reported to promote hyperexcitability by inducing astrocytes dysfunction. To provide in vivo evidence for a direct role of extravasated serum albumin in seizures independently on the pathologic context, we did the following: (1) quantified the amount of serum albumin extravasated in the rat brain parenchyma during status epilepticus (SE); (2) reproduced a similar concentration in the hippocampus by intracerebroventricular (i.c.v.) albumin injection in naive rats; (3) measured electroencephalography (EEG) activity in these rats, their susceptibility to kainic acid (KA)–induced seizures, and their hippocampal afterdischarge threshold (ADT).
Methods
Brain albumin concentration was measured in the rat hippocampus and other forebrain regions 2 and 24 h after SE by western blot analysis. Brain distribution of serum albumin or fluorescein isothiocyanate (FITC)-albumin was studied by immunohistochemistry and immunofluorescence, respectively. Naive rats were injected with rat albumin or FITC-albumin, i.c.v., to mimic the brain concentration attained after SE, or with dextran used as control. Inflammation was evaluated by immunohistochemistry by measuring glial induction of interleukin (IL)-1β. Western blot analysis was used to measure inward rectifying potassium channel subunit Kir4.1 protein levels in the hippocampus. Seizures were induced in rats by intrahippocampal injection of 80 ng KA and quantified by EEG analysis, 2 or 24 h after rat albumin or dextran administration. ADT was measured by electrical stimulation of the hippocampus 3 months after albumin injection. In these rats, EEG was continuously monitored for 2 weeks to search for spontaneous seizures.
Key Findings
The hippocampal serum albumin concentration 24 h post-SE was 0.76 ± 0.21 μm. Similar concentrations were measured in other forebrain regions, whereas no changes were found in cerebellum. The hippocampal albumin concentration was similarly reproduced in naive rats by i.c.v. administration of 500 μg/4 μl rat albumin: albumin was predominantly detected extracellularly 2 h after injection, whereas at 24 h it was visible inside pyramidal neurons and in only a few scattered chondroitin sulphate proteoglycan (NG2)-positive cells, but not in glial fibrillary acidic protein (GFAP)-positive astrocytes or CR-3 complement receptor (OX-42)-positive microglia. The presence of albumin in naive rat hippocampus was associated with induced IL-1β in GFAP-positive astrocytes and a concomitant tissue down-regulation of Kir4.1. Spiking activity was evoked by albumin in the hippocampus lasting for 2 h. When KA was intrahippocampally applied either 2 or 24 h after albumin injection, the number of total interictal spikes in 3 h EEG recording was significantly increased by twofold on average. Three months after albumin injection, neither albumin nor inflammation was detected in brain tissue; at this time, the ADT was reduced by 50% but no spontaneous seizures were observed.
Significance
Transient hippocampal exposure to albumin levels similar to those attained after prominent BBB breakdown resulted in increased seizure susceptibility and long-term reduction in seizure threshold, but it did not evoke spontaneous seizures. These effects may be mediated by albumin-induced astrocytes dysfunction and the associated induction of proinflammatory molecules.
Keywords: Afterdischarge, Astrocytes, Blood–brain barrier, Inflammation, Neurodegeneration, Seizures
The blood–brain barrier (BBB) provides a crucial protection of the brain by regulating the entry of blood-circulating molecules and immune cells into the nervous tissue (Abbott et al., 2010). Various central nervous system (CNS) injuries cause transient changes in the physiologic and structural properties of the BBB (reviewed in Zlokovic, 2008; Shlosberg et al., 2010; Nag et al., 2011). In particular, impairment of BBB integrity associated with an inflammatory state are common features of brain insults, which can lead to the development of epilepsy, and are hallmarks of drug-resistant epileptic tissue (Proescholdt et al., 1999; Abbott, 2000; Bartfai et al., 2007; Vezzani & Friedman, 2012). Experimental evidence indicates a significant role of BBB breakdown, and the concomitant brain inflammation, in determining neuronal network hyperexcitability, eventually resulting in seizures (Friedman et al., 2009; Vezzani & Friedman, 2012; Vezzani et al., 2012). One pivotal mechanism involved in these effects relates to the extravasation of serum albumin into the brain neuropil, and the consequent down-regulation of the inward rectifying K+current in astrocytes through activation of the transforming growth factor beta (TGF-β) receptor (RII) signaling. This phenomenon results in the failure of astrocytes to buffer extracellular K+ (Ivens et al., 2007; Cacheaux et al., 2009; David et al., 2009). Because BBB damage in epilepsy occurs in association with many additional pathologic processes (Pitkanen & Lukasiuk, 2011), it is difficult to isolate the role of the extravasated albumin per se in the initiation of epileptogenesis. To address this issue, it is necessary to study the effects of pathologic-relevant concentrations of albumin on brain excitability in isolation from the disease context. Previous work focused on the effects induced by mimicking large extravasation of albumin, as it may occur following traumatic brain injury (Shlosberg et al., 2010). In this regard, a prolonged exposure of naive rat cortex to albumin concentrations approaching serum levels eventually resulted in the induction of epileptiform activity (Ivens et al., 2007). In our study, we evaluated the effects of albumin on rat brain excitability using a concentration of albumin mimicking that attained in brain tissue after status epilepticus (SE), an experimental condition that provokes prominent BBB breakdown (van Vliet et al., 2007) and can evolve to chronic epilepsy in animals and humans (Pitkanen & Sutula, 2002). Our data show that after a single intracerebroventricular injection in nave rats, albumin diffuses mainly in the hippocampus and is transported into principal neurons. In this brain region, the parenchymal extravasation of albumin at a relevant pathologic concentration provokes the following: (1) down-regulation of Kir4.1 channels and brain inflammation in glial fibrillary acidic protein (GFAP)-positive astrocytes; (2) transient neuronal hyperexcitability expressed as spontaneous epileptiform spikes, and enhanced kainic acid (KA)–induced epileptiform activity; and (3) long-lasting decrease in seizure threshold without causing cell loss or spontaneous epileptic activity.
Methods
Experimental animals
Adult male Sprague-Dawley rats (225–250 g; Charles-River, Calco, Italy) were housed at constant temperature (23 °C) and relative humidity (60 ± 5%) with free access to food and water and a fixed 12 h light/dark cycle. Procedures involving animals and their care were conducted in conformity with the institutions guidelines that are in compliance with national (D.L.n.116, G.U., Suppl. 40, February 18, 1992) and international laws and policies (EEC Council Directive 86/609, OJ L 358, 1, December 12, 1987; Guide for the Care and Use of Laboratory Animals, U.S. National Research Council, 1996).
Experimental groups
In this study, we used a total number of 130 rats divided into different experimental groups, as reported in detail below.
To evaluate the concentration and distribution of endogenous serum albumin extravasation in rat brain after the induction of SE, we used 15 rats developing SE after pilocarpine injection and 11 vehicle-injected rats as controls. To evaluate the brain concentration of injected rat albumin and the level of Kir4.1 protein by Western blot, we used 20 albumin-injected rats and 12 dextran-injected controls. To assess fluorescein isothiocyanate (FITC)-albumin tissue distribution, we used 10 FITC-albumin-injected rats. To visualize glia, detect interleukin (IL)-1β, and measure neuronal cell density by immunohistochemistry, we used eight albumin-injected rats and six dextran-injected controls. To study the effect of albumin on brain excitability by electroencephalography (EEG) recording, rats were injected with rat albumin (n = 16) or dextran (n = 16); then 2 h (n = 8 each group) or 24 h (n = 8 each group) later the same rats received intrahippocampal KA. A different group of rats was injected with rat albumin (n = 9) or dextran (n = 7); then 3 months later these rats were tested for their threshold to electrically induced after discharge.
Induction of status epilepticus
Rats were injected intraperitoneally (i.p.) with pilocarpine hydrochloride (360 mg/kg in buffered saline, Sigma-Aldrich, Milano, Italy) 30 min after methyl scopolamine (0.5 mg/kg. i.p.; Sigma-Aldrich) injection used to counteract peripheral cholinergic side effects (Turski et al., 1983). Rats were monitored for behavioral seizures by two investigators. About 40 min after pilocarpine injection, approximately 80% of injected rats developed SE consisting of recurrent generalized motor seizures; 90 min after onset of SE, rats were injected with phenobarbital (20 mg/kg in buffered saline, i.p.; Sigma-Aldrich) to stop convulsive SE and reduce the mortality. Only rats developing SE for at least 90 min were used for subsequent analysis. SE-exposed rats were randomly divided in two groups: one group was used for quantification of endogenous albumin concentrations in rat forebrain regions by western blot (n = 7); the other group was used for analysis of endogenous albumin brain distribution by immunostaining, 2 and 24 h after SE (n = 4 rats each group). Saline-injected rats were used as controls (n = 4–7).
Albumin levels were measured within the first 24 h from SE, since maximal BBB opening occurs within this time window as previously reported (van Vliet et al., 2007).
Recombinant rat albumin injection
Rats were deeply anesthetized with Equithesin (1% pentobarbital + 4% chloral hydrate; 3.5 ml/kg, i.p.) and placed into a stereotaxic Kopf apparatus (David Kopf Instruments, Tujunga, CA, U.S.A.). For intracerebroventricular (i.c.v.) injections, either rat albumin (Sigma-Aldrich), or bovine FITC-(Aldrich), or dextran (Sigma-Aldrich) (500 μg/4 μl in 50 mm phosphate buffered saline, PBS) were administered using a 30-gauge needle protruding 4.0 mm below dura surface into the third lateral ventricle of the left hemisphere (from bregma, mm: AP −0.8; L +1.5 according to Paxinos & Watson, 1986). This dose of albumin was calculated on the basis of previous protein delivery experiments, showing that a desired neuropil concentration of a given protein can be attained by injecting this protein i.c.v. at an approximately 200-times higher concentration (not shown). This takes into account an approximately 100-times dilution of the injected volume (4 μl) in the rat ventricular cerebrospinal fluid (CSF). Therefore, we injected i.c.v. 1.9 mm albumin (500 μg/4 μl) to obtain approximately 1 μm in brain tissue (this concentration was attained by endogenous serum albumin extravasating into the brain 24 h after SE, see Results). Rats were killed 2 or 24 h after injection to measure albumin brain levels and distribution.
Different groups of rats were similarly treated but also preimplanted with injection cannulae and EEG electrodes for subsequent analysis of brain activity and seizure susceptibility after treatments (see below).
Electrodes and cannula implantation
EEG recordings were done either in rat albumin- or dextran-injected rats. Briefly, two bipolar Teflon-insulated depth electrodes (Ø 0.127 mm, dorsoventral tip separation 0.5 mm) were implanted bilaterally into the septal pole of the hippocampus (from bregma, mm: anteroposterior [AP] −3.3; L ±2.4; −3.0 below dura, Paxinos & Watson, 1986). Two screw electrodes (PlasticOne Inc., Roanoke, VA, U.S.A.) were positioned over the nasal sinus and the cerebellum to serve as ground and reference electrodes, respectively. A 22-gauge guide cannula was implanted alongside the left depth electrode for the intrahippocampal infusion of kainic acid (see below). An additional cannula was positioned on the dura, ipsilateral to the hippocampal cannula, for i.c.v. injection of rat albumin or dextran. Electrodes were connected to a multipin socket and secured to the skull by acrylic dental cement. Rats were allowed 7 days to recover from surgery before the beginning of recordings.
Seizure susceptibility
Kainic acid (KA, 80 ng/0.5 μl; Tocris Bioscience, Bristol, U.K.) was dissolved in 50 mm PBS (pH 7.4) and injected unilaterally in freely moving rats in the dentate gyrus of the septal hippocampus, using a 30-gauge needle protruding 3.0 mm from the bottom of the guide cannula. This dose of KA was previously reported to be the lowest dose inducing discrete recurring EEG ictal episodes and spiking activity in the hippocampus lasting for about 2.5 h in 100% of rats without mortality (Vezzani et al., 1999). In each rat, a baseline EEG activity was recorded for at least 30 min, then rat albumin or dextran was injected (see above), and EEG activity was continuously recorded for additional 120 min. Rats injected with either dextran or albumin were then randomly divided in two groups and injected with KA either 2 or 24 h after albumin or dextran injection. EEG was recorded for 60 min before and for 180 min after KA injection. Three days after KA, all rats were killed for neuronal cell loss quantification as reported below.
Afterdischarge threshold
A separate group of rats was implanted with EEG electrodes in the hippocampus as described above, 3 months after i.c.v. albumin or dextran injection. Starting 1 week after surgery, rats were continuously monitored (24 h/day, 7 day/week) for 2 weeks to search for spontaneous epileptiform activity, as defined by the appearance of EEG spiking activity or frank ictal events (Noe’ et al., 2008; Ravizza et al., 2008). At the end of the recording period, rats were tested for their hippocampal threshold to electrically induced afterdischarge (ADT). Rats were electrically stimulated and EEG recorded in the left septal hippocampus, using constant current stimulus (1 msec monopolar square waves, 50 Hz for 2 s). Determination of the ADT was done using an ascending stepwise procedure (Freeman & Jarvis, 1981). The initial current intensity was set at 20 μA; then the current was increased by 10 μA up to a maximal value of 200 μA by intervals of 1 min until one AD of at least 3 s duration was elicited. The lack of AD induction in rats exposed to 200 μA current intensity was predictive of electrode misplacement. Twenty-four hours after AD induction, rats were killed for immunohistochemical analysis of brain albumin, activation of glia and loss of neurons (see below).
EEG recording and analysis
EEG was recorded in freely moving rats within their own home cage, as previously described (Noe’ et al., 2010) using the TWin EEG Recording System connected with a Comet AS-40 32/8 Amplifier (sampling rate 400 Hz, high-pass filter 0.3 Hz, low-pass filter 70 Hz, sensitivity 2,000 mV/cm; Grass-Telefactor, West Warwick, R.I., U.S.A.). Digitized EEG data were processed using the TWin record, and review software. Effects of albumin injection on basal and KA-induced hippocampal EEG activity were assessed by counting the total number of spikes during the first 2 h after albumin injection and during the 3 h post-KA administration using Clampfit 9.0 program (Axon Instruments, Union City, CA, U.S.A.). Spikes were defined as sharp waves with an amplitude at least 2.5-fold higher than the baseline and a duration of <20 msec, or as a spike-and-wave with a duration of <200 msec. Ictal episodes were defined by the occurrence of discrete episodes of high-frequency and high-voltage synchronous spike activity and/or multispike complexes (Fig. 4B,E). Seizure activity was quantified by summing up the duration of each ictal event during the EEG recording time. EEG were visually inspected and ictal episodes or spike activity were reckoned by two independent investigators.
Figure 4.

Effects of rat albumin on baseline and KA-induced EEG activity in the hippocampus. Representative hippocampal EEG tracings in freely moving rats injected i.c.v. with dextran (CTR, A–C) or rat albumin (500 μg/4 μl) (D–F), either alone (A and D, respectively) or 24 h after KA (80 ng, intrahippocampally) (B, C and E, F, respectively). Panel A depicts EEG activity after dextran injection, which did not differ from preinjection baseline. Panel D depicts high-amplitude, high-frequency spiking activity (approximately 8 Hz) ipsilateral to albumin injection. This activity occurs within 15 min from injection, lasts for 60 min on average, and reverts to baseline within 2 h (see Fig. 5). Panels B and E depict a representative ictal episode recorded after KA injection in rats preinjected with dextran (B) or albumin (E). Panels C and F depict spiking activity during the third hour of recording after KA in rats preinjected with dextran (C) or albumin (F). Tracing enlargements are reported in brackets.
Epilepsia © ILAE
Methods in Data S1: Western blot, tissue preparation for immunohistochemistry, immunohistochemical procedures and quantification of IL-1β positive cells and neuronal cell loss, and statistical analysis of data.
Results
Quantification of brain extravasated serum albumin during status epilepticus
Our first goal was to determine the brain concentration of extravasated serum albumin during SE. Therefore, we measured serum albumin levels in different regions of the rat brain 24 h after pilocarpine-induced SE, by semiquantitative western blot analysis. Albumin concentration in the hippocampal formation was 0.76 ± 0.21 μm (n = 7, Fig. 1A). A similar albumin concentration was measured in the entorhinal cortex (0.79 ± 0.13 μm) and thalamic complex (0.68 ± 0.07 μm); increased levels were also found in the amygdala (0.48 ± 0.12 μm), whereas no changes occurred in the cerebellum (Table S1, see also van Vliet et al., 2007).
Figure 1.
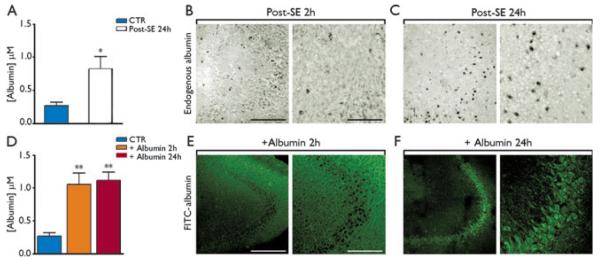
Hippocampal levels and tissue distribution of rat serum albumin after induction of status epilepticus (SE) (A–C), and comparison with rat albumin injection in naive rats (D–F). Panel A depicts the levels of rat serum albumin attained in the hippocampus 24 h after SE induction in rats (n = 7 each group). Panels B and C are representative pictures of the CA3 area at low- and high-magnification depicting rat serum albumin distribution in the brain parenchyma. Albumin signal was predominantly extracellular 2 h after SE (B), whereas at 24 h albumin staining was observed in CA3 pyramidal neurons (C). Panel D shows albumin concentrations attained in the rat hippocampus 2 and 24 h after i.c.v. injection of 500 μg/4 μl rat albumin (n = 4 rats each exp group). Panels E, F depict the hippocampal distribution of FITC-albumin (500 μg/4 μl, i.c.v.) denoting its extracellular accumulation 2 h after the injection and its intraneuronal signal in CA3 pyramidal neurons 24 h after the injection. Data in bar grams are mean ± standard error. *p < 0.05; **p < 0.01 versus CTR (vehicle-injected rats in panel A or dextran-injected rats in panel D) by Mann-Whitney U test for two independent groups (A) or by Kruskal-Wallis one-way analysis of variance followed by Dunn’s multiple comparison test (D). Scale bar 100 μm (low magnification), 25 μm (high magnification).
Epilepsia © ILAE
Immunohistochemical analysis of hippocampal distribution of rat albumin was done in a different group of rats similarly treated with pilocarpine and killed 2 or 24 h after SE; at 2 h, post-SE endogenous albumin was predominantly observed extracellularly (Fig. 1B); however, at 24 h prominent albumin staining was detected within pyramidal CA3 neurons (Fig. 1C), and in scattered CA1 neurons and granule cells (not shown). Albumin was detected in neurons 24 h after SE also in the entorhinal cortex, thalamic complex, and amygdala (not shown).
Quantification of brain albumin after intracerebroventricular injection
To mimic the endogenous albumin brain levels attained after SE, we administered a bolus of rat albumin i.c.v., and we killed the rats after 2 and 24 h. We found that an albumin dose of 500 μg/4 μl yielded hippocampal levels of 1.06 ± 0.16 μm (n = 4) and 1.08 ± 0.10 μm (n = 4) at 2 and 24 h after injection, respectively (Fig. 1D), levels which were similar to those attained after SE (Fig. 1A). Twenty-four hours after i.c.v. injection, we measured 0.46 ± 0.07 μm (n = 4, p < 0.05 vs. dextran controls) albumin in the entorhinal cortex, thus demonstrating increased levels in extrahippocampal regions, although this concentration was significantly lower (p < 0.05) than that attained after SE (0.79 ± 0.13 μm, Table S1). In addition, we injected the readily detectable FITC-albumin (500 μg/4 μl) to study its tissue distribution after i.c.v. injection. Similarly to endogenous albumin extravasated in the hippocampus during SE, FITC-albumin was predominantly extracellular at 2 h (Fig. 1E) versus 24 h (inside CA3 pyramidal neurons, Fig. 1F, colocalization image in Fig. S1C). Scattered albumin-positive CA1 and granule cells could also be observed (not shown) as well as few chondroitin sulphate proteoglycan (NG2)-positive cells (Fig. S1F). We did not detect albumin either in GFAP-positive astrocytes (Fig. S1G–I) or in OX-42–positive microglia (Fig. S1J–L).
Albumin-mediated inflammation in the hippocampus
We evaluated GFAP-positive glial cells and IL-1β staining in the hippocampus after rat albumin injection (Fig. 2). Panels A, E, and I schematically depict the time-dependent distribution of IL-1β–positive cells in hippocampal areas 2 h (E) or 24 h (I) after rat albumin injection as compared to dextran-injected rats (A). Although dextran-injected rats showed virtual lack of IL-1β staining in the hippocampus (Fig. 2B,C), IL-1β immunoreactivity was prominently increased in the molecular layer after albumin (Fig. 2F,J,K) in GFAP-positive astrocytes (H,L, merged image in O). GFAP staining denoted morphologic features of astrocyte activation after albumin injection (Fig. 2H,L) as compared to dextran-injected rats (D). IL-1β immunopositive cells were significantly more numerous at 24 h (J,K) than at 2 h (F,G) after albumin injection, as demonstrated by cell number counting (bar gram in N) in representative hippocampal areas (framed in red boxes, M). We did not detect morphologic changes in OX-42–positive microglia after albumin (Fig. S2B,C) versus dextran (panel A) injection. Moreover, no induction of IL-1β was observed in microglia (data not shown) or in NG2-positive cells (Fig. S3A–C) after albumin.
Figure 2.

Astrocytes activation and IL-1β induction after rat albumin injection in naive rats. Panels A, E, I (first column) depict a schematic representation of the area of distribution of IL-1β positive cells in the hippocampus proper after albumin injection (E, I) as compared to dextran-injected rats (A). Panels B, C depict IL-1β staining in the hippocampus of dextran-injected rats (CTR) denoting virtual lack (C) or barely detectable (B) signal. Panels F, J depict the increase of IL-1β in cells with glia morphology in stratum moleculare (sm) of the hippocampus 2 h (F) and 24 h (J) after rat albumin injection (500 μg/4 μl, i.c.v., coordinates of injection are reported in Methods section). Increases were also observed in stratum radiatum (sr, K) and lucidum (sl, not shown, see panel I) 24 h, but not 2 h (G, E) after albumin. Panel D shows a high magnification picture of resting state GFAP-astrocytes in dextran-injected hippocampus. Panels H and L depict GFAP-positive astrocytes with morphologic features of activation 2 and 24 h postinjection, respectively. Panel O depicts colocalization of IL-1β with GFAP in the stratum moleculare of hippocampus of albumin-injected rats. Scale bar 50 μm (B, C, F, G, J, K), 25 μm (O), 10 μm (D, H, L). Panel N depicts the total number of IL-1β positive cells (mean ± standard error, n = 4–6 rats each group) counted after albumin versus dextran (CTR) injection in the areas depicted by red boxes in panel M. p < 0.05 versus CTR by Kruskal-Wallis one-way analysis of variance followed by Dunn’s multiple comparison test. Ipsi and contra refer to the hippocampus ipsilateral or contralateral, respectively, to the injected ventricle.
Epilepsia © ILAE
Effect of albumin injection on Kir4.1 protein levels
Because astrocytes exposed to albumin in vivo and in vitro show a marked reduction of Kir4.1 mRNA via activation of TGF-βRII signaling (Perillan et al., 2002; Ivens et al., 2007; David et al., 2009), we evaluated the hippocampal levels of Kir4.1 protein after rat albumin injection as a functional readout of astrocytes dysfunction (Fig. 3). We found a 28.5 ± 12.7% and 33.6 ± 9.4% (p < 0.05) reduction in Kir4.1 levels compared to control animals (n = 6 each group) at 2 and 24 h, respectively.
Figure 3.
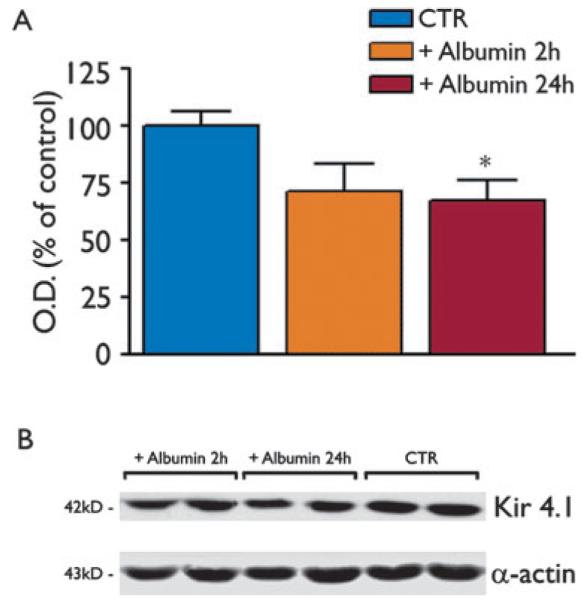
Western blot analysis of Kir4.1 channel protein in the rat hippocampus after rat albumin injection. Bar grams show densitometry analysis of the Kir4.1 band in the various experimental groups, that is, 2 or 24 h after i.c.v. injection (500 μg/4 μl, i.c.v.) of rat albumin, or after dextran-injection (CTR, similar bands were detected 2 and 24 h after injection; therefore, these values were pooled together). In our denaturing and reducing buffer conditions, we measured the monomeric protein corresponding to the 42 kDa band (B). No additional bands were detected at lower molecular weight reflecting lack of protein degradation (not shown). Data (mean ± standard error, n = 6) are optical density (O.D.) values of the relevant bands, divided by the corresponding α-actin value (internal standard) in (B). *p < 0.05 versus CTR by Kruskal-Wallis one-way analysis of variance followed by Dunn’s multiple comparison test.
Epilepsia © ILAE
Effect of albumin injection on brain excitability
EEG analysis of rats injected i.c.v. with rat albumin showed the development of high-amplitude, high frequency spiking activity (approximately 8 Hz) occurring within 15 min from injection, lasting for 60 min on average, and reverting to baseline level of activity within 2 h (Fig. 4D vs. A; Fig. 5A red line, n = 16). Spikes occurred in the 2 h following albumin administration (total number of 9.351 ± 1.059 spikes, Fig. 5C). One ictal episode was detected in 1 of 16 rats, 30 min after the injection of albumin. Dextran-treated rats (CTR) showed EEG activity similar to that of preinjection baseline (Fig. 5A, blue line). Albumin- and dextran-treated rats were divided randomly into two groups; then 2 or 24 h later they were injected intrahippocampally with KA to assess their seizure susceptibility. In the 2 h group, the time of onset of epileptic activity and the number of seizures in albumin + KA treated rats did not differ from dextran + KA injected rats (not shown; n = 8). However, a significant increase in the total number of interictal spikes was observed in albumin + KA versus dextran + KA treated rats (CTR + KA) during the 3 h of EEG recording after KA (albumin + KA, 42.495 ± 8.076; dextran + KA, 22.894 ± 4.475 spikes, p < 0.05, Fig. 5D). This effect was reversible during the last 15 min epoch of recording (Fig. 5B, red dotted line). In the 24 h group, three of eight rats treated with KA developed several episodes of uninterrupted prolonged seizures intermixed with spiking activity (Fig. S4), which never occurred in saline + KA (Vezzani et al., 1999; Noe’ et al., 2010) or dextran + KA rats. Twenty-four hour after albumin injection, the number of spikes induced by KA was significantly increased (albumin + KA, 57.116 ± 9.689, n = 8, p < 0.05; Fig. 5D) as compared to dextran-injected rats (see above). Differently from the 2 h group, spiking activity was still significantly increased at the end of the recording period (i.e., 180 min after KA; Fig. 5B, red solid line) and was characterized by continuous polyspikes and waves (Fig. 4F). Epileptic activity induced by KA in dextran-treated rats did not differ from saline + KA treated rats (not shown).
Figure 5.

Changes in hippocampal excitability and seizure susceptibility after rat albumin injection. (A and C) show respectively the time-dependent changes in EEG activity and its quantification in the rat hippocampus after i.c.v. injection (500 μg/4 μl) of albumin (red, n = 16) or dextran (CTR, blue, n = 16). (B and D) show the time-dependent changes of epileptiform spike activity evoked by KA in rats pretreated either 2 h (dotted red line, n = 8) or 24 h (solid red line, n = 8) before with rat albumin. Blue line in panel B depicts epileptiform spike activity evoked by KA in rats pretreated with dextran 2 h (n = 8) or 24 h (n = 8) before KA (CTR + KA). Because these two groups of CTR + KA rats did not differ, they were pooled together (n = 16, blue line in B and blue bar in D). Arrow in panel A indicates the time of albumin or dextran injection; arrow in panel B indicates the time of KA injection; baseline refers to 15 min EEG activity before albumin injection. Panel A: *p < 0.05; **p < 0.01 albumin (red line) versus CTR (blue line). Panels B, D: °p < 0.05 albumin (red dotted line or striped bar) versus CTR (blue solid line or bar), #p < 0.01 albumin (red solid line or bar) versus CTR (blue solid line or bar); §p < 0.05 (red solid line vs. red dotted line) at 180 min. The cumulative number of spikes evoked by albumin itself (C, red bar) was significantly lower than the number of spikes measured during the first 2 h in CTR + KA (p < 0.05, Mann-Whitney U test). Data in panels A, B were analyzed by two-way ANOVA followed by Bonferroni test. Data in panel D were analyzed by Kruskal-Wallis one-way analysis of variance followed by Dunn’s multiple comparison test.
Epilepsia © ILAE
Neurodegeneration after kainic acid and albumin injection
The extent of neurodegeneration in dextran + KA or albumin + KA treated rats was assessed 3 days after KA injection in Nissl-stained hippocampal slices (Fig. S5). In rats injected with dextran + KA, we observed the typical neurodegeneration restricted to CA3 pyramidal neurons in the injected hippocampus (not shown, see Vezzani et al., 1999). Densitometric analysis of neuronal cell in this region (Fig. S5A) showed a 26.2 ± 5.0% reduction of neurons in rats injected with KA either 2 or 24 h after dextran (CTR + KA, n = 4 each group; p < 0.05) versus vehicle-injected rats (Naive). Cell density was reduced by 41.6 ± 6.9% and 60.7 ± 4.0% in rats injected with KA 2 or 24 h after albumin, respectively (n = 5 each group; p < 0.01 vs. Naive). Neuronal cell loss was more prominent in rats injected with KA 24 h after albumin as compared to dextran-injected rats (CTR + KA, p < 0.01).
Albumin injection per se did not cause any detectable neuronal cell loss, as assessed by FJ-A signal, which was negative in albumin-treated as in dextran-treated rats (not shown) and by quantitative Nissl staining analysis 2 or 24 h after albumin injection (Fig. S5B).
Effects of albumin injection on afterdischarge threshold
One group of rats was injected with rat albumin (n = 9) or dextran (n = 7) to study long-term effects on hippocampal excitability, as assessed by measuring local ADT to hippocampal electrical stimulation. Three months after rat albumin or dextran injection, no spontaneous epileptiform activity was detected during continuous EEG hippocampal recordings for 2 weeks. At the end of these recordings, the same rats were tested for ATD. One dextran- and two albumin-injected rats did not develop AD up to 200 μA; these rats were excluded by the study since post hoc histologic evaluation showed electrode misplacement (either too lateral or to deep). Rats injected with albumin showed a significant decrease of ADT (mean, 22.9 μA, range, 20–30 μA, median, 20 μA, n = 7) versus dextran (mean, 51.7 μA, range, 20–90 μA, median, 45 μA; p < 0.05, n = 6) (Fig. 6). AD duration was similar in the two experimental groups (albumin, 44.7 ± 7.7 s; dextran, 30.4 ± 3.9 s). Three months after albumin injection, we did not detect albumin signal in the hippocampus, or evidence of cell loss or glia activation as determined by immunohistochemistry (data not shown).
Figure 6.
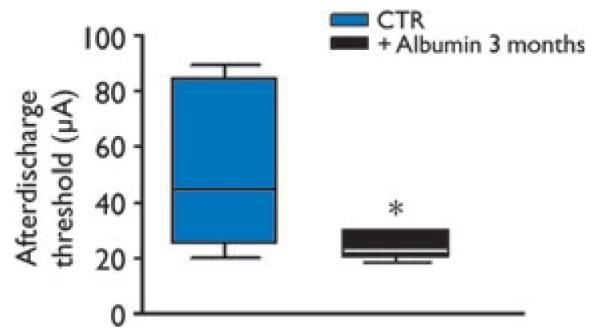
Long-term decrease of seizure threshold induced by rat albumin. Box plots show the hippocampal afterdischarge threshold in rats 3 months after dextran (CTR, n = 6) or albumin injection (500 μg/4 μl, i.c.v., n = 7), as assessed by electrical stimulation of the septal pole of the hippocampus. *p < 0.05 versus CTR by Mann-Whitney U test.
Epilepsia © ILAE
Discussion
The main conclusion of our study is that a transient exposure of hippocampal tissue to albumin concentrations mimicking those attained after SE is sufficient to provoke increased neuronal excitability and enhanced seizure susceptibility in rats. This conclusion is supported by the following findings.
(1) A single bolus of albumin triggered a rapid onset and transient spiking activity in the hippocampus with a peak effect between 15 and 60 min from injection. This rapid effect on neuronal excitability and synchronization occurs when albumin is detected mainly in the extracellular space of the neuropil. The low molar concentration of albumin and the specificity to albumin (and not similar molecular weight dextran) indicate that osmolarity changes induced by protein accumulation are not a major determinant of the altered excitability. At least two concomitant mechanisms may contribute to the acute increase in neuronal excitability provoked by albumin: the net negative charge of albumin and/or its binding to extracellular calcium/magnesium, which may alter the membrane surface charge, and the down-regulation of astrocytic Kir4.1 channels impairing the buffering of extracellular K+ (Ivens et al., 2007; Friedman & Dingledine, 2011). (2) Although the increased spontaneous spiking activity induced by albumin was transient, changes in brain excitability persisted. Therefore, rats showed an increased propensity to develop epileptiform activity after low convulsant doses of KA. Notably, KA injection after 24 h brain exposure to albumin resulted in more prolonged epileptiform activity as compared to KA injected after 2 h brain exposure to albumin. This progressive time-dependent increase in hippocampal excitability may depend on differing signaling pathways activated by the extracellular (2 h) versus intracellular (24 h) albumin, or may reflect the additional involvement of slow cellular processes initiated by albumin itself and/or by the evoked spiking activity (e.g., transcription and translation of new proteins, Cacheaux et al., 2009). Consistent with previous studies in the neocortex (Cacheaux et al., 2009), albumin extravasation in the hippocampus induces local inflammation demonstrated by the induction of the proinflammatory cytokine IL-1β in GFAP-positive astrocytes. Of interest, this phenomenon increased considerably between 2 and 24 h after albumin injection. Because hippocampal IL-1β has proconvulsant effects (Vezzani et al., 2011a,b), it may contribute to the progression and persistence of albumin effects on neuronal excitability. Similarly, the persistent down-regulation of astrocytic Kir4.1 channels initiated by albumin injection may contribute to the long-lasting increase in neuronal excitability (Ivens et al., 2007; Friedman & Dingledine, 2011). (3) Rats displayed a significant reduction in seizure threshold 3 months after albumin injection. At this time, we did not detect albumin in the brain; this supports that a transient tissue exposure to albumin may prime a long-lasting increase in brain excitability. The mechanisms underlying this long-term effect are presently unknown.
Our study addresses some still unresolved issues. The first issue relates to the brain albumin concentration following prolonged epileptic activity, first measured here. These measurements allowed us to reproduce the albumin brain concentration induced by BBB damage in the hippocampus, and to assess its potential consequences. Moreover, the exposure of the healthy brain tissue to albumin permits to isolate the effect of this serum protein from the concomitant pathologic events developing during prolonged seizures (e.g., cellular, molecular and functional plasticity, and neuronal damage; Pitkanen & Lukasiuk, 2011). A similar approach was described by Ivens et al. (2007) who perfused bovine serum albumin for 30 min onto the rat neocortex (0.1–0.4 mm) detecting spontaneous epileptiform activity after 5 days, and by Stewart et al. (2010) who injected similar rat serum concentrations in the rat neocortex for 6 days, resulting in the generation of epileptiform activity. The lack of frank seizure activity induced by albumin in our study may relate to the relatively low concentration attained in hippocampus (400 times lower than serum levels), or to the single bolus injection (representing a transient BBB opening as it occurs during recurring seizures, van Vliet et al., 2007) as compared to the prolonged exposure in the other studies. The brain area predominantly exposed to albumin, that is, the hippocampus versus neocortex, could also determine the observed effects. These differences highlight that the consequences of BBB alterations for tissue excitability are likely determined by several factors, including the extent and duration of BBB opening and the brain regions mostly involved. At this regard, it should be noted that i.c.v. albumin injection in naive rats induced increased levels also in extrahippocampal brain regions involved in the epileptic circuitry during SE, although the albumin concentration attained in the entorhinal cortex was lower than after SE.
This set of data also suggest that the pathologic event provoking BBB breakdown is likely to be one main determinant of the functional consequences induced by albumin in the brain. For example, a massive and prolonged brain exposure to albumin might be envisaged following traumatic brain injury (Shlosberg et al., 2010), whereas a more moderate and transient exposure may occur during recurrent seizures when BBB leakage is predominantly repaired within 24 h from the last seizure event (van Vliet et al., 2007).
In accordance with evidence in human and experimental epileptic tissue (van Vliet et al., 2007), we found that there was uptake of albumin by hippocampal neurons. Notably, in vivo studies reported serum albumin prevalently inside hippocampal principal neurons at late stages of SE (Friedman, 2011). Although in epileptic tissue the albumin-positive neurons are argyrophilic indicating a suffering state, in our model no signs of cell damage were observed. Our data indicate that albumin per se is not neurotoxic, suggesting that the features of cellular damage in albumin-positive neurons in epileptic tissue (Rigau et al., 2007; van Vliet et al., 2007) are probably unrelated to albumin itself but determined by the underlying neuropathology. The increased CA3 neuronal cell loss found after KA in rats pretreated 24 h (but not 2 h) with albumin is likely due to the more prolonged epileptiform activity developing in these rats.
The lack of albumin staining in GFAP-positive cells is at variance with previous observations of positive staining in astrocytes (Ivens et al., 2007). This difference could be ascribed to the higher concentration of albumin and longer perfusion time that were used in previous investigations as compared to our study. Albumin staining of GFAP-positive astrocytes has been also reported in in vivo models of seizures and in human epileptic tissue (van Vliet et al., 2007; Raabe et al., 2012) suggesting that preactivation of glia by seizures or the associated neuropathology may be required for glial uptake of this macromolecule.
The main mechanism activated by albumin so far identified is the activation of TGF-βRII signaling in neocortical astrocytes (Cacheaux et al., 2009). This signaling pathway leads to transcriptional changes in astrocytes, including the down-regulation of the Kir4.1 channel and the up-regulation of various inflammatory genes (Cacheaux et al., 2009). Consistent with these reports, we found that hippocampal albumin induces the activation of GFAP-positive astrocytes and the concomitant synthesis of IL-1β in these cells, as well as a reduction of Kir4.1 tissue levels. These findings support that TGF-βRII signaling is activated by albumin also in the hippocampus. We cannot exclude that the induction of IL-1β in GFAP-positive astrocytes is also determined by the initial epileptiform activity (Vezzani et al., 2011a,b) induced by albumin.
Although the modalities of albumin activation of this receptor-mediated signaling are still unknown, our data suggests that astrocytic albumin uptake is not required, since we did not detect albumin within these cells. Accordingly, Cacheaux et al. (2009) reported that TGF-βRII blockers prevent albumin-induced transcriptional changes in astrocytes and showed that albumin and TGF-βRII coimmunoprecipitate. These findings imply that albumin effects are mediated by a transmembrane receptor protein rather than being strictly dependent on its own cellular uptake.
In summary, our findings support a direct pro-ictogenic effect of serum albumin when this protein is transiently present in hippocampus at pathologic relevant concentrations, mimicking those attained after prolonged seizure activity. Indeed, albumin induces a rapid neuronal synchronization in the hippocampus, and determines long-lasting increased excitability and decreased seizure threshold. The lack of spontaneous seizures in our model suggests that albumin, together with the associated astrocytic production of inflammatory molecules, is not sufficient to trigger hippocampal seizures, although is able to significantly increase brain excitability. The onset of seizures may require the concerted action of additional pathologic events developing in epileptogenic tissue (Pitkanen & Lukasiuk, 2011), or a longer exposure time to higher albumin concentrations, or the concomitant presence of pathologic albumin concentrations in other brain regions.
Accordingly, previous evidence showed that intracarotid mannitol, which induces a massive and widespread BBB opening (van Vliet et al., 2010), provokes synchronization of neuronal activity (Fieschi et al., 1980), transient seizures in pigs (Marchi et al., 2007), and increased spontaneous seizure activity in epileptic rats (van Vliet et al., 2007).
Our evidence highlights BBB breakdown and brain inflammation as potential targets of antiepileptogenic strategies aimed at increasing seizure threshold (Friedman, 2011; Ravizza et al., 2011), as well as putative biomarkers of ictogenesis and epileptogenesis (Vezzani & Friedman, 2012).
Supplementary Material
Acknowledgments
This work was supported by Fondazione Monzino and Nepente (Regione Lombardia, Italy, Institutional Agreement n. 14501A) (A.V.). The authors are grateful to Christian Steinhauser for the useful discussion of these data.
Footnotes
Disclosure None of the authors has any conflict of interest to disclose. All the authors have read the Journal’s position on issues involved in ethical publication and affirm that this report is consistent with those guidelines.
Supporting Information Additional Supporting Information may be found in the online version of this article:
Please note: Wiley-Blackwell is not responsible for the content or functionality of any supporting information supplied by the authors. Any queries (other than missing material) should be directed to the corresponding author for the article.
References
- Abbott JN. Inflammatory mediators and modulation of blood–brain barrier permeability. Cell Mol Neurobiol. 2000;20:131–147. doi: 10.1023/a:1007074420772. [DOI] [PubMed] [Google Scholar]
- Abbott NJ, Patabendige AA, Dolman DE, Yusof SR, Begley DJ. Structure and function of the blood–brain barrier. Neurobiol Dis. 2010;37:13–25. doi: 10.1016/j.nbd.2009.07.030. [DOI] [PubMed] [Google Scholar]
- Bartfai T, Sanchez-Alavez M, Andell-Jonsson S, Schultzberg M, Vezzani A, Danielsson E, Conti B. Interleukin-1 system in CNS stress: seizures, fever, and neurotrauma. Ann N Y Acad Sci. 2007;1113:173–177. doi: 10.1196/annals.1391.022. [DOI] [PubMed] [Google Scholar]
- Cacheaux LP, Ivens S, David Y, Lakhter AJ, Bar-Klein G, Shapira M, Heinemann U, Friedman A, Kaufer D. Transcriptome profiling reveals TGF-beta signaling involvement in epileptogenesis. J Neurosci. 2009;29:8927–8935. doi: 10.1523/JNEUROSCI.0430-09.2009. [DOI] [PMC free article] [PubMed] [Google Scholar]
- David Y, Cacheaux LP, Ivens S, Lapilover E, Heinemann U, Kaufer D, Friedman A. Astrocytic dysfunction in epileptogenesis: consequence of altered potassium and glutamate homeostasis? J Neurosci. 2009;29:10588–10599. doi: 10.1523/JNEUROSCI.2323-09.2009. [DOI] [PMC free article] [PubMed] [Google Scholar]
- Fieschi C, Lenzi GL, Zanette E, Orzi F, Passero S. Effects on EEG of the osmotic opening of the blood–brain barrier in rats. Life Sci. 1980;27:239–243. doi: 10.1016/0024-3205(80)90143-5. [DOI] [PubMed] [Google Scholar]
- Freeman FG, Jarvis MF. The effect of interstimulation interval on the assessment and stability of kindled seizure thresholds. Brain Res Bull. 1981;7:629–633. doi: 10.1016/0361-9230(81)90109-x. [DOI] [PubMed] [Google Scholar]
- Friedman A. Blood–brain barrier dysfunction, status epilepticus, seizures, and epilepsy: a puzzle of a chicken and egg? Epilepsia. 2011;52(Suppl. 8):19–20. doi: 10.1111/j.1528-1167.2011.03227.x. [DOI] [PMC free article] [PubMed] [Google Scholar]
- Friedman A, Dingledine R. Molecular cascades that mediate the influence of inflammation on epilepsy. Epilepsia. 2011;52(Suppl. 3):33–39. doi: 10.1111/j.1528-1167.2011.03034.x. [DOI] [PMC free article] [PubMed] [Google Scholar]
- Friedman A, Kaufer D, Heinemann U. Blood–brain barrier breakdown-inducing astrocytic transformation: novel targets for the prevention of epilepsy. Epilepsy Res. 2009;85:142–149. doi: 10.1016/j.eplepsyres.2009.03.005. [DOI] [PMC free article] [PubMed] [Google Scholar]
- Ivens S, Kaufer D, Flores LP, Bechmann I, Zumsteg D, Tomkins O, Seiffert E, Heinemann U, Friedman A. TGF-beta receptor-mediated albumin uptake into astrocytes is involved in neocortical epileptogenesis. Brain. 2007;130:535–547. doi: 10.1093/brain/awl317. [DOI] [PubMed] [Google Scholar]
- Marchi N, Angelov L, Masaryk T, Fazio V, Granata T, Hernandez N, Hallene K, Diglaw T, Franic L, Najm I, Janigro D. Seizurepromoting effect of blood–brain barrier disruption. Epilepsia. 2007;48:732–742. doi: 10.1111/j.1528-1167.2007.00988.x. [DOI] [PMC free article] [PubMed] [Google Scholar]
- Nag S, Kapadia A, Stewart DJ. Review: molecular pathogenesis of blood–brain barrier breakdown in acute brain injury. Neuropathol Appl Neurobiol. 2011;37:3–23. doi: 10.1111/j.1365-2990.2010.01138.x. [DOI] [PubMed] [Google Scholar]
- Noe’ F, Pool AH, Nissinen J, Gobbi M, Bland R, Rizzi M, Balducci C, Ferraguti F, Sperk G, During MJ, Pitkanen A, Vezzani A. Neuropeptide Y gene therapy decreases chronic spontaneous seizures in a rat model of temporal lobe epilepsy. Brain. 2008;131:1506–1515. doi: 10.1093/brain/awn079. [DOI] [PubMed] [Google Scholar]
- Noe’ F, Vaghi V, Balducci C, Fitzsimons H, Bland R, Zardoni D, Sperk G, Carli M, During MJ, Vezzani A. Anticonvulsant effects and behavioural outcomes of rAAV serotype 1 vector-mediated neuropeptide Y overexpression in rat hippocampus. Gene Ther. 2010;17:643–652. doi: 10.1038/gt.2010.23. [DOI] [PubMed] [Google Scholar]
- Paxinos G, Watson C. The rat brain in stereotaxic coordinates. Academic Press; New York: 1986. [DOI] [PubMed] [Google Scholar]
- Perillan PR, Chen M, Potts EA, Simard JM. Transforming growth factor-beta 1 regulates Kir2.3 inward rectifier K+ channels via phospholipase C and protein kinase C-delta in reactive astrocytes from adult rat brain. J Biol Chem. 2002;277:1974–1980. doi: 10.1074/jbc.M107984200. [DOI] [PubMed] [Google Scholar]
- Pitkanen A, Lukasiuk K. Mechanisms of epileptogenesis and potential treatment targets. Lancet Neurol. 2011;10:173–186. doi: 10.1016/S1474-4422(10)70310-0. [DOI] [PubMed] [Google Scholar]
- Pitkanen A, Sutula TP. Is epilepsy a progressive disorder? Prospects for new therapeutic approaches in temporal-lobe epilepsy. Lancet Neurol. 2002;1:173–181. doi: 10.1016/s1474-4422(02)00073-x. [DOI] [PubMed] [Google Scholar]
- Proescholdt MA, Heiss JD, Walbridge S, Muhlhauser J, Capogrossi MC, Oldfield EH, Merrill MJ. Vascular endothelial growth factor (VEGF) modulates vascular permeability and inflammation in rat brain. J Neuropathol Exp Neurol. 1999;58:613–627. doi: 10.1097/00005072-199906000-00006. [DOI] [PubMed] [Google Scholar]
- Raabe A, Schmitz AK, Pernhorst K, Grote A, von der Brelie C, Urbach H, Friedman A, Becker AJ, Elger CE, Niehusmann P. Cliniconeuropathologic correlations show astroglial albumin storage as a common factor in epileptogenic vascular lesions. Epilepsia. 2012;53:539–548. doi: 10.1111/j.1528-1167.2012.03405.x. [DOI] [PMC free article] [PubMed] [Google Scholar]
- Ravizza T, Gagliardi B, Noe F, Boer K, Aronica E, Vezzani A. Innate and adaptive immunity during epileptogenesis and spontaneous seizures: evidence from experimental models and human temporal lobe epilepsy. Neurobiol Dis. 2008;29:142–160. doi: 10.1016/j.nbd.2007.08.012. [DOI] [PubMed] [Google Scholar]
- Ravizza T, Balosso S, Vezzani A. Inflammation and prevention of epileptogenesis. Neurosci Lett. 2011;497:223–230. doi: 10.1016/j.neulet.2011.02.040. [DOI] [PubMed] [Google Scholar]
- Rigau V, Morin M, Rousset MC, de Bock F, Lebrun A, Coubes P, Picot MC, Baldy-Moulinier M, Bockaert J, Crespel A, Lerner-Natoli M. Angiogenesis is associated with blood–brain barrier permeability in temporal lobe epilepsy. Brain. 2007;130:1942–1956. doi: 10.1093/brain/awm118. [DOI] [PubMed] [Google Scholar]
- Shlosberg D, Benifla M, Kaufer D, Friedman A. Blood–brain barrier breakdown as a therapeutic target in traumatic brain injury. Nat Rev Neurol. 2010;6:393–403. doi: 10.1038/nrneurol.2010.74. [DOI] [PMC free article] [PubMed] [Google Scholar]
- Stewart TH, Eastman CL, Groblewski PA, Fender JS, Verley DR, Cook DG, D’Ambrosio R. Chronic dysfunction of astrocytic inwardly rectifying K+ channels specific to the neocortical epileptic focus after fluid percussion injury in the rat. J Neurophysiol. 2010;104:3345–3360. doi: 10.1152/jn.00398.2010. [DOI] [PMC free article] [PubMed] [Google Scholar]
- Turski WA, Cavalheiro EA, Schwarz M, Czuczwar SJ, Kleinrok Z, Turski L. Limbic seizures produced by pilocarpine in rats: behavioural, electroencephalographic and neuropathological study. Behav Brain Res. 1983;9:315–335. doi: 10.1016/0166-4328(83)90136-5. [DOI] [PubMed] [Google Scholar]
- van Vliet EA, da Costa Araujo S, Redeker S, van Schaik R, Aronica E, Gorter JA. Blood–brain barrier leakage may lead to progression of temporal lobe epilepsy. Brain. 2007;130:521–534. doi: 10.1093/brain/awl318. [DOI] [PubMed] [Google Scholar]
- van Vliet EA, Zibell G, Pekcec A, Schlichtiger J, Edelbroek PM, Holtman L, Aronica E, Gorter JA, Potschka H. COX-2 inhibition controls P-glycoprotein expression and promotes brain delivery of phenytoin in chronic epileptic rats. Neuropharmacology. 2010;58:404–412. doi: 10.1016/j.neuropharm.2009.09.012. [DOI] [PubMed] [Google Scholar]
- Vezzani A, Friedman A. Brain inflammation as a biomarker in epilepsy. Biomark Med. 2012;5:607–614. doi: 10.2217/bmm.11.61. [DOI] [PMC free article] [PubMed] [Google Scholar]
- Vezzani A, Conti M, De Luigi A, Ravizza T, Moneta D, Marchesi F, De Simoni MG. Interleukin-1beta immunoreactivity and microglia are enhanced in the rat hippocampus by focal kainate application: functional evidence for enhancement of electrographic seizures. J Neurosci. 1999;19:5054–5065. doi: 10.1523/JNEUROSCI.19-12-05054.1999. [DOI] [PMC free article] [PubMed] [Google Scholar]
- Vezzani A, Maroso M, Balosso S, Sanchez MA, Bartfai T. IL-1 receptor/Toll-like receptor signaling in infection, inflammation, stress and neurodegeneration couples hyperexcitability and seizures. Brain Behav Immun. 2011a;25:1281–1289. doi: 10.1016/j.bbi.2011.03.018. [DOI] [PubMed] [Google Scholar]
- Vezzani A, French J, Bartfai T, Baram TZ. The role of inflammation in epilepsy. Nat Rev Neurol. 2011b;7:31–40. doi: 10.1038/nrneurol.2010.178. [DOI] [PMC free article] [PubMed] [Google Scholar]
- Vezzani A, Friedman A, Dingledine RJ. The role of inflammation in epileptogenesis. Neuropharmacology. 2012 Apr 13; doi: 10.1016/j.neuropharm.2012.04.004. [Epub ahead of print] [DOI] [PMC free article] [PubMed] [Google Scholar]
- Zlokovic BV. The blood–brain barrier in health and chronic neurodegenerative disorders. Neuron. 2008;57:178–201. doi: 10.1016/j.neuron.2008.01.003. [DOI] [PubMed] [Google Scholar]
Associated Data
This section collects any data citations, data availability statements, or supplementary materials included in this article.