

Abstract
Objective
Abdominal adiposity is associated with increased cardiovascular risk and decreased growth hormone (GH) secretion. The objective of our study was to determine the effects of GH in abdominally obese women on body composition and cardiovascular risk markers.
Materials and Methods
In this randomized, double-blind, placebo-controlled study, 79 obese premenopausal women received GH vs. placebo for six months. Primary endpoints were: 1) total abdominal (TAT) fat by CT (body composition) and 2) high-sensitivity C-reactive protein (hsCRP) (cardiovascular risk marker). Body composition was assessed by CT, DXA and proton MR spectroscopy. Serum cardiovascular risk markers, carotid intima-media thickness and endothelial function were measured.
Results
Mean 6-month GH dose was 1.7±0.1 mg/day, resulting in a mean IGF-1 SDS increase from −1.7±0.08 to −0.1±0.3 in the GH group. GH administration decreased TAT and hsCRP compared with placebo. In addition, it increased thigh muscle mass and lean body mass, and decreased subcutaneous abdominal and trunk fat, tPA, apoB, and apoB/LDL compared with placebo. Visceral adipose tissue decreased and IMCL increased within the GH group. Six-month change in IGF-1 levels was negatively associated with 6-month decrease in TAT and VAT. One subject had a 2-hour glucose >200 mg/mL at 3 months; four subjects, three of whom were randomized to GH, had 2-hour glucose levels >200 mg/mL at study end.
Conclusion
GH administration in abdominally obese premenopausal women exerts beneficial effects on body composition and cardiovascular risk markers, but is associated with a decrease in glucose tolerance in a minority of women.
Keywords: growth hormone, visceral obesity, body composition, cardiovascular risk
Introduction
Abdominal adiposity is associated with a marked increase in coronary heart disease and increased inflammatory cardiovascular markers, including high sensitivity C-reactive protein (hsCRP) and carotid artery wall thickening (1, 2). In women with increased abdominal adiposity, physiologic growth hormone (GH) secretion is impaired and peak stimulated GH response is decreased (3, 4). GH plays a role in modulating body composition, and GH deficiency in women with hypopituitarism is associated with increased body fat, including visceral adiposity, and decreased lean body mass (5). Visceral adiposity has also been shown to be a major determinant of GH secretion in non- obese adults (6).GH is also a mediator of atherogenesis. GH has cytokine-like effects and its administration results in decreased hsCRP levels in patients with pituitary disorders and GH deficiency (7, 8). GH also increases LDL receptor activity and affects the expression of key enzymes involved in intracellular cholesterol metabolism in the liver (9). Moreover, we have reported an independent inverse association between GH and intramyocellular lipids (IMCL), a marker of insulin resistance, and intrahepatic fat in obese women, suggesting that low GH contributes to insulin resistance through effects on skeletal muscle and intrahepatic lipids (10).
Insulin-like growth factor-1 (IGF-1), an important modulator of body composition, is secreted by the liver and other organs in response to GH. As IGF-1 is an important determinant of body composition, particularly critical for the maintenance of muscle mass (11), reduced levels in obese premenopausal women may exert deleterious effects on body composition. Although the effects of GH administration to decrease visceral adiposity, increase muscle mass, and improve cardiovascular risk markers, including hsCRP, are well established in patients with GH deficiency due to hypothalamic/pituitary disorders (7, 8, 12), few studies have been performed administering low-dose GH in otherwise healthy obese subjects (13–16). Administration of low-dose GH to obese men (14, 15) and post-menopausal women (13) resulted in decreased visceral fat mass and improved lipid profiles, suggesting a possible beneficial effect of GH in healthy subjects with visceral obesity. However, no studies have been performed on the effects of GH on cardiovascular risk factors, including inflammatory markers, and detailed measures of body composition, focusing on premenopausal women with abdominal obesity. Given the strong association between abdominal obesity and cardiovascular disease, we investigated the effects of GH-induced changes on body composition, lipid profile, inflammatory markers and glucose metabolism in order to enhance our understanding of the effects of low endogenous GH in obese premenopausal women.
We hypothesized that GH treatment for six months would result in a reduction in total abdominal adipose tissue and hsCRP levels (primary endpoints) in premenopausal women with relative GH and IGF-1 deficiency due to abdominal obesity. We also hypothesized that both visceral and subcutaneous adipose tissue depots would decrease, and muscle mass would increase with GH administration. We also explored effects on other cardiovascular risk markers. In addition, we hypothesized that although acute GH administration would increase glucose intolerance, chronic GH administration would result in normalization of measures of glucose tolerance due to an increase in muscle mass and a decrease in IMCL and intra-hepatic lipid concentrations.
Subjects and Methods
The study was approved by the institutional review board of Partners HealthCare Inc. and was Health Insurance Portability and Accountability Act compliant. Written informed consent was obtained from all subjects prior to performance of any study procedures.
Subjects
Subjects were recruited from the community through advertisements. Inclusion criteria were: ages 18–45 years, female gender, eumenorrhea, BMI ≥ 25 kg/m2, waist circumference >88 cm (17, 18), IGF-1 level within the lowest 2 quartiles for age, stable weight (defined as weight loss or weight gain ≤ 5 pounds in the preceding 3 months), and willingness to maintain current activity level and diet for the duration of the study. Exclusion criteria included smoking, pregnancy or breastfeeding, hypothalamic or pituitary disorders, diabetes mellitus or other chronic illnesses, estrogen or glucocorticoid use, use of statins, anti-hypertensives, or regular use of aspirin.
One-hundred fifty-four obese premenopausal women were screened for participation in the double-blind, placebo-controlled trial. Eighty subjects met criteria and were enrolled in the study; one subject was discontinued due to a positive pregnancy test at the baseline visit before any procedures were performed or study medication was dispensed. Seventy-nine subjects completed the baseline visit, 72 subjects completed the 3-week visit, 68 subjects completed the 6-week visit, 66 subjects completed the 9-week visit, 59 subjects completed the 3-month visit, and 50 subjects completed the 6-month visit.
Nineteen subjects withdrew for personal reasons, eight for medical causes (breast lump discovered before initiation of study medication, goiter [placebo group], cervical human papilloma virus, cancer [placebo group], breast calcifications noted on mammogram, 2-hour OGTT glucose >200 mg/dl (11.1 mmol/L) [n=1 pre-treatment and n=1 after initiation of study medication], and rash). One subject was discontinued due to oral contraceptive initiation, and one due to IV access issues. Eleven drop-outs had been randomized to GH and 18 to placebo (Figure 1). Drop-outs were replaced to achieve the predetermined n=50 completers at six months. Baseline clinical characteristics and body composition have been previously reported on a subset of these study subjects (4, 10, 19–23), but no longitudinal data have been previously published.
Figure 1.

Flow diagram of randomized trial of GH versus placebo according to CONSORT guidelines.
Protocol
The study was a 6-month, double-blind, randomized, placebo-controlled trial performed on the Massachusetts General Hospital General Clinical Research Center.
Baseline IGF-1 and cardiovascular risk markers were drawn after an overnight fast, followed by a 75-g, 2-hour oral glucose tolerance test (OGTT). Computed tomography (CT) at the level of the 4th lumbar vertebra (L4) and mid-thigh and dual-energy x-ray absorptiometry (DXA) were performed to assess body composition and bioelectric impedance analysis (BIA) was performed to assess total body water. Proton magnetic resonance spectroscopy (1H-MRS) of soleus muscle and liver was performed to determine intramyocellular lipids (IMCL) and intrahepatic lipids (IHL). A GH releasing hormone (GHRH)-arginine stimulation test was performed in a subset of patients (n=39) as previously described (4); testing was discontinued when GHRH became unavailable in the U.S. After baseline evaluation, subjects were randomized to receive daily subcutaneous (sc) recombinant human GH (Genentech, Inc., South San Francisco, CA) or placebo, which was identical in appearance to the GH, for 6 months. Randomization was performed by the Massachusetts General Hospital research pharmacy to maintain double-blinding. Starting GH dose was four micrograms per kilogram per day. Subjects were asked to inject the study medication before bed..
Follow-up visits were performed at 3 weeks, 6 weeks, 9 weeks, 3 months, and 6 months after baseline testing. GH doses were adjusted based on IGF-1 levels at all visits, by a physician not involved in the study, using an algorithm based on pre-treatment IGF-1 level and an IGF-1 level target in the upper normal age-appropriate range. Participants in the placebo group were sham dose adjusted to maintain study-subject and investigator blinding to randomization assignment. Body composition with CT and 1H-MRS and cardiovascular endpoints were measured at baseline, 6 weeks and 6 months. DXA was performed at baseline, 3 months and 6 months. OGTTs were performed at baseline, 6 weeks, 3 months, and 6 months.
Body composition evaluation
Fat mass and fat-free mass were measured by DXA (Hologic QDR-4500, Hologic Inc., Waltham, MA) at baseline, 3 months, and 6 months (precision error of 1.7% for fat mass and of 2.4% for fat-free mass). Each subject underwent single-slice CT of the abdomen at the level of L4, and 52 subjects underwent additional single-slice CT of the left mid-thigh at baseline, 6 weeks, and 6 months as previously described (19) (coefficient of variation (cv) <1% for fat and muscle area). Abdominal subcutaneous adipose tissue (SAT), visceral adipose tissue (VAT), and total adipose tissue (TAT) areas, and thigh muscle cross sectional areas (CSA) were determined. BIA was used to measure total body water (precision < 3%) using Bioelectrical Analyzer model BIA 101 (RJL Systems, Clinton Township, MI) at baseline, 6 weeks, and 6 months using standard protocol (24). Resting energy expenditure (REE) was calculated from substrate oxidation rates obtained by indirect calorimetry (Vmax29N Sensor Medics; Vyasis Healthcare, Loma Linda, CA) after an overnight fast (25) at baseline, 3 month and 6 month. 1H-MRS of calf muscle and liver was performed in 42 subjects using a 3.0 Tesla MRI system (Siemens Trio; Siemens Medical Systems, Erlangen, Germany) following an overnight fast at baseline, 6 weeks, and 6 months. 1H-MRS of soleus muscle and liver (cv=6% for intramuscular and 8% for intrahepatic fat) was performed as previously described (20, 21). All body composition analyses were performed by study personnel blinded to the randomization assignment.
Cardiovascular risk factor analysis
Real-time serum IGF-1 for GH dose adjustment was measured using an Immulite 2000 automated immunoanalyzer (Diagnostic Products Corp., Los Angeles, CA), by a solid-phase enzyme-labeled chemiluminescent immunometric assay, with a coefficient of variation (cv) of <5%. Serum IGF-1 levels were batched and run after study completion for correlational analyses by IDS-iSYS Multi-Discipline Automated Analyser (Immunodiagnostic Systems, Inc., Fountain Hills, AZ) with cv ≤2%. GH levels were measured using an immunoradiometric assay kit (Diagnostic Systems Laboratories Inc., Webster, TX), with a minimum detection limit of 0.01 ng/ml and a cv of <6%. hsCRP, fibrinogen, and apolipoprotein B were measured by latex particle-enhanced immunoturbidmetric assay on an Hitachi 911 analyzer (Roche Diagnostics, Indianapolis) with cvs of <6%. tPA was measured using an ELISA assay (American Diagnostica, Greenwich, CT), with a cv <6%. Insulin was measured using an RIA kit (Linco, Research, Inc., St. Charles, MO). Homeostasis model assessment-insulin resistance (HOMA-IR) was calculated as insulin (mIU per milliliter) x glucose (millimoles per liter)/22.5.
Carotid intima-media thickness (IMT) was measured at baseline and at 6 months by a single cardiologist, blinded to treatment randomization, as previously described (cv=4.7%) (26).
A fingertip peripheral arterial tonometry (PAT) device (Endo-PAT2000, Itamar Medical, Caesarea, Israel) was used to measure endothelial function in 40 subjects, and reactive hyperemic index (RHI) was calculated (27).
Compliance
To test for compliance of GH administration, 6-month and 3-month blood samples from all subjects in the GH group who completed the 6-month visit (n=28) and 6-week blood samples from subjects who dropped out between the 6-week and 3-month visits (n=7) were analyzed for the presence of 22-kDa hGH, which becomes predominant after administration of rhGH, using specific sandwich-type immunoassays as previously described (28) with improved monocloncal antibodies (29).
Physical activity
Subjects were asked to refrain from modifying their exercise levels throughout the duration of the study. Level of activity, including exercise, was assessed using the Paffenbarger questionnaire, a self-administered questionnaire that measures current levels of activity. The Modified Activity Questionnaire (MAQ) assesses activity level over the past year and was used to investigate whether women who have a higher chronic basal activity level would experience greater or lesser effects of GH administration than sedentary women.
Statistical analysis
The primary body composition endpoint was TAT and the primary cardiovascular risk marker endpoint was hsCRP. The study was powered based on a study by Sesmilo et al (8). With 25 evaluable study subjects in each study arm, we had greater than 90% power for detecting a difference of 1.68 in hsCRP at a two-sided 0.05 significance level, assuming a standard deviation of the difference from baseline of 1.79.
The data was analyzed using repeated measures analysis of variance with the treatment difference at 6 months as the primary contrast of interest (SAS Proc Mixed, SAS Institute, Cary, NC). This analysis included all data collected on all study subjects irrespective of whether the subject completed the 6 months of follow up and follows the Institute of Medicine suggestion for analysis of data with missing observations. http://books.nap.edu/openbook.php?record_id=12955. Outliers were removed by quantile analysis, in which outliers above or below 1.5 times the interquartile range are excluded. A secondary analysis included outlying observations is reported when the results differed. Within-group treatment effects were assessed using paired t-tests. Univariate regression models were constructed to determine hormonal and body composition predictors of endpoints studied, and Spearman rhos are reported. Multivariate models were constructed using standard least squares regression modeling to control for baseline age, IGF-1 level and BMI. Statistical significance was defined as a two-tailed p< 0.05.
Results
Baseline characteristics
Baseline characteristics are presented in Table 1. Thirty-nine subjects were randomized to receive GH and 40 subjects to receive placebo. Both groups were of comparable age, IGF-1 levels, BMI, body composition, and cardiovascular risk marker levels, and there was no significant difference in any baseline parameter between the groups at baseline. Subjects ranged in age from 21 to 45 years, with a mean of 36±0.8 years. Subjects ranged in BMI from 25 to 50 kg/m2, with a mean of 35±0.6 kg/m2. There was no difference between completers and drop-outs in any baseline characteristics, including age, BMI, body composition parameters, cardiovascular risk markers and IGF-1. There was no difference in REE at baseline, 3-month or 6-month between the groups (p= 0.9). Baseline physical activity determined using the Paffenbarger questionnaire, was similar in both groups and remained unchanged during the study (p=0.4 to 0.6). However, women in the GH group had lower baseline activity levels as determined by MAQ, compared to controls (12.0±1.5 vs. 18.6±2.2, p=0.03).
Table 1.
Baseline characteristics
| GH group (n= 39) | Placebo group (n= 40) | p | |
|---|---|---|---|
| Age (years) | 35.7±1.1 | 36.1±1.1 | 0.8 |
| BMI (kg/m2) | 34.8±0.8 | 34.9±0.9 | 0.9 |
| Peak stimulated GH (ng/mL) | 13.9±1.9 | 11.5±2.1 | 0.4 |
| IGF-1 (ng/mL) | 137.9±8.1 | 130.4±7.4 | 0.5 |
| IGF-1 SDS | −1.7±0.1 | −1.8±0.1 | 0.4 |
Data presented as mean±SEM. BMI: body mass index, IGF-1: insulin like growth factor 1, SDS: standard deviation score
Conversion to SI units: IGF-1 (ng/mL) multiply by 0.131 for nmol/L
The mean GH dose for the GH treatment group at 6 weeks was 0.5±0.02 mg/day and at 6 months 1.7±0.1 mg/day. These doses resulted in a mean IGF-1 level of 212.3±12.2 ng/mL (27.9±1.6 nmol/L) and mean IGF-1 SDS of −0.7±0.2 at 6 weeks and mean IGF-1 level of 265.1±23.0 ng/mL (34.7±3.0 nmol/L) and a mean IGF-1 z-score of −0.1±0.3 at 6 months (p<0.0001 compared to placebo) (Figure 2).
Figure 2.

IGF-1 levels (A) and IGF-1 standard deviation scores (SDS) (B) of subjects randomized to GH. Open diamonds represent mean values. Conversion to SI units: IGF-1 (ng/mL) multiply by 0.131 for nmol/L
Effects of GH administration on body composition
Body composition parameters at baseline, 6 weeks and 6 months are summarized in Table 2. There was a decrease in abdominal TAT (primary endpoint), as measured by CT, compared with placebo. SAT also decreased in the GH group compared to placebo. There were three outliers for change in abdominal TAT, one in the placebo group and two in the treatment group. When data from these individuals were included in the analysis the difference between the groups was no longer significant. Within the GH group, there was a significant decrease in VAT (p=0.03) at 6 months. A CT image at the level of L4 pre-treatment and at 6 months in a subject who received GH is shown in Figure 3. There was an increase in thigh muscle area, as measured by CT, in the GH group compared to placebo. There was a decrease in trunk fat measured by DXA in the GH group compared to placebo. There was no significant change in total body fat, as measured by DXA, between the GH and placebo group. There was a significant increase in lean mass measured by DXA in the GH group compared to placebo. Within the GH group, IMCL increased at 6 months (p=0.04), but this change was not significant compared with placebo. There was no significant change in intrahepatic lipids between the GH and placebo group. There was no significant change in weight and BMI in the GH group over the treatment period compared to the placebo group. Total body water did not change between GH and placebo over the treatment period (p=0.7).
Table 2.
Body composition in premenopausal women with abdominal obesity treated with GH vs placebo for 6 months
| Variable | Treatment | Baseline (n=79) | 6 weeks (n=68) | 6 months (n=50) | p-within group | p –between groups* |
|---|---|---|---|---|---|---|
| GH: n=39 | GH: n=35 | GH: n=28 | ||||
| Placebo: n=40 | Placebo: n=33 | Placebo: n=22 | ||||
|
| ||||||
| Abdomen TAT (cm2) (primary endpoint) | GH | 571.0±23.0 | 592.1± 35.1 | 538.8± 33.3 | 0.04 | 0.04 |
| Placebo | 591.1± 30.6 | 579.4±36.8 | 591.0±36.3 | 0.5 | ||
| Abdomen SAT (cm2) | GH | 466.2± 19.8 | 481.1±29.2 | 441.4±27.2 | 0.07 | 0.02 |
| Placebo | 475.3±24.7 | 472.1±30.6 | 474.5±29.6 | 0.6 | ||
| VAT (cm2) | GH | 105.0± 7.7 | 111.0± 11.1 | 97.0±8.3 | 0.03 | 0.6 |
| Placebo | 116.0±8.9 | 106.6±10.8 | 116.8±13.6 | 0.3 | ||
| Thigh muscle (cm2) | GH | 145.4±4.0 | 144.0±4.0 | 147.7±4.7 | 0.2 | 0.01 |
| Placebo | 142.7±4.3 | 142.0±4.4 | 136.9±3.7 | 0.1 | ||
| Total body fat (kg) ** | GH | 39.2±1.5 | 37.2±1.5 | 36.7±1.4 | 0.09 | 0.1 |
| Placebo | 40.1±1.7 | 41.8±2.3 | 42.3±2.5 | 0.7 | ||
| Trunk fat (kg)** | GH | 18.8± 0.8 | 18.0±0.8 | 17.3±0.7 | 0.03 | 0.04 |
| Placebo | 18.8±0.9 | 19.0±1.3 | 18.9±1.5 | 0.9 | ||
| Total lean mass (kg)** | GH | 52.1±1.1 | 53.8±1.2 | 54.0±1.2 | 0.0009 | 0.04 |
| Placebo | 52.2±1.0 | 51.7 (1.1) | 51.6±1.3 | 0.8 | ||
| IMCL-SOL (AU) | GH | 667.5±65.0 | 734.8±89.7 | 764.9±106.8 | 0.04 | 0.2 |
| Placebo | 661.2±67.4 | 710.0±63.3 | 752.6±89.4 | 0.9 | ||
| Intrahepatic lipids (%) | GH | 9.0±2.3 | 9.8±3.0 | 6.6±1.7 | 0.3 | 0.7 |
| Placebo | 7.2±2.4 | 8.7±3.0 | 9.9±4.1 | 0.8 | ||
p (0–6 months) determined by repeated measures analysis of variance
DXA was performed at baseline, 3 months, and 6 months
Data are presented as mean±SEM. BMI: body mass index, TAT: total adipose tissue, SAT: subcutaneous adipose tissue, VAT: visceral adipose tissue, IMCL-SOL: intramyocellular lipids of soleus, AU: arbitrary units,
Figure 3.
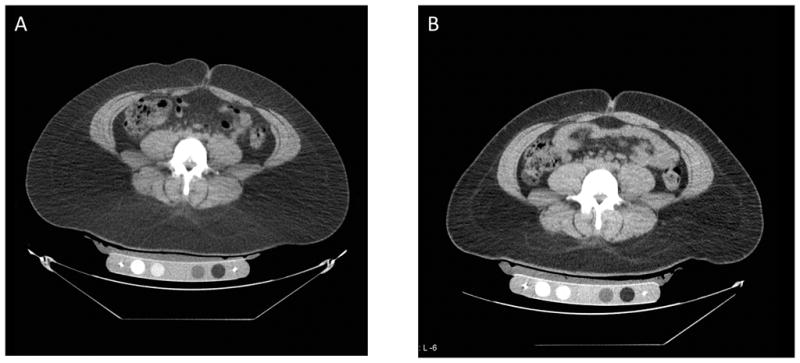
Abdominal CT at the level of L4 in a study subject before (A) and after (B) 6 months of GH administration showing reduction of abdominal fat (dark grey areas).
Effects of GH on cardiovascular risk markers
Cardiovascular risk makers at baseline, 6 weeks and 6 months are summarized in Table 3. There was a significant decrease in hsCRP (primary endpoint) in the GH group compared to placebo (Figure 4). Nine subjects in the GH group experienced a decrease in hsCRP cardiovascular risk quintile (by one to four quintiles), and one experienced an increase (by 2 quintiles). In the placebo group, five subjects experienced an increase and three a decrease (each by one quintile only).
Table 3.
Cardiovascular risk markers in premenopausal women with abdominal obesity treated with GH vs placebo for 6 months
| Variable | Treatment | Baseline (n=79) | 6 weeks (n=68) | 6 months (n=50) | p-within group | p-between groups* |
|---|---|---|---|---|---|---|
| GH: n=39 | GH: n=35 | GH: n=28 | ||||
| Placebo: n=40 | Placebo: n=33 | Placebo: n=22 | ||||
|
| ||||||
| hsCRP (mg/L) (primary endpoint) | GH | 2.8±0.4 | 2.6±0.4 | 1.5±0.2 | 0.02 | 0.002 |
| Placebo | 2.5±0.6 | 2.0±0.3 | 2.2±0.4 | 0.9 | ||
| Fibrinogen (mg/dL) | GH | 476.1±15.3 | 473.7±14.6 | 458.4±18.8 | 0.4 | 0.07 |
| Placebo | 481.5±14.7 | 496.7±14.8 | 513.5±26.3 | 0.09 | ||
| tPA (ng/mL) | GH | 6.7±1.1 | 7.2±1.3 | 5.7±1.3 | 0.6 | 0.03 |
| Placebo | 7.7±1.5 | 6.9±1.3 | 11.2±3.2 | 0.5 | ||
| Triglycerides (mg/dL) | GH | 102.6±8.5 | 105.0±9.4 | 100.3±8.9 | 1.0 | 0.7 |
| Placebo | 96.1±8.0 | 103.2±9.0 | 101.9±14.3 | 0.6 | ||
| Total cholesterol (mg/dL) | GH | 180.9±5.5 | 175.1±5.1 | 169.2±5.1 | 0.02 | 0.7 |
| Placebo | 176.8±6.3 | 180.8±6.0 | 176.4±6.2 | 0.4 | ||
| HDL cholesterol (mg/dL) | GH | 50.9±1.6 | 49.8±2.1 | 51.7±2.2 | 0.7 | 0.9 |
| Placebo | 47.2±1.9 | 49.2±2.8 | 47.9±3.3 | 0.9 | ||
| LDL cholesterol (mg/dL) | GH | 109.6±4.7 | 104.3±4.6 | 97.4±5.0 | 0.02 | 1.0 |
| Placebo | 110.5±5.6 | 109.3±4.7 | 108.2±6.0 | 0.1 | ||
| Apolipoprotein B (mg/dL) | GH | 88.6±3.6 | 86.2±3.4 | 78.0±3.9 | 0.01 | 0.04 |
| Placebo | 86.8±4.6 | 90.0±4.2 | 95.2±4.8 | 0.4 | ||
| Apolipoprotein B/LDL | GH | 0.82±0.02 | 0.82±0.02 | 0.81±0.02 | 0.7 | 0.006 |
| Placebo | 0.79±0.03 | 0.88±0.07 | 0.90±0.04 | 0.02 | ||
| Mean carotid IMT (mm)** | GH | 0.62±0.02 | 0.62±0.03 | 0.4 | 0.1 | |
| Placebo | 0.59±0.01 | 0.61±0.02 | 0.2 | |||
| Reactive hyperemic index** | GH | 2.2±0.1 | 2.4±0.1 | 0.3 | 0.6 | |
| Placebo | 2.1±0.1 | 2.0±0.2 | 0.9 | |||
p (0–6 months) determined by repeated measures analysis of variance
measured only at baseline and 6-month
Data are presented as mean±SEM. hsCRP: high sensitivity C reactive protein, HDL: high density lipoprotein, LDL: low density lipoprotein, tPA: tissue plasminogen activator, IMT: intima-media thickness
Conversion to SI units: hsCRP (mg/L) multiply by 9.524 for nmol/L, fibrinogen (mg/dL) mutiply by 0.0294 for μmol/L, triglycerides (mg/dL) multiply by 0.0113 for mmol/L, cholesterol (total, HDL, LDL) (mg/dL) multiply by 0.0259 for mmol/L
Figure 4.
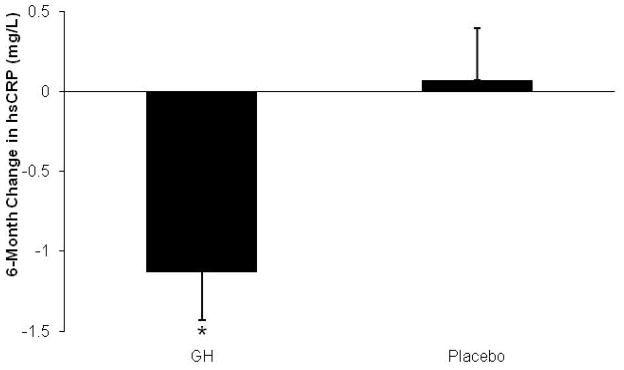
Mean (± SEM) change in hsCRP over 6 months of GH administration versus placebo. *, p< 0.05 vs. placebo. Conversion to SI units: hsCRP (mg/L) multiply by 9.524 for nmol/L
Apolipoprotein B and the apolipoprotein B/LDL ratio decreased in the GH group compared to placebo. tPA decreased in the GH group compared to placebo. There was a trend of a decrease in fibrinogen in the GH group compared to placebo. LDL and total cholesterol decreased within the GH group (p=0.02). There was no significant change in carotid IMT and RHI between the groups.
Effects of GH on glucose tolerance
Measures of glucose tolerance at baseline, 6 weeks and 6 months are summarized in Table 4. No subjects had fasting glucose levels ≥ 126 mg/dL (6.99 mmol/L) at any point during the study. Fasting glucose and 2-hour glucose levels increased in the GH group compared to placebo. Three subjects experienced increases in their fasting glucose levels from <100 mg/dL (5.55 mmol/L) to > 100 mg/dL at 6 months. All three subjects had been randomized to GH. Seven subjects experienced increases in their 2-hour glucose levels from <140 mg/dL (7.77 mmol/L) to >140 mg/dL at 6 months, five of whom had been randomized to receive GH and two of whom had been randomized to placebo. Baseline fasting glucose predicted 6-month change in 2-hour glucose within the GH group (r= 0.48, p= 0.01) (Figure 5), suggesting that subjects with higher fasting pre-treatment glucose were more likely to experience decreases in glucose tolerance with GH administration. Baseline fasting glucose correlated with 6-month fasting glucose (r= 0.68, p= 0.0001), and baseline 2-hour glucose correlated with 6-month 2-hour glucose (r= 0.66, p= 0.002). There was no association between GH dose or increase in IGF-1 levels and change in any measure of glucose tolerance. One subject was discontinued from the study at 3 months secondary to a 2-hour glucose greater than 200 mg/ml (11.1 mmol/L), a pre-specified drop criterion. Four subjects had 2-hour glucose levels greater than 200 mg/ml at six months, one of whom was receiving placebo.
Table 4.
Measures of glucose tolerance in premenopausal women with abdominal obesity treated with GH vs placebo for 6 months
| Variable | Treatment | Baseline (n=79) | 6 weeks (n=68) | 6 months (n=50) | p-within group | p-between groups* |
|---|---|---|---|---|---|---|
| GH: n=39 | GH: n=35 | GH: n=28 | ||||
| Placebo: n=40 | Placebo: n=33 | Placebo: n=22 | ||||
|
| ||||||
| Fasting glucose (mg/dL) | GH | 87.5±1.2 | 92.4±1.4 | 90.5±2.1 | 0.05 | 0.03 |
| Placebo | 85.7±1.2 | 87.2±1.4 | 84.9±1.4 | 0.9 | ||
| 2-hour glucose (mg/dL) | GH | 122.9±4.7 | 127.6 (5.8) | 140.6 (7.7) | 0.007 | 0.04 |
| Placebo | 118.9±4.7 | 111.4 (4.8) | 125.9 (7.7) | 0.9 | ||
| HOMA-IR | GH | 1.7±0.2 | 2.2±0.3 | 2.2±0.3 | 0.2 | 0.07 |
| Placebo | 1.6±0.2 | 1.8±0.3 | 1.5±0.8 | 0.3 | ||
p(0–6 months) determined by repeated measures analysis of variance
Data are presented as mean±SEM. HOMA-IR: Homeostasis model assessment-insulin resistance
Conversion to SI units: glucose (mg/L) multiply by 0.0555 for mmol/L
Figure 5.

Regression analysis of baseline fasting glucose on 6-month change in 2-hour glucose within the GH group. Baseline fasting glucose predicted 2-hour glucose after 6 months of GH administration. Conversion to SI units: glucose (mg/L) multiply by 0.0555 for mmol/L
Predictors of response within the group that received GH
Six-month change in IGF-1 levels was associated with 6-month decrease in TAT (r= −0.42, p=0.03) and VAT (r= −0.56, p=0.002) (Figure 6) which remained significant after controlling for baseline age and BMI (p= 0.002 and p=0.009, respectively), suggesting that those subjects experiencing the greatest increases in IGF-1 levels with GH administration, experienced the greatest decreases in total and visceral abdominal fat. There was a trend of an association between six-month increase in IGF-1 and 6-month decrease in hsCRP (r= −0.44, p=0.08). GH dose at 6 weeks correlated with the 6-week changes in TAT (r= −0.50, p=0.05), and SAT (r= −0.50, p=0.04). There were also trends toward significant associations between GH dose at 6 weeks and the 6-month change in thigh muscle area (r= 0.50, p=0.05), TAT (r= −0.40, p= 0.06), SAT (r= −0.30, p= 0.08), and VAT (r= −0.34, p=0.07). The GH dose at 6 months was inversely associated with the 6-month change in fibrinogen (r= −0.42, p= 0.03).
Figure 6.

Regression analysis of 6-month change in IGF-1 on 6-month change in visceral adipose tissue (VAT) within the GH group. 6-month change in IGF-1 predicted 6-month change in VAT.
Neither baseline or prior level of activity, baseline peak GH after stimulation with GHRH, nor baseline IGF-1 levels predicted 6-month change in body composition, cardiovascular risk markers, or glucose tolerance.
Compliance
Blood samples from 3-month and 6-month visits of subjects in the GH group who completed the 6-month visit demonstrated 22-kD hGH, indicating rhGH presence, in both blood samples in 13 cases (46%) and in either the 3-month or 6-month sample in 12 cases (43%), implying intermittent rhGH use, while in 3 cases (11%), no 22-kD hGH could be detected in either sample. For the subjects who dropped out between 6 weeks and 3 months (n=7), 22-kD hGH was detected in two cases (29%).
Side effects
There was no significant difference between the GH group and the placebo group in reported incidences of mild edema (GH-group, 53.6%, placebo, 45.5%; p=0.8), mild joint discomfort (GH-group 53.6%, placebo 31.8%; p=0.2), muscle aches (GH-group, 17.9%, placebo, 13.6%; p=1), nasal congestion (GH-group, 25.0%, placebo, 22.7%; p=1), back pain (GH-group, 10.7%, placebo, 22.7%; p=0.3), headache (GH-group, 35.7%, placebo, 36.4%; p=1) or intermittent mild hand paresthesias (GH-group, 50.0%, placebo, 22.7%; p=0.08). There was one serious unrelated adverse event: development of cancer in a study subject who was receiving placebo. No other serious related or unrelated adverse events occurred during this study
Discussion
This is the first study to demonstrate that GH treatment in abdominally obese premenopausal women exerts beneficial effects on body composition and markers of cardiovascular risk. Specifically, we show that GH treatment for 6 months, at doses that increased the mean IGF-1 approximately to the mean for age (mean IGF-1 SDS in the GH group = −0.1) decreases abdominal fat and increases muscle mass. In addition, it decreases hsCRP, tPA, apolipoprotein B, and apolipoprotein B/LDL ratio -- a measure of LDL atherogenecity. However, it is also associated with a small decrease in glucose tolerance in a subset of women, particularly those with higher pre-treatment fasting glucose levels.
Our study demonstrated a decrease in total abdominal and abdominal subcutaneous fat, and decrease in trunk fat with GH treatment in premenopausal women with visceral adiposity. VAT decreased compared with baseline in women randomized to receive GH, and an inverse association between the increase in IGF-1 level and decrease in VAT in women receiving GH suggests that the effect was dose-dependent. Importantly, we also observed an increase in muscle mass. As decreased GH secretion is an independent risk factor for increased abdominal obesity and cardiovascular risk (30, 31), we hypothesized that GH treatment would result in beneficial alterations in body composition and improvements in cardiovascular risk markers in women with visceral adiposity. These data suggest a beneficial GH-mediated modification in body composition in obese women of reproductive age.
GH is an important mediator of inflammation and a mediator of atherogenesis (4). In our 6-month, double-blind placebo-controlled trial, GH decreased CV risk markers including hsCRP, tPA, apolipoprotein B and apolipoprotein B/LDL ratio. The effects on hsCRP are consistent with demonstrated effects in hypopituitary men (8) and women (7). The effects on apolipoprotein B and the apolipoprotein B/LDL ratio suggest that GH results in increased size of LDL particles, which have been shown to be less atherogenic than smaller, denser LDLs. Within the GH group, there was also a decrease in total and LDL cholesterol. These findings are similar to the results of prior studies investigating the effects of GH in hypopituitary men and women (32) and in obese men and postmenopausal women (13–15). The significance of this is that alterations in body composition, including increased abdominal adiposity, are associated with a marked increase in coronary heart disease and elevation of inflammatory cardiovascular markers, including hsCRP, and classic cardiovascular risk markers, including LDL cholesterol and triglycerides (33). In addition, although GH administration has been clearly shown in men with hypopituitarism to reduce body fat, including VAT (7, 8, 12, 30), and to increase lean body mass (7, 12) and a recent randomized, placebo-controlled study demonstrated effectiveness in hypopituitary women (7), other studies have shown less efficacy in women (34). There are few studies in obese subjects, in whom endogenous GH is also reduced, and none in obese women of reproductive age, in whom the hormonal milieu significantly differs from that of other groups studied; our study is the first to isolate the effects of GH administration in women of reproductive age with obesity. A prior study administering GH to elderly women reported a significant decrease in abdominal SAT and no significant change in VAT (35), in contrast to a study that found a larger reduction in VAT compared to abdominal SAT in obese men following 12 months of low-dose GH administration (14). In contrast, Tomlinson et al (16) did not observe a reduction in fat mass assessed by DXA in a study of obese men and women following 8 months of low-dose GH administration, compared to placebo. Franco et al (13) reported decreased VAT, increased muscle area, and decreased liver fat using CT density measurements after 12 months of GH administration in postmenopausal women. We did not observe a significant decrease in intrahepatic fat measured by 1H-MRS in the GH group compared to placebo in our study of obese premenopausal women. Whether the differences in results from these studies reflect differences in study population, study duration, GH dosing, imaging technique or other factors is unknown.
Limitations of the study include evidence of noncompliance with GH administration; consistent rhGH administration was present in only 46%, while 42% manifested biochemical evidence of only intermittent GH administration.. This may explain the apparently high dose relative to the modest increase in mean IGF-1 levels within the normal range. More regular GH administration might have resulted in more significant findings. Another limitation was our high drop-out rate. However, of note, we replaced drop-outs to ensure our pre-specified n=50 completers at 6 months. Also, we followed the Institute of Medicine guideline for analysis of data with missing observations. There was no difference in baseline characteristics between the completers and drop-outs, and our drop-out rate was commensurate with other obesity studies (36, 37). Finally, it should be noted that this is a small, physiologic experiment, and clinical recommendations cannot be made based on the results.
In our study, GH administration decreased glucose tolerance in a minority of women. This suggests that relative GH deficiency in obesity may be an adaptive mechanism with regard to glucose tolerance. Whether the effects of GH administration observed in this study are clinically significant is debatable, as the absolute increases in glucose were small and few study subjects developed hyperglycemia with a 2-hour glucose level over 200 mg/dL (11.1 mmol/L). Of note, higher fasting glucose levels predicted greater 6-month increases in 2-hour glucose levels, suggesting that obese women with abnormal glucose tolerance may be more likely to experience this adverse effect. Acute GH administration increases insulin resistance in women with GH deficiency due to hypopituitarism, whereas chronic GH administration has been shown in some, but not all, studies to return measures of insulin resistance to normal or even result in improvements (32, 33, 38–40).. It is thought that the acute worsening of insulin resistance may be secondary to GH-induced adipocyte lipolysis and lipid turnover, resulting in increased plasma free fatty acids, and the long-term improvement in insulin resistance may be mediated in part by the GH-induced decrease in VAT and increase in muscle mass (41). It should also be noted that a recent paper confirmed the reversibility of acute GH-induced insulin resistance (42). For a detailed review on GH and glucose metabolism please see Ref (43) In our study, the increase in insulin resistance was accompanied by an increase in IMCL within the GH group. Krag et al. demonstrated an increase in IMCL using muscle biopsies, following 8 days of GH administration in healthy men (44). We have previously reported an inverse association between GH and IMCL using 1H-MRS, independent of VAT in women with visceral obesity (10), suggesting that low GH may contribute to insulin resistance through effects on IMCL. Our data do not support our hypothesis, generated from our cross-sectional data, that normalization of glucose tolerance with chronic GH treatment would be mediated by a reduction in IMCL and hepatic lipid concentrations. Further studies are warranted to investigate the mechanisms underlying the effects of GH on glucose tolerance.
We demonstrated that GH administration in viscerally obese premenopausal women results in beneficial effects on body composition and cardiovascular risk markers. However, it was also associated with a decrease in glucose tolerance in a minority of women, suggesting a possible adaptive effect of low endogenous GH with regard to glucose tolerance in premenopausal viscerally obese women. The net effect of GH on long-term cardiovascular risk in premenopausal women with abdominal adiposity is unknown.
Acknowledgments
We thank Gary Bradwin at Children’s Hospital Boston for assistance with laboratory assays. This work was supported in part by National Institutes of Health Grants RO1 HL-077674, UL1 RR025758, and K23 RR-23090. Study medication and placebo only were supplied by Genentech, Inc.
Footnotes
Clinical trials registration number: NCT00131378
Disclaimer: This is not the definitive version of record of this article. This manuscript has been accepted for publication in European Journal of Endocrinology, but the version presented here has not yet been copy edited, formatted or proofed. Consequently, the journal accepts no responsibility for any errors or omissions it may contain. The definitive version is now freely available at http://dx.doi.org/10.1530/EJE-11-1068 2012 European Society of Endocrinology;
Disclosure
The authors have no conflict of interest to declare.
References
- 1.Grundy SM. Obesity, metabolic syndrome, and coronary atherosclerosis. Circulation. 2002;105:2696–2698. doi: 10.1161/01.cir.0000020650.86137.84. [DOI] [PubMed] [Google Scholar]
- 2.Rexrode KM, Carey VJ, Hennekens CH, Walters EE, Colditz GA, Stampfer MJ, Willett WC, Manson JE. Abdominal adiposity and coronary heart disease in women. Jama. 1998;280:1843–1848. doi: 10.1001/jama.280.21.1843. [DOI] [PubMed] [Google Scholar]
- 3.Pijl H, Langendonk JG, Burggraaf J, Frolich M, Cohen AF, Veldhuis JD, Meinders AE. Altered neuroregulation of GH secretion in viscerally obese premenopausal women. J Clin Endocrinol Metab. 2001;86:5509–5515. doi: 10.1210/jcem.86.11.8061. [DOI] [PubMed] [Google Scholar]
- 4.Utz AL, Yamamoto A, Hemphill L, Miller KK. Growth hormone deficiency by growth hormone releasing hormone-arginine testing criteria predicts increased cardiovascular risk markers in normal young overweight and obese women. J Clin Endocrinol Metab. 2008;93:2507–2514. doi: 10.1210/jc.2008-0169. [DOI] [PMC free article] [PubMed] [Google Scholar]
- 5.Weaver JU, Monson JP, Noonan K, John WG, Edwards A, Evans KA, Cunningham J. The effect of low dose recombinant human growth hormone replacement on regional fat distribution, insulin sensitivity, and cardiovascular risk factors in hypopituitary adults. J Clin Endocrinol Metab. 1995;80:153–159. doi: 10.1210/jcem.80.1.7829604. [DOI] [PubMed] [Google Scholar]
- 6.Vahl N, Jorgensen JO, Skjaerbaek C, Veldhuis JD, Orskov H, Christiansen JS. Abdominal adiposity rather than age and sex predicts mass and regularity of GH secretion in healthy adults. Am J Physiol. 1997;272:E1108–1116. doi: 10.1152/ajpendo.1997.272.6.E1108. [DOI] [PubMed] [Google Scholar]
- 7.Beauregard C, Utz AL, Schaub AE, Nachtigall L, Biller BM, Miller KK, Klibanski A. Growth hormone decreases visceral fat and improves cardiovascular risk markers in women with hypopituitarism: a randomized, placebo-controlled study. J Clin Endocrinol Metab. 2008;93:2063–2071. doi: 10.1210/jc.2007-2371. [DOI] [PMC free article] [PubMed] [Google Scholar]
- 8.Sesmilo G, Biller BM, Llevadot J, Hayden D, Hanson G, Rifai N, Klibanski A. Effects of growth hormone administration on inflammatory and other cardiovascular risk markers in men with growth hormone deficiency. A randomized, controlled clinical trial. Ann Intern Med. 2000;133:111–122. doi: 10.7326/0003-4819-133-2-200007180-00010. [DOI] [PubMed] [Google Scholar]
- 9.Rudling M, Angelin B. Loss of resistance to dietary cholesterol in the rat after hypophysectomy: importance of the presence of growth hormone for hepatic low density lipoprotein-receptor expression. Proc Natl Acad Sci U S A. 1993;90:8851–8855. doi: 10.1073/pnas.90.19.8851. [DOI] [PMC free article] [PubMed] [Google Scholar]
- 10.Bredella MA, Torriani M, Thomas BJ, Ghomi RH, Brick DJ, Gerweck AV, Miller KK. Peak growth hormone-releasing hormone-arginine-stimulated growth hormone is inversely associated with intramyocellular and intrahepatic lipid content in premenopausal women with obesity. J Clin Endocrinol Metab. 2009;94:3995–4002. doi: 10.1210/jc.2009-0438. [DOI] [PMC free article] [PubMed] [Google Scholar]
- 11.Rommel C, Bodine SC, Clarke BA, Rossman R, Nunez L, Stitt TN, Yancopoulos GD, Glass DJ. Mediation of IGF-1-induced skeletal myotube hypertrophy by PI(3)K/Akt/mTOR and PI(3)K/Akt/GSK3 pathways. Nat Cell Biol. 2001;3:1009–1013. doi: 10.1038/ncb1101-1009. [DOI] [PubMed] [Google Scholar]
- 12.Baum HB, Biller BM, Finkelstein JS, Cannistraro KB, Oppenhein DS, Schoenfeld DA, Michel TH, Wittink H, Klibanski A. Effects of physiologic growth hormone therapy on bone density and body composition in patients with adult-onset growth hormone deficiency. A randomized, placebo-controlled trial. Ann Intern Med. 1996;125:883–890. doi: 10.7326/0003-4819-125-11-199612010-00003. [DOI] [PubMed] [Google Scholar]
- 13.Franco C, Brandberg J, Lonn L, Andersson B, Bengtsson BA, Johannsson G. Growth hormone treatment reduces abdominal visceral fat in postmenopausal women with abdominal obesity: a 12-month placebo-controlled trial. J Clin Endocrinol Metab. 2005;90:1466–1474. doi: 10.1210/jc.2004-1657. [DOI] [PubMed] [Google Scholar]
- 14.Johannsson G, Marin P, Lonn L, Ottosson M, Stenlof K, Bjorntorp P, Sjostrom L, Bengtsson BA. Growth hormone treatment of abdominally obese men reduces abdominal fat mass, improves glucose and lipoprotein metabolism, and reduces diastolic blood pressure. J Clin Endocrinol Metab. 1997;82:727–734. doi: 10.1210/jcem.82.3.3809. [DOI] [PubMed] [Google Scholar]
- 15.Pasarica M, Zachwieja JJ, Dejonge L, Redman S, Smith SR. Effect of growth hormone on body composition and visceral adiposity in middle-aged men with visceral obesity. J Clin Endocrinol Metab. 2007;92:4265–4270. doi: 10.1210/jc.2007-0786. [DOI] [PubMed] [Google Scholar]
- 16.Tomlinson JW, Crabtree N, Clark PM, Holder G, Toogood AA, Shackleton CH, Stewart PM. Low-dose growth hormone inhibits 11 beta-hydroxysteroid dehydrogenase type 1 but has no effect upon fat mass in patients with simple obesity. J Clin Endocrinol Metab. 2003;88:2113–2118. doi: 10.1210/jc.2002-021894. [DOI] [PubMed] [Google Scholar]
- 17.Han TS, van Leer EM, Seidell JC, Lean ME. Waist circumference action levels in the identification of cardiovascular risk factors: prevalence study in a random sample. Bmj. 1995;311:1401–1405. doi: 10.1136/bmj.311.7017.1401. [DOI] [PMC free article] [PubMed] [Google Scholar]
- 18.Lean ME, Han TS, Morrison CE. Waist circumference as a measure for indicating need for weight management. Bmj. 1995;311:158–161. doi: 10.1136/bmj.311.6998.158. [DOI] [PMC free article] [PubMed] [Google Scholar]
- 19.Bredella MA, Ghomi RH, Thomas BJ, Torriani M, Brick DJ, Gerweck AV, Misra M, Klibanski A, Miller KK. Comparison of DXA and CT in the assessment of body composition in premenopausal women with obesity and anorexia nervosa. Obesity (Silver Spring) 2010;18:2227–2233. doi: 10.1038/oby.2010.5. [DOI] [PMC free article] [PubMed] [Google Scholar]
- 20.Bredella MA, Hosseini Ghomi R, Thomas BJ, Miller KK, Torriani M. Comparison of 3.0 T Proton Magnetic Resonance Spectroscopy Short and Long Echo-Time Measures of Intramyocellular Lipids in Obese and Normal-Weight Women. Journal of Magnetic Resonance Imaging. 2010 doi: 10.1002/jmri.22226. [DOI] [PMC free article] [PubMed] [Google Scholar]
- 21.Bredella MA, Hosseini Ghomi R, Thomas BJ, Ouellette HA, Sahani DV, Miller KK, Torriani M. Breath-Hold 1H-Magnetic Resonance Spectroscopy for Intrahepatic Lipid Quantification at 3 Tesla. J Comput Assist Tomogr. 2010 doi: 10.1097/RCT.0b013e3181cefb89. [DOI] [PMC free article] [PubMed] [Google Scholar]
- 22.Bredella MA, Torriani M, Ghomi RH, Thomas BJ, Brick DJ, Gerweck AV, Rosen CJ, Klibanski A, Miller KK. Vertebral bone marrow fat is positively associated with visceral fat and inversely associated with IGF-1 in obese women. Obesity (Silver Spring) 2011;19:49–53. doi: 10.1038/oby.2010.106. [DOI] [PMC free article] [PubMed] [Google Scholar]
- 23.Bredella MA, Utz AL, Torriani M, Thomas B, Schoenfeld DA, Miller KK. Anthropometry, CT, and DXA as predictors of GH deficiency in premenopausal women: ROC curve analysis. J Appl Physiol. 2009;106:418–422. doi: 10.1152/japplphysiol.90998.2008. [DOI] [PMC free article] [PubMed] [Google Scholar]
- 24.Lukaski HC. Methods for the assessment of human body composition: traditional and new. Am J Clin Nutr. 1987;46:537–556. doi: 10.1093/ajcn/46.4.537. [DOI] [PubMed] [Google Scholar]
- 25.Cunningham JJ. Calculation of energy expenditure from indirect calorimetry: assessment of the Weir equation. Nutrition. 1990;6:222–223. [PubMed] [Google Scholar]
- 26.Miller KK, Wexler T, Fazeli P, Gunnell L, Graham GJ, Beauregard C, Hemphill L, Nachtigall L, Loeffler J, Swearingen B, Biller BM, Klibanski A. Growth hormone deficiency after treatment of acromegaly: a randomized, placebo-controlled study of growth hormone replacement. J Clin Endocrinol Metab. 95:567–577. doi: 10.1210/jc.2009-1611. [DOI] [PMC free article] [PubMed] [Google Scholar]
- 27.Hamburg NM, Keyes MJ, Larson MG, Vasan RS, Schnabel R, Pryde MM, Mitchell GF, Sheffy J, Vita JA, Benjamin EJ. Cross-sectional relations of digital vascular function to cardiovascular risk factors in the Framingham Heart Study. Circulation. 2008;117:2467–2474. doi: 10.1161/CIRCULATIONAHA.107.748574. [DOI] [PMC free article] [PubMed] [Google Scholar]
- 28.Wu Z, Bidlingmaier M, Dall R, Strasburger CJ. Detection of doping with human growth hormone. Lancet. 1999;353:895. doi: 10.1016/S0140-6736(99)00775-8. [DOI] [PubMed] [Google Scholar]
- 29.Bidlingmaier M, Suhr J, Ernst A, Wu Z, Keller A, Strasburger CJ, Bergmann A. High-sensitivity chemiluminescence immunoassays for detection of growth hormone doping in sports. Clin Chem. 2009;55:445–453. doi: 10.1373/clinchem.2008.112458. [DOI] [PubMed] [Google Scholar]
- 30.Bengtsson BA, Eden S, Lonn L, Kvist H, Stokland A, Lindstedt G, Bosaeus I, Tolli J, Sjostrom L, Isaksson OG. Treatment of adults with growth hormone (GH) deficiency with recombinant human GH. J Clin Endocrinol Metab. 1993;76:309–317. doi: 10.1210/jcem.76.2.8432773. [DOI] [PubMed] [Google Scholar]
- 31.Rosen T, Bengtsson BA. Premature mortality due to cardiovascular disease in hypopituitarism. Lancet. 1990;336:285–288. doi: 10.1016/0140-6736(90)91812-o. [DOI] [PubMed] [Google Scholar]
- 32.Maison P, Griffin S, Nicoue-Beglah M, Haddad N, Balkau B, Chanson P. Impact of growth hormone (GH) treatment on cardiovascular risk factors in GH-deficient adults: a Metaanalysis of Blinded, Randomized, Placebo-Controlled Trials. J Clin Endocrinol Metab. 2004;89:2192–2199. doi: 10.1210/jc.2003-030840. [DOI] [PubMed] [Google Scholar]
- 33.Despres JP, Lemieux I, Prud’homme D. Treatment of obesity: need to focus on high risk abdominally obese patients. Bmj. 2001;322:716–720. doi: 10.1136/bmj.322.7288.716. [DOI] [PMC free article] [PubMed] [Google Scholar]
- 34.Burman P, Johansson AG, Siegbahn A, Vessby B, Karlsson FA. Growth hormone (GH)-deficient men are more responsive to GH replacement therapy than women. J Clin Endocrinol Metab. 1997;82:550–555. doi: 10.1210/jcem.82.2.3776. [DOI] [PubMed] [Google Scholar]
- 35.Munzer T, Harman SM, Hees P, Shapiro E, Christmas C, Bellantoni MF, Stevens TE, O’Connor KG, Pabst KM, St Clair C, Sorkin JD, Blackman MR. Effects of GH and/or sex steroid administration on abdominal subcutaneous and visceral fat in healthy aged women and men. J Clin Endocrinol Metab. 2001;86:3604–3610. doi: 10.1210/jcem.86.8.7773. [DOI] [PubMed] [Google Scholar]
- 36.Fidler MC, Sanchez M, Raether B, Weissman NJ, Smith SR, Shanahan WR, Anderson CM. A one-year randomized trial of lorcaserin for weight loss in obese and overweight adults: the BLOSSOM trial. J Clin Endocrinol Metab. 2011;96:3067–3077. doi: 10.1210/jc.2011-1256. [DOI] [PubMed] [Google Scholar]
- 37.James WP, Caterson ID, Coutinho W, Finer N, Van Gaal LF, Maggioni AP, Torp-Pedersen C, Sharma AM, Shepherd GM, Rode RA, Renz CL. Effect of sibutramine on cardiovascular outcomes in overweight and obese subjects. N Engl J Med. 2010;363:905–917. doi: 10.1056/NEJMoa1003114. [DOI] [PubMed] [Google Scholar]
- 38.Fowelin J, Attvall S, Lager I, Bengtsson BA. Effects of treatment with recombinant human growth hormone on insulin sensitivity and glucose metabolism in adults with growth hormone deficiency. Metabolism. 1993;42:1443–1447. doi: 10.1016/0026-0495(93)90197-v. [DOI] [PubMed] [Google Scholar]
- 39.Svensson J, Fowelin J, Landin K, Bengtsson BA, Johansson JO. Effects of seven years of GH-replacement therapy on insulin sensitivity in GH-deficient adults. J Clin Endocrinol Metab. 2002;87:2121–2127. doi: 10.1210/jcem.87.5.8482. [DOI] [PubMed] [Google Scholar]
- 40.Hoffman AR, Kuntze JE, Baptista J, Baum HB, Baumann GP, Biller BM, Clark RV, Cook D, Inzucchi SE, Kleinberg D, Klibanski A, Phillips LS, Ridgway EC, Robbins RJ, Schlechte J, Sharma M, Thorner MO, Vance ML. Growth hormone (GH) replacement therapy in adult-onset gh deficiency: effects on body composition in men and women in a double-blind, randomized, placebo-controlled trial. J Clin Endocrinol Metab. 2004;89:2048–2056. doi: 10.1210/jc.2003-030346. [DOI] [PubMed] [Google Scholar]
- 41.Ho KK, O’Sullivan AJ, Hoffman DM. Metabolic actions of growth hormone in man. Endocr J. 1996;43(Suppl):S57–63. doi: 10.1507/endocrj.43.suppl_s57. [DOI] [PubMed] [Google Scholar]
- 42.Krusenstjerna-Hafstrom T, Clasen BF, Moller N, Jessen N, Pedersen SB, Christiansen JS, Jorgensen JO. Growth hormone (GH)-induced insulin resistance is rapidly reversible: an experimental study in GH-deficient adults. J Clin Endocrinol Metab. 96:2548–2557. doi: 10.1210/jc.2011-0273. [DOI] [PubMed] [Google Scholar]
- 43.Moller N, Jorgensen JO. Effects of growth hormone on glucose, lipid, and protein metabolism in human subjects. Endocr Rev. 2009;30:152–177. doi: 10.1210/er.2008-0027. [DOI] [PubMed] [Google Scholar]
- 44.Krag MB, Gormsen LC, Guo Z, Christiansen JS, Jensen MD, Nielsen S, Jorgensen JO. Growth hormone-induced insulin resistance is associated with increased intramyocellular triglyceride content but unaltered VLDL-triglyceride kinetics. Am J Physiol Endocrinol Metab. 2007;292:E920–927. doi: 10.1152/ajpendo.00374.2006. [DOI] [PubMed] [Google Scholar]