Abstract
Endothelial cell (EC) barrier dysfunction induced by inflammatory agonists is a frequent pathophysiologic event in multiple diseases. The platelet-derived phospholipid sphingosine-1 phosphate (S1P) reverses this dysfunction by potently enhancing the EC barrier through a process involving Rac GTPase-dependent cortical actin rearrangement as an integral step. In this study we explored the role of the ezrin, radixin, and moesin (ERM) family of actin-binding linker protein in modulating S1P-induced human pulmonary EC barrier enhancement. S1P induces ERM translocation to the EC periphery and promotes ERM phosphorylation on a critical threonine residue (Ezrin-567, Radixin-564, Moesin-558). This phosphorylation is dependent on activation of PKC isoforms and Rac1. The majority of ERM phosphorylation on these critical threonine residues after S1P occurs in moesin and ezrin. Baseline radixin phosphorylation is higher than in the other two ERM proteins but does not increase after S1P. S1P-induced moesin and ezrin threonine phosphorylation is not mediated by the barrier enhancing receptor S1PR1 because siRNA downregulation of S1PR1 fails to inhibit these phosphorylation events, while stimulation of EC with the S1PR1-specific agonist SEW2871 fails to induce these phosphorylation events. Silencing of either all ERM proteins or radixin alone (but not moesin alone) reduced S1P-induced Rac1 activation and phosphorylation of the downstream Rac1 effector PAK1. Radixin siRNA alone, or combined siRNA for all three ERM proteins, dramatically attenuates S1P-induced EC barrier enhancement (measured by transendothelial electrical resistance (TER), peripheral accumulation of diphospho-MLC, and cortical cytoskeletal rearrangement. In contrast, moesin depletion has the opposite effects on these parameters. Ezrin silencing partially attenuates S1P-induced EC barrier enhancement and cytoskeletal changes. Thus, despite structural similarities and reported functional redundancy, the ERM proteins differentially modulate S1P-induced alterations in lung EC cytoskeleton and permeability. These results suggest that ERM activation is an important regulatory event in EC barrier responses to S1P.
Keywords: ERM, Endothelial cells, Barrier function, Cytoskeleton, S1P, Rac1
1. Introduction
The pulmonary vascular endothelium serves as a semi-selective barrier between circulating blood and surrounding tissues and regulates many biological processes such as protein and fluid transport, inflammation and angiogenesis. Endothelial barrier dysfunction induced by inflammatory agonists is the direct underlying cause of vascular leak and pulmonary edema in sepsis and an essential component of angiogenesis, tumor metastasis, and atherosclerosis [reviewed in 1]. Therefore, the preservation of vascular endothelial cell (EC) barrier integrity has the potential for profound clinical impact. We have previously described potent EC barrier enhancement induced by the platelet-derived phospholipid sphingosine-1 phosphate (S1P), which involves Rac GTPase-dependent cortical actin rearrangement as an integral step [2]. There are five cognate G-protein-coupled receptors to which S1P specifically binds, designated S1PR1-5 [3]. Vascular EC primarily express S1PR1, S1PR2 and S1PR3 [4], which have a high degree of sequence homology. Importantly, these three receptors are differentially coupled to downstream signaling cascades that regulate Rho GTPases. S1PR1 couples exclusively to Gi and promotes Rac1 activation, while S1PR2 and S1PR3 couple to Gi, Gq, and G12/13 and activate RhoA [3, 5]. Stimulation of cells with S1P at the physiological range (0.1 to 1 μM) results in Rac1-dependent barrier protection by activation of SIPR1 [2], whereas exposure to higher concentrations (≥5 μM) mediates RhoA-dependent barrier disruption through S1PR3 ligation [6, 7]. Additionally, S1P stimulates the phospholipase C-dependent release of Ca2+ from ER stores via Gq, and activates ERK, p38 MAPK and PI3K via Gi [8, 9].
Previous studies have proposed a working model of EC barrier regulation in which the vascular barrier is regulated by a balance between competing EC contractile forces, which generate centripetaltension, and adhesive cell-cell and cell-matrix tethering forces, imposed by focal adhesion and adherens junctions (AJ), which together regulate cell shape change [1, 2, 10-13]. EC barrier enhancement induced by S1P and other barrier protective factors, such as oxidized phospholipids, human growth factor (HGF), ATP or simvastatin requires actomyosin remodeling, including formation of a prominent cortical actin rim, peripheral accumulation of phosphorylated regulatory myosin light chains (MLC), and disappearance of central stress fibers, which is regulated by Rac-dependent mechanisms [2, 14-17]. However, the downstream targets of these signaling pathways leading to the cytoskeletal changes remain incompletely defined.
The widely distributed ERM family of membrane-associated proteins (ezrin, radixin, moesin) regulates the structure and function of specific domains of the cell cortex [reviewed in 18]. The ERM proteins are actin-binding linkers that connect filamentous (F)-actin and the plasma membrane, either directly via binding to transmembrane proteins or indirectly via scaffolding proteins attached to transmembrane proteins. This linker function makes ERM proteins essential for many fundamental cellular processes including cell adhesion, determination of cell shape, motility, cytokinesis and integration of membrane transport with signaling pathways [18-21]. The three ERM proteins share a high level of amino acid identity (70-85%) (18), and prior to activation exist in an auto-inhibited conformation in which the actin-binding C-terminal tail binds and masks the N-terminal FERM domain (band 4.1, ezrin, radixin, moesin homology domains) [22]. The activation state of ERM proteins is tightly regulated by phosphorylation events. Binding of the protein to membrane lipid phosphatidylinositol 4,5-bisphosphate (PIP2) [23] and subsequent phosphorylation of a conserved C-terminal threonine (T567 in ezrin, T564 in radixin, T558 in moesin) [22, 24, 25] are believed to disrupt the intramolecular association, thus unmasking sites for interactions with other proteins. In addition, phosphorylation of ezrin on other residues may also be required to direct specific targeted effects in cells [26- 28]. Several kinases have been implicated in regulating ERM protein function through phosphorylation of the C-terminal threonine residue [20, 28- 39]. However, the identity of kinases that directly phosphorylate ERM in many cells remains to be clearly defined [18, 28].
ERM proteins also associate with cytoplasmic signaling molecules in cellular processes that require membrane cytoskeletal reorganization. ERM proteins appear to act both downstream and upstream of the Rho family of GTPases, which regulates remodeling of the actin cytoskeleton [18, 28]. However, information is limited concerning the possible role of ERM proteins in the remodeling of endothelial cytoskeleton in response to different agonists. Koss and coworkers [32] demonstrated that ERM proteins are phosphorylated on C-terminal threonine residues by TNF-α-induced signaling events and likely play important roles in modulating the cytoskeletal changes and permeability increases in human pulmonary microvascular EC.
In the present study, we explored the potential involvement of ERM proteins in the remodeling of the endothelial cytoskeleton that is essential to the S1P barrier-enhancing response. To study the involvement of ERM in EC barrier regulation, we applied several complementary approaches including immunoblotting, immunocytochemistry, transendothelial monolayer resistance (TER) measurements (a sensitive indicator of EC barrier function), and depletion of endogenous ERM proteins by small interfering RNA (siRNA) in cultured human pulmonary artery EC. Our results suggest that ERM proteins are phosphorylated on this critical C-terminal threonine residue by S1P-induced signaling events and, despite their structural similarities and reported functional redundancy, ERM proteins differentially modulate S1P-induced changes in lung EC cytoskeleton and permeability. These results advance our mechanistic understanding of EC barrier regulation and identify the ERM family as potential clinically important targets for therapeutic manipulation during high permeability processes.
2. Materials and methods
2.1. Reagents
S1P was obtained from Avanti Polar Lipids (Alabaster, AL). Antibodies (Ab) were obtained as follows: mouse monoclonal Ab against β-Tubulin (Covance, Berkeley, CA), rabbit polyclonal di-phospho-MLC and rabbit polyclonal phospho-Ezrin (Thr567)/Radixin (Thr564)/Moesin (Thr558) Ab, rabbit polyclonal phospho-PKCδ (Tyr311) Ab, rabbit polyclonal phospho-PKCθ (Thr538) Ab, rabbit polyclonal anti-p38 MAPK Ab (Cell Signaling, Danvers, MA), ezrin specific mouse monoclonal Ab, rabbit polyclonal phospho-PKCβI&II (Thr500) Ab (Invitrogen, Carlsbad, CA), rabbit monoclonal anti-radixin Ab (Sigma, St. Louis, MO), mouse monoclonal anti-moesin Ab, mouse monoclonal anti-PKCθ Ab (BD Biosciences, San Jose, CA), rabbit polyclonal phospho-PKCζ (Thr410) Ab (Bioworld, St. Louis Park, MN), mouse monoclonal anti-PKCβI Ab, rabbit polyclonal anti-PKCδ Ab, rabbit polyclonal anti-PKCζ Ab (Santa Cruz Biotechnology, Santa Cruz, CA), Texas red phalloidin and Alexa 488-, Alexa 594-conjugated secondary Ab (Molecular Probes, Eugene, OR). ROCK inhibitor Y-27632, PKC inhibitors Ro-31-7549, Bisindolylmaleimide I, and Go 6976, RAC1 inhibitor, and Rho, Rac, and Cdc42 inhibitor Toxin B were purchased from Calbiochem (San Diego, CA). S1PR inhibitors JTE-013 and CAY10444 were purchased from Cayman Chemical (Ann Arbor, MI). Unless specified, biochemical reagents were obtained from Sigma Co. (St. Louis, MO).
2.2. Cell culture
Human pulmonary artery endothelial cells (HPAEC) were obtained from Lonza Inc. (Allendale, NJ) and used at passages 5–9 as described elsewhere [40].
2.3. Measurement of transendothelial electrical resistance
Measurements of transendothelial electrical resistance (TER) across confluent EC monolayers were performed using an electrical cell-substrate impedance sensing system (ECIS; Applied Biophysics, Troy, NY) as previously described [2, 41, 42].
2.4. Depletion of specific EC proteins via siRNA
To reduce the content of individual EC proteins, cultured EC were treated with specific siRNA duplexes, which guide sequence-specific degradation of the homologous mRNA [43]. Validated siRNAs were ordered from QIAGEN (Valencia, CA) in ready-to-use, desalted, and duplexed form. Duplex of sense 5'-CACCGUGGGAUGCUCAAAGdTdT-3' and antisense 5'-CUUUGAGCAUCCCACGGU GdTdT-3' siRNA was used for targeting sequences that are part of the coding region for Homo sapiens ezrin: 5'-AACACCGTGGGATGCTCAAAG-3', duplex of sense 5’-GAAAUAACCCAGAGACUCUdTdT-3’ and antisense 5’-AGAGUCUCUGGGUUAUUUCdTdT-3’ was used for targeting sequences that are part of the coding region for Homo sapiens radixin: 5’-AAGAAATAACCCAGAGACTCT-3’, and duplex of sense 5’-GGGAUGUCAACUGACCUAAdTdT-3’ and antisense 5’-UUAGGUCAGUUGACAUCCCdTdG-3’ was used for targeting sequences that are part of the coding region for Homo sapiens moesin: 5’-CAGGGATGTCAACTGACCTAA-3’. Duplex of sense 5'-AGAGCUAAGUAGAUGUGUAdTdT-3' and antisense 5'-UACACAUCUACUUAGCUCUdTdG-3' siRNA was used for targeting sequences that are part of the coding region for Homo sapiens PKCβI: 5'-CAAGAGCTAAGTAGATGTGTA-3', duplex of sense 5’-GAAGCAUGACAGCAUUAAA dTdT-3’ and antisense 5’-UUUAAUGCUGUCAUGCUUCdCdG-3’ was used for targeting sequences that are part of the coding region for Homo sapiens PKCζ: 5’-CGGAAGCATGACAGCATTAAA-3’, duplex of sense 5’-CUCUACCGUGCCACGUUUUdTdT -3’ and antisense 5’-AAAACGUGGCACGGUAGAGdTdT-3’ was used for targeting sequences that are part of the coding region for Homo sapiens PKCδ: 5’-AACTCTACCGTGCCACGTTTT-3’, duplex of sense 5’-CAAGAAGUGUAUUGAUAAAdTdT-3’ and antisense 5’-UUUAUCAAUACACUUCUUGdTdG-3’ was used for targeting sequences that are part of the coding region for Homo sapiens PKCθ: 5’-CACAAGAAGTGTATTGATAAA-3’, and duplex of sense 5’-GAGAACUGCGGUUACUUAAdTdT-3’ and antisense 5’-UUAAGUAACCGCAGUUCUCdTdG-3’ was used for targeting sequences that are part of the coding region for Homo sapiens p38 MAPK: 5’-CAGAGAACTGCGGTTACTTAA-3’. Nonspecific, non-targeting AllStars siRNA duplex (QIAGEN, Valencia, CA) was used as negative control treatment. HPAEC were grown to 70% confluence, and the transfection of siRNA (final concentration 50 nM) was performed using DharmaFECT1 transfection reagent (Dharmacon Research, Lafayette, CO) according to manufacturer'sprotocol. Forty-eight hours post-transfection cells were harvested and used for experiments. Additional control experiments using EC transfections with fluorescently labeled nonspecific RNA showed that this protocol allowed us to achieve 90–100% transfection efficiency.
2.5. Determination of Rac GTPase activity
Rac activation assay was performed using a commercially available assay kit purchased from Upstate Biotechnology (Lake Placid, NY). EC grown in 100-mm dishes were transfected with indicated siRNA duplexes for 48h followed by treatment with S1P for indicated time periods in serum-free EBM-2. Cells were lysed in 500μl lysis buffer and homogenized by pipetting. After a brief centrifugation to remove the cell debris, supernatants were collected and GTP-bound Rac was captured using pull-down assays with immobilized human p21-binding PAK-1domain (residues 67-150)-PBD, according to the manufacturer's protocol. The agarose beads were washed with the lysis buffer (five times) and resuspended in 30 μl of 2×SDS gel loading buffer. The level of activated Rac as well as total Rac content were evaluated by Western blot analysis and quantified by scanning densitometry of autoradiography films. The level of activated Rac was normalized to Rac content in total cell lysates for densitometry evaluations.
2.6. Immunofluorescent staining
EC were plated on glass coverslips, grown to 70% confluence, and transfected with siRNA followed by stimulation with S1P. Then cells were fixed in 3.7% formaldehyde solution in PBS for 10 min at 4°C, washed three times with PBS, permeabilized with 0.2% Triton X-100 in PBS-Tween (PBST) for 30 min at room temperature, and blocked with 2% BSA in PBST for 30 min. Incubation with antibody of interest was performed in blocking solution for 1 h at room temperature followed by staining with either Alexa 488-, or Alexa 594-conjugated secondary Ab (Molecular Probes). Actin filaments were stained with Texas Red-conjugated phalloidin (Molecular Probes) for 1 h at room temperature. After immunostaining, the glass slides were analyzed using a Nikon video-imaging system (Nikon Instech Co., Japan) consisting of a phase contrast inverted microscope Nikon Eclipse TE2000 connected to Hamamatsu (Hamamatsu Photonics K.K., Japan) digital camera and image processor. The images were recorded and processed using Adobe Photoshop 6.0.
2.7. Immunoblotting
Protein extracts were separated by SDS-PAGE, transferred to nitrocellulose or polyvinylidene difluoride membranes (30 V for 18 h or 100 V for 1.5 h), and reacted with Ab that recognizes ezrin, moesin, radixin, or other Ab of interest as indicated for individual experiments. The level of phosphorylated ERM was examined by using a single Ab that recognizes any of the three ERM proteins only when they are phosphorylated on the threonine residue: ezrin (T567)/radixin (T564)/moesin (T558) (Cell Signaling). Immunoreactive proteins were detected with the enhanced chemiluminescent detection system (ECL) according to the manufacturer's directions (Amersham, Little Chalfont, UK). Intensities of immunoreactive protein bands were quantified using ImageQuant software (Molecular Dynamics, Sunnyvale, CA).
2.8. Coimmunoprecipitation assays
EC monolayers were stimulated with S1P (1 μM) or SEW2871 (10 μM) and after brief washing with PBS, cells were lysed with 500 μL of cell lysis buffer containing 20 mM Tris (pH 7.5), 150 mM NaCL, 1% NP-40, 2 mM EDTA, 0.2 mM EGTA, 0.2 mM sodium orthovanadate, 0.5% Protease inhibitor cocktail III (1:200), 0.5% Phosphatase inhibitor cocktail II. After clearing by centrifugation, lysates were then incubated with 2 μg of the appropriate Ab (anti-radixin, anti-ezrin or anti-moesin Ab) at 4°C for 1 h, followed by incubation with protein G Sepharose 4 Fast Flow (GE Healthcare, Piscataway, NJ) for 1 h. Protein G beads were collected by centrifugation, washed three times with the same buffer, resuspended in 80 μL of 2x SDS sample buffer, then boiled for 5 min. Protein extracts were subjected to SDS-PAGE, transferred to a nitrocellulose membrane, and probed with antibodies of interest. The relative intensities of immunoreactive protein bands were quantified by scanning densitometry using ImageQuant software.
3. RESULTS
3.1. S1P induces threonine phosphorylation of ERM via a PKC-mediated pathway
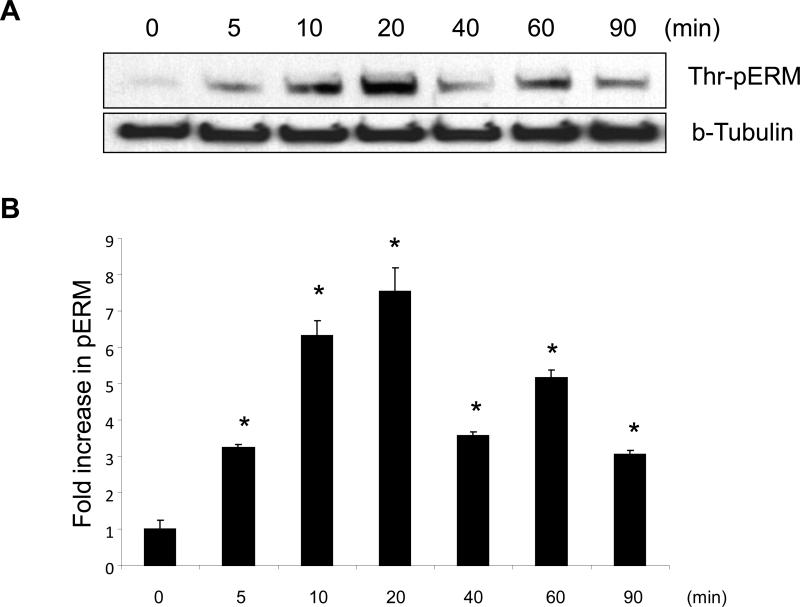
To explore the effect of S1P on the threonine phosphorylation of ERM at its critical regulatory site, confluent human pulmonary EC were stimulated with S1P (1 μM) and threonine phosphorylation evaluated by Western blot analysis utilizing phospho-specific ERM antibody (phospho-Ezrin Thr567/Radixin Thr564/Moesin Thr558). S1P challenge induced the sustained threonine phosphorylation of ERM, which reached maximum levels by 20 min and remained elevated for at least 90 min (Fig. 1).
Figure 1. Time-dependent effects of S1P on threonine phosphorylation of ERM.
(A) Confluent human pulmonary artery endothelial cells (HPAEC) were treated either with control vehicle or S1P (1 μM) for the indicated times, and phosphorylated ERM (phospho-Ezrin (Thr567)/Radixin (Thr564)/Moesin (Thr558)) was detected via immunoblot. (B) The bar graph represents relative densitometry. Data are presented as fold changes in phosphorylated ERM over vehicle-treated control and expressed as means ± S.E. from three independent experiments. *P < 0.05 vs. unstimulated control.
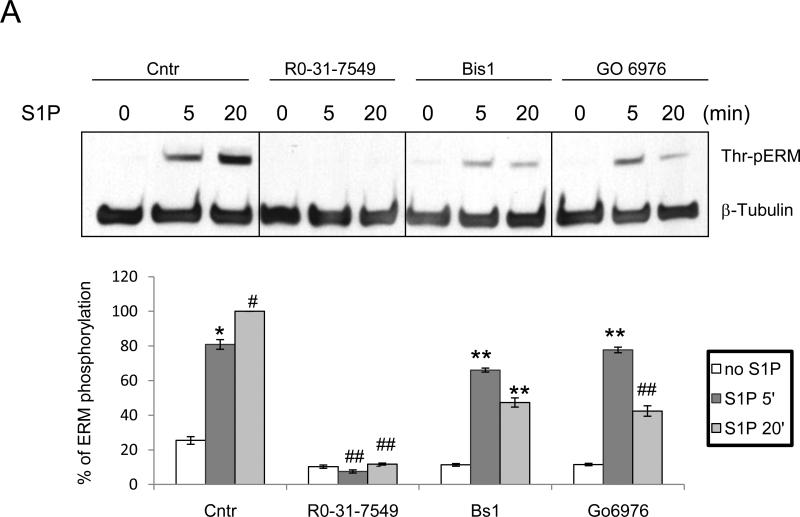
Several protein kinases (PKC, ROCK, GRK2, p38, NIK, MRCK, Mst4 and LOK) have been found to phosphorylate the regulatory C-terminal threonine residue of ERM proteins in various systems [20, 28-39]. The following experiments were performed to determine the signaling mechanisms leading to ERM phosphorylation in pulmonary EC upon S1P treatment. The role of PKC was examined first using three PKC-specific pharmacological inhibitors that have different IC50 values for different PKC isoforms, bisindolylmaleimide I (Bis I), Go 6976, and Ro-31-7549. Bis I, Ro-31-7549 and Go 6970 are all competitive inhibitors for the ATP-binding site of PKC [44, 45, 46]. Bis I inhibits the conventional PKC isoforms α, βI, βII and γ (activated by phosphatidylserine, diacylglycerol and Ca2+) with similar potency (IC50 = 10 nM) [44], and the unconventional isoforms δ and ε (require phosphatidylserine and diacylglycerol but are Ca2+-independent) and the atypical isoform ζ (require only phosphatidylserine), to a lesser extent [46]. In contrast to Bis I, Ro-31-7549 has slight selectivity for the α isoform (IC50 = 53 nM), but also affects βI, βII, e and γ [45]. Go 6970 inhibits Ca2+-dependent PKC isoforms α and βI (46). In our experiments, pretreatment with Ro-31-7549 completely prevented ERM phosphorylation inducedby S1P (Fig. 2A) while Bis I and Go 6976 partially prevented ERM phosphorylation (Fig. 2A).
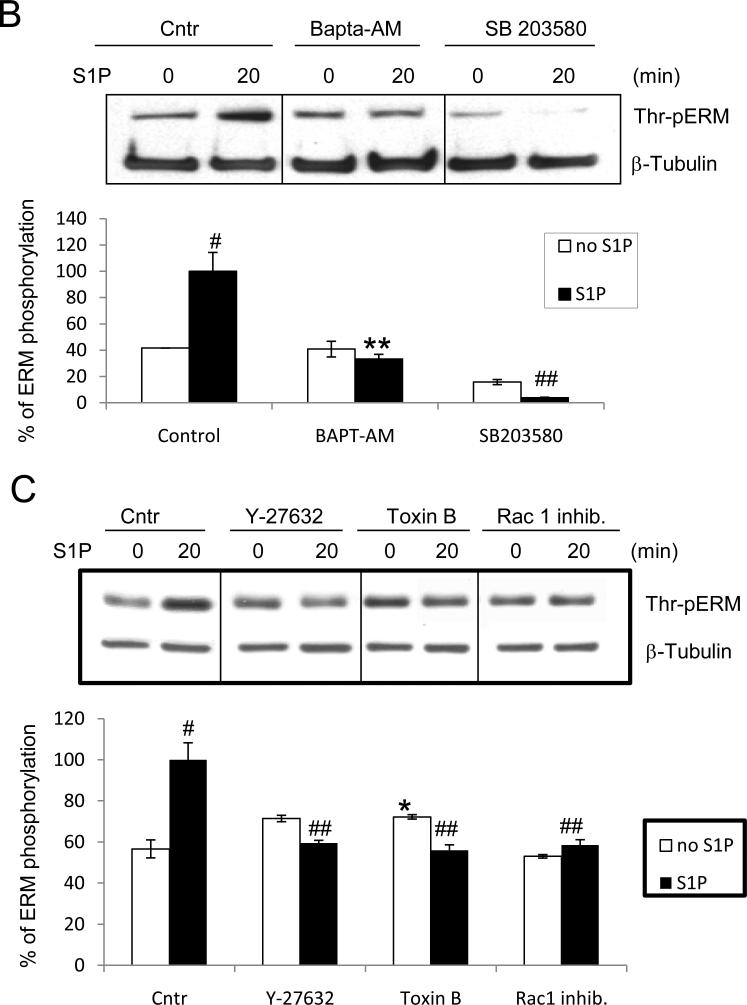
Figure 2. S1P-induced ERM phosphorylation requires activation of PKC, p38, Rho kinase, and Rac1.
HPAEC were pretreated with either control vehicle or the following inhibitors: PKC inhibitors Ro-31-7549 (10 μM, A) for 30 min, bisindolylmaleimide (BsI, 1 μM, A) for 30 min, Go6976 (1 μM, A) for 1 h, Ca(2+) chelator BAPTA-AM (25 μM, B) for 1 h, p38 inhibitor SB 203580 (20 μM, B) for 30 min, Rho kinase inhibitor Y-27632 (10 μM, C) for 1 h, Rho, Rac, and Cdc42 inhibitor Toxin B from Clostridium difficile (1 μM, C) for 1 h, Rac1 inhibitor (200 μM, C) for 30 min. EC were then stimulated with EBM-2 medium alone or S1P (1 μM) for the indicated time. Phosphorylation of ERM proteins was analyzed by immunoblotting of cell lysates with ERM phosphospecific Ab as in Fig. 1. β-tubulin Ab was used as a normalization control. Results of scanning densitometry of Western blots are shown as % of ERM phosphorylation relative to vehicle treated EC stimulated by S1P. Results are representative of 3-6 independent experiments. Values are means ± S.E. *, significantly different from cells treated with vehicle (p < 0.05); **, significantly different from cells stimulated with S1P (p < 0.05); #, significantly different from cells stimulated with vehicle (p < 0.01); ##, significantly different from cells stimulated with S1P (p < 0.01).
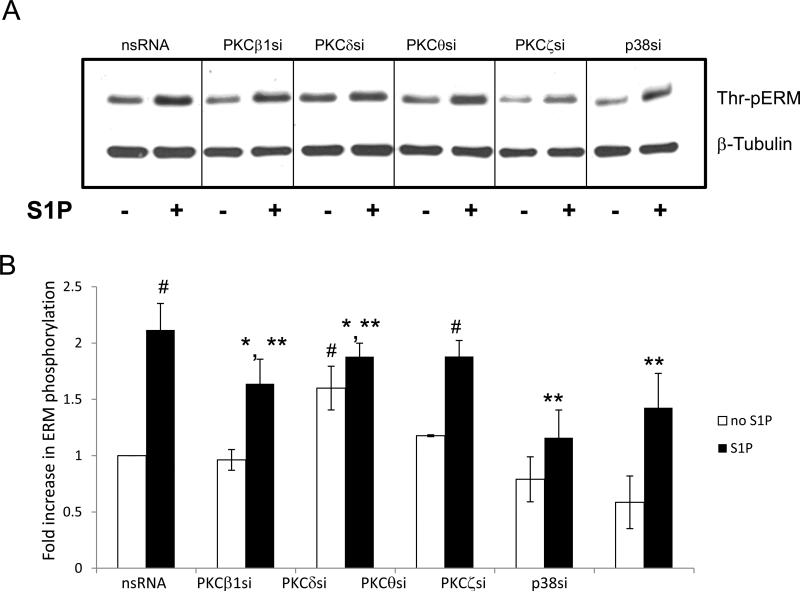
Pretreatment with BAPTA, a chelator of intracellular Ca2+, also partially inhibited ERM phosphorylation (Fig. 2B), which combined with pharmacological PKC inhibitor data suggest that multiple PKC isoforms (conventional, unconventional, atypical) may be required. An in silico MotifScan (http://scansite.mit.edu/) of human ezrin, radixin and moesin sequences to search for kinase candidate(s) identified four PKC isoforms (classical PKCα,β,γ and atypical PKCζ)(Table 1) as potential kinases for ezrin phosphorylation at threonine 567, radixin phosphorylation at threonine 564, and moesin phosphorylation at threonine 564. PKCα, PKCβ, and three other PKC isoforms not identified by MotifScan--unconventional PKC isoforms ν andθ, and atypical PKCι—have been previously shown to contribute to the phosphorylation of ERM proteins [20, 31-33]. To better characterize the PKC isoforms potentially involved in ERM phosphorylation after S1P, activation of individual PKC kinases was explored using isoform-specific phospho-antibodies. S1P stimulation (1 μM) of HPAEC significantly increased phosphorylation of PKCζ (Thr410) (Suppl. Fig. 3A), PKCθ (Thr538) (Suppl. Fig. 3B), PKCβ (Thr500) (Suppl. Fig. 3C), and PKCδ (Tyr311) (Suppl. Fig. 3D). These PKC isoforms were selected for further experimentation using isoform-specific siRNA. After validating that these siRNAs efficiently inhibit their respective targets (Suppl. Fig. 4), EC were transfected with siRNA for PKCβI, PKCζ, PKCθ or PKCδ and then stimulated with S1P to determine the effects on ERM threonine phosphorylation. Depletion of PKCζ expression significantly reduced ERM phosphorylation after S1P, while depletion of PKCβ1 or PKCδ resulted in a less robust but still statistically significant reduction in ERM phosphorylation (Fig. 3). Taken together, these data indicate that multiple PKC isoforms likely participate in S1P-induced ERM phosphorylation.
TABLE 1.
MotifScan results for ezrin T567, radixin T564, and moesin T557 sites
| Protein | PKC isoforma | Site | Scoreb | Percentilec |
|---|---|---|---|---|
| Ezrin | α, β, γ | T566 | 0.5410 | 3.449 |
| ζ | T566 | 0.5566 | 1.407 | |
| Radixin | α, β, γ | T564 | 0.5410 | 3.449 |
| ζ | T564 | 0.5185 | 0.619 | |
| Moesin | α, β, γ | T557 | 0.5410 | 3.449 |
| ζ | T557 | 0.5566 | 1.407 | |
Predicted Ser/Thr kinases for ezrin T567 phosphorylation site.
The scan scores start at 0.000 if the sequence optimally matches a given motif and the scores increase for sequences as they diverge from the optimal match. Lower scores in the output are thus better matches.
The percentile ranking of ezrin T567 phosphorylation site in respect to all potential motifs in vertebrate proteins in Swiss-Prot.
Figure 3. Depletion of PKC isoforms or p38 MAPK inhibits S1P-induced ERM phosphorylation.
(A) Confluent EC were incubated with non-specific, PKCβI-, PKCζ-, PKCθ-, PKCδ- or p38-specific siRNA as described in Methods, then stimulated by S1P (1μM, 20 min) or vehicle. Total lysates were analyzed by immunoblotting for phospho-ERM. Immunoblotting with β-tubulin Ab was used as a normalization control. (B) The bar graph represents relative densitometry of fold changes in phosphorylated ERM after S1P relative to vehicle-treated control. Results are means ± S.E. of four independent experiments. *, significantly different from cells treated with ns siRNA without S1P (p < 0.05); #, significantly different from cells treated with ns siRNA without S1P (p < 0.01). **, significantly different from cells treated with ns siRNA and S1P (p < 0.05).
We next explored whether additional signaling pathways previously reported to participate in ERM regulation are involved in S1P-induced ERM phosphorylation. Our results indicate that pharmacologic inhibition of p38 MAPK with SB203580 (Fig. 2B), or downregulation of p38 expression via siRNA (Fig. 3), significantly attenuated S1P-induced threonine phosphorylation of ERM relative to controls. In addition, preincubation of HPAEC with the Rho kinase inhibitor Y27632 significantly attenuated S1P-induced ERM phosphorylation (Fig. 2C), indicating a role for Rho GTPase in this response. Because phosphatidylinositol 4, 5-bisphosphate (PIP2) also modulates ERM phosphorylation (23), the role of PIP2 was examined by using Toxin B from Clostridium difficile, which inhibits Rho, Rac, and Cdc42 leading to a decrease in PIP2 synthesis by stimulating the production of phospholipase C. Since Rac1 regulates PIP2 production [47] and thereby possibly increases ERM activity, we also used the Rac1-specific inhibitor NSC23766, which inhibits Rac 1 GDP/GTP exchange activity by interfering with its interaction with the Rac 1-specific guanine nucleotide exchange factors, Trio and Tiam1. Pretreatment with either the Rac1 inhibitor or Toxin B significantly inhibited ERM phosphorylation after S1P (Fig. 2C). These data suggest that PIP2 is required for S1P-induced ERM phosphorylation and that Rac1 may be involved upstream of PIP2-induced ERM activation.
3.2. Effect of ERM silencing on Rac1 activation in EC stimulated by S1P
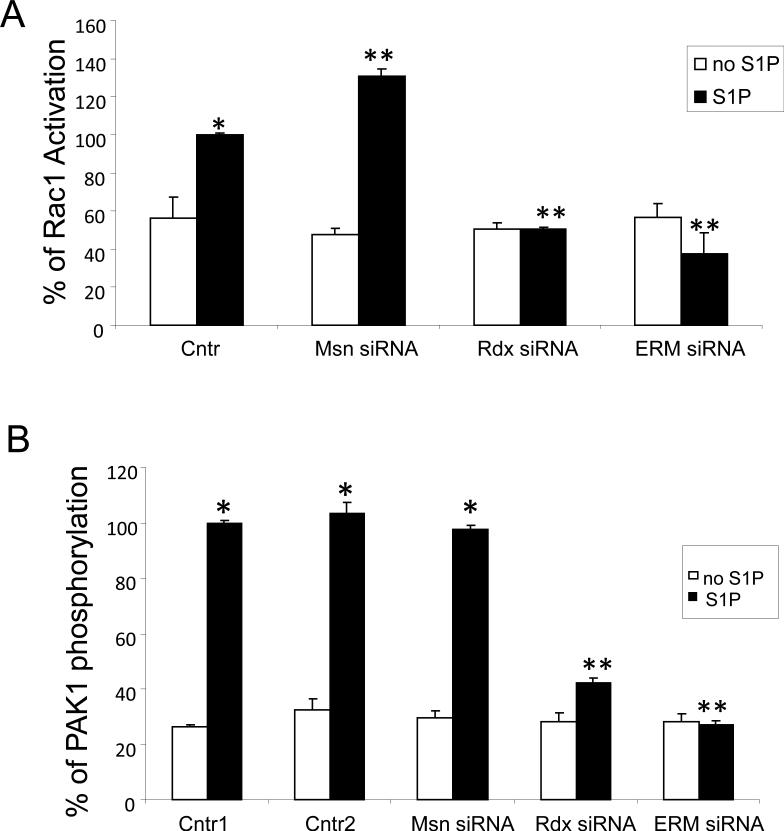
Among multiple signaling cascades activated in the pulmonary endothelium by S1P, the Rac/Cdc42-dependent pathway plays a critical role in the mediation of S1P-induced barrier enhancement [2, 48]. To test the hypothesis that ERM proteins may be involved in the positive-feedback loop of Rac activation in response to S1P, we studied the effects of ERM protein downregulation on Rac activation in response to S1P. The role of ERM was evaluated using siRNA targeting ezrin, radixin, or moesin. EC were treated with control nonspecific siRNA or the siRNA for ezrin, radixin, or moesin, either singly or in combination, and the protein expressions of ezrin, moesin, or radixin were examined. We first validated that these siRNAs efficiently and specifically inhibited their respective targets with little “off-target” downregulation of the other ERMs (Suppl. Fig. 1). Pulmonary EC were then transfected with nonspecificsiRNA, or siRNA for moesin, radixin, or siRNA for the combination of ezrin, radixin and moesin (pan-ERM), and then stimulated with S1P for measurement of Rac activation. In contrast to cells transfected with nonspecific RNA, depletion of radixin alone or downregulation of all three ERM proteins combined significantly reduced Rac activation in response to S1P (Fig. 4A). In contrast, moesin depletion slightly increased Rac activation. Consistent with these results, radixin and pan-ERM but not moesin-depleted ECs exhibited decreased Rac-dependent autophosphorylation of the downstream Rac target PAK1 (2) after S1P challenge (Fig. 4B). These results demonstrate that during EC barrier enhancement by S1P, Rac is not only an upstream regulator of ERM protein phosphorylation, but it may also serve as a downstream target for ERM-mediated signaling. Moreover, ERM proteins differentially modulate this Rac activity.
Figure 4. Effect of ERM on S1P-induced Rac1 activation and PAK1 phosphorylation.
EC were treated with transfection reagent (Cntr1, B) nonspecific siRNA (Cntr, A; Cntr2, B) or treated with moesin (MSN) siRNA, radixin (RDX) siRNA or ezrin, radixin, and moesin siRNAs (ERM) combined for 48 h. EC were serum-starved for 1 h and then stimulated with 1 μM S1P or vehicle control. In vitro Rac GTPase activation assay was performed as described in Methods. The immunoreactive bands from the representative experiments were quantitated using ImageQuant™ software. % Rac1 Activation on the y axis refers to the following: (densitometry of activated Rac1 band/densitometry of total Rac1 band) X 100 (A). Total lysates were analyzed by immunoblotting with anti-phospho-PAK1 (T423) Ab (B). Immunoblotting with β-tubulin Ab was used as a normalization control. Results are means ± S.E. of three independent experiments. *, significantly different from control cells without S1P (p < 0.05); **, significantly different from control cells stimulated with S1P (p < 0.05).
3.3. Role of ERM in S1P-induced lung EC barrier enhancement
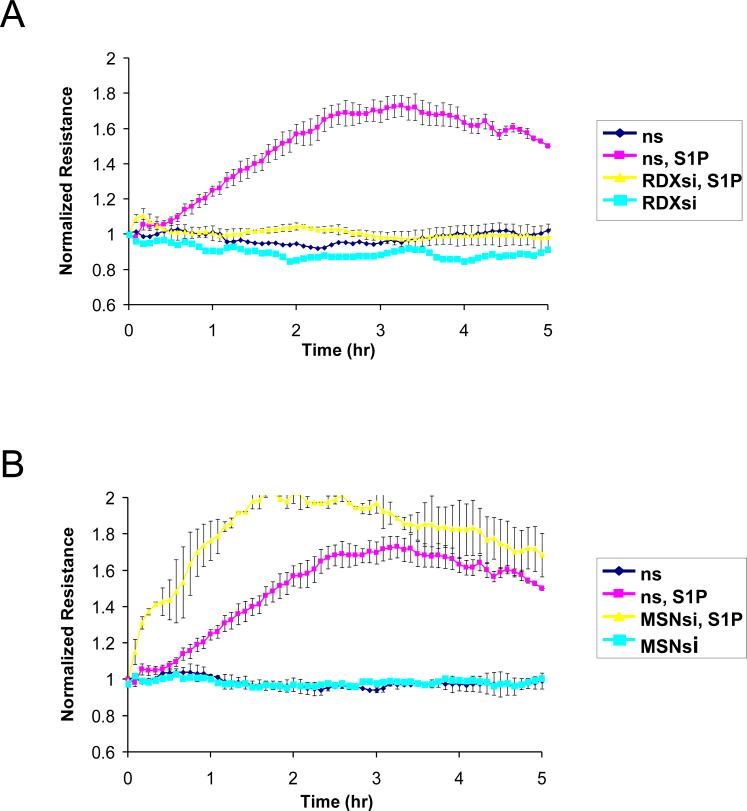
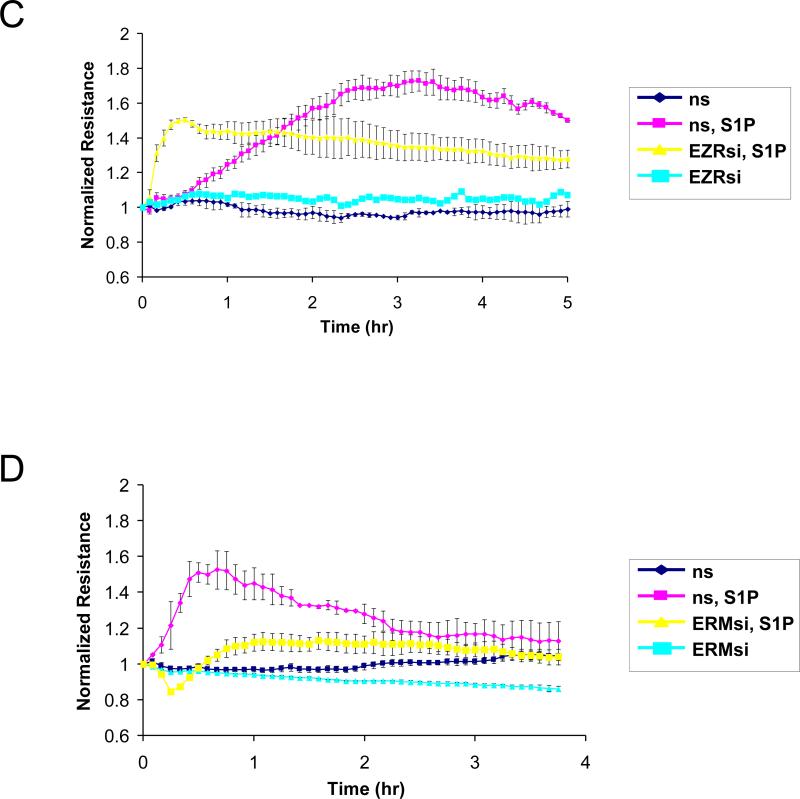
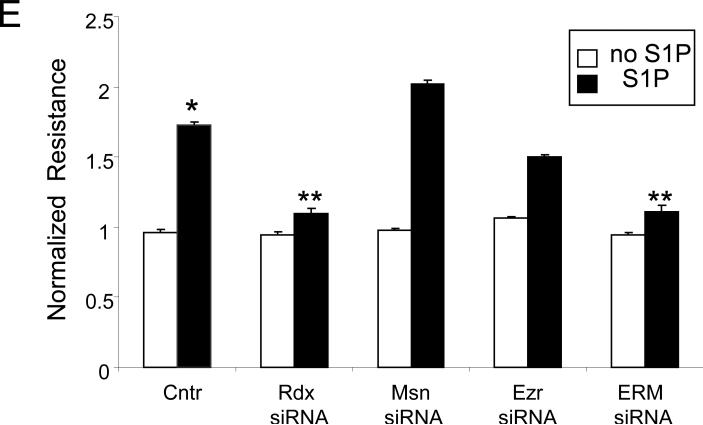
To evaluate the functional involvement of ERM proteins in S1P-induced EC barrier enhancement, we measured changes in TER, a highly sensitive in vitro assay of permeability, in lung EC treated with nonspecific siRNA or those treated with siRNA for ezrin, radixin, or moesin (either singly or in combination). Data expressed as normalized resistance (Fig. 5) demonstrate significant attenuation of S1P-induced TER increase in EC transfected with radixin or pan-ERM-specific siRNA compared with cells transfected with nonspecific RNA duplexes. S1P-induced TER elevation is only partially attenuated by siRNA depletion of ezrin. In contrast, depletion of moesin slightly enhances the TER increase after S1P (Fig. 5) compared with agonist-stimulated cells transfected with nonspecific RNA. These data clearly indicate novel differential roles for ERM proteins in mediating S1P-induced lung EC barrier enhancement.
Figure 5. Effect of ERM depletion on S1P-induced endothelial barrier enhancement.
EC grown in chambers on gold microelectrodes were transfected with siRNA for radixin (panel A), moesin (panel B), ezrin (panel C), combined siRNAs for ezrin, radixin, and moesin (panel D), or treated with nonspecific (ns) siRNA, as described in Methods and used for transendothelial electrical resistance (TER) measurements. At time = 0, cells were stimulated with S1P (1 μM) or vehicle control. Shown are pooled data of 5 independent experiments. The bar graph (E) depicts pooled TER data (n = 5) as maximal value of normalized TER elevation above base line achieved within 30 min ± S.E. *, significantly different from cells treated with ns siRNA reagent without S1P (p < 0.05); **, significantly different from control cells stimulated with S1P (p < 0.05).
3.4. Role of S1P receptors in S1P-induced ERM phosphorylation
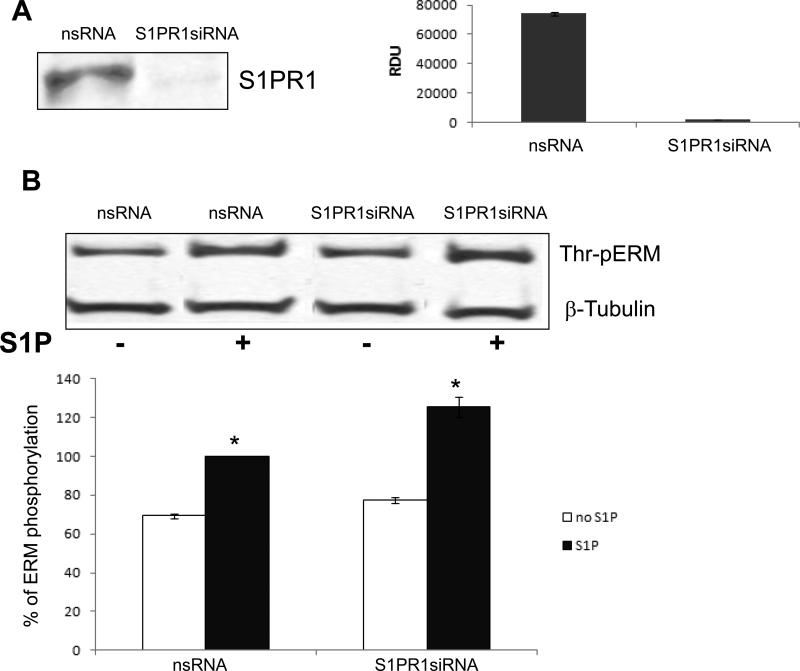
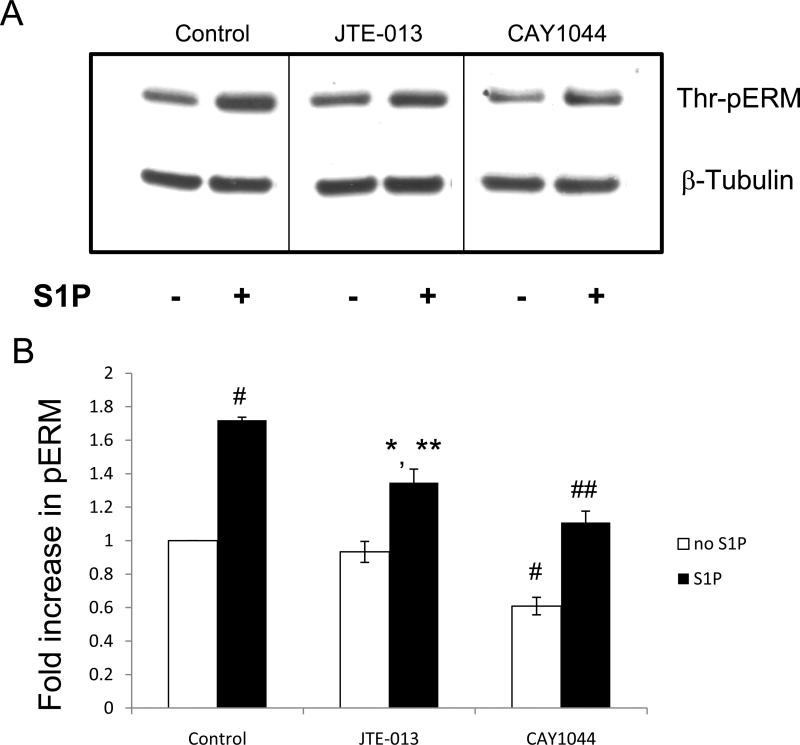
In human pulmonary EC, activation of S1PR1 receptor promotes Rac1 activation and triggers the endothelial barrier-protective response [2, 49]. We next used S1PR1-specific siRNA to determine the role of S1PR1 in S1P-induced threonine phosphorylation of ERM. Despite dramatic reduction in S1PR1 expression by this siRNA approach (Fig. 6A), S1PR1 depletion did not significantly attenuate S1P-induced ERM phosphorylation at the C-terminal threonine (Fig. 6B). In contrast, HPAEC preincubated with pharmacologic antagonists for S1PR2 (JTE-013) or S1PR3 (CAY10444) exhibited significantly decreased ERM phosphorylation after S1P relative to controls (Fig. 7). Overall, these data suggest that S1PR2 and/or S1PR3, but not S1PR1, are likely to participate in this phosphorylation response.
Figure 6. Effect of S1PR1 receptor depletion on S1P-induced ERM phosphorylation.
Confluent EC were incubated with non-specific or S1PR1 siRNA as described in Methods and then analyzed for S1PR1 expression by Western blotting (A). A representative Western blot and quantitative densitometry (n = 3) are shown. Similarly treated EC were stimulated by S1P (1μM, 20 min) or vehicle, and then total lysates were analyzed by immunoblotting for phospho-ERM (B). Immunoblotting with β-tubulin Ab was used as a normalization control. Results are means ± S.E. of three independent experiments. *, significantly different from control cells without S1P (p < 0.05).
Figure 7. Effect of S1PR2 or S1PR3 inhibition on S1P-induced ERM phosphorylation.
(A) Confluent EC were pretreated with either control vehicle, S1PR2 inhibitor JTE-013 (10 μM), or S1PR3 inhibitor CAY1044 (10 μM) for 30 min. Cells were then stimulated with EBM-2 medium alone or S1P (1 μM) for 20 min. Phosphorylation of ERM proteins was analyzed by immunoblotting of cell lysates with ERM phosphospecific Ab. Immunoblotting with β-tubulin Ab was used as a normalization control. (B) The bar graph represents relative densitometry of fold changes in phosphorylated ERM after S1P relative to vehicle-treated control. Values are means ± S.E. (n=4). *, significantly different from cells treated with EBM-2 (p < 0.05); #, significantly different from cells treated with EBM-2 (p < 0.01); **, significantly different from cells treated with S1P (p < 0.05); ##, significantly different from cells treated with S1P (p < 0.01).
3.5. Individual ERM proteins are phosphorylated differentially on threonine in S1P and SEW2871 stimulated EC
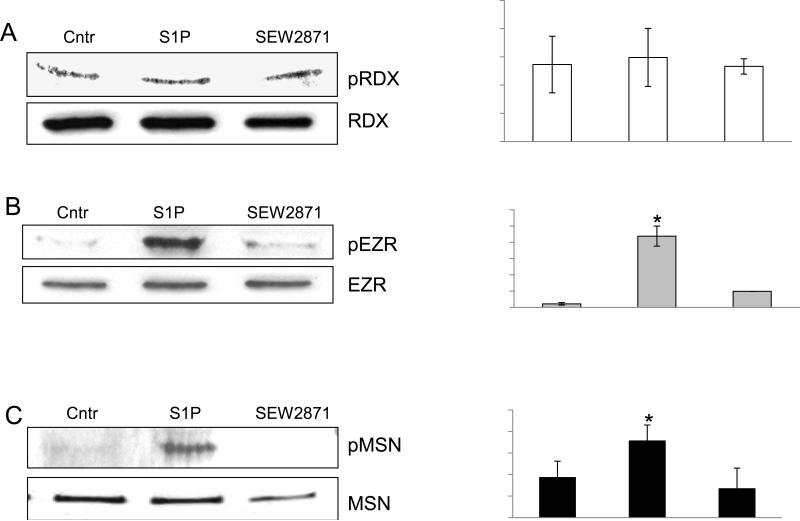
There are no antibodies currently available that specifically differentiate among the C-terminal phospho-threonines of individual ERM proteins. Therefore, we employed an indirect method for detection of individual ERM threonine phosphorylation in pulmonary EC. After stimulation with S1P or the S1PR1 specific agonist SEW2871, radixin, ezrin or moesin was individually immunoprecipitated under nondenaturing conditions, and threonine phosphorylation of each ERM protein then was determined by Western blot with phospho-specific ERM antibody. Interestingly, radixin, the ERM protein most important for EC barrier enhancement by S1P (Fig. 5), did not exhibit increased threonine phosphorylation at the regulatory C-terminal site after S1P or SEW2871 (Fig. 8A). In contrast, phosphorylation at this site was significantly increased in both ezrin and moesin by S1P, but not by the S1PR1 specific agonist SEW2871 (Fig. 8B-C). These data support those in Fig. 6 to further demonstrate that ERM protein phosphorylation after S1P is not mediated through S1PR1. Moreover, these results reveal a differential phosphorylation response by ERM proteins after S1P as the observed increase in ERM threonine phosphorylation at the critical regulatory site occurs primarily in ezrin and moesin, but not in the barrier-promoting radixin protein.
Figure 8. Individual ERMs are phosphorylated differentially on threonine in S1P and SEW2871 stimulated HPAEC.
EC were treated either with control vehicle , S1P (1 μM) or SEW2871 (10 μM) and after cell lysis, protein complexes were immunoprecipitated with radixin (A), ezrin (B) or moesin (C) antibodies, and the phosphorylated ERM was detected by Western blotting. Equal protein loading was confirmed by membrane reprobing with radixin (A), ezrin (B) or moesin (C) antibodies. Results of scanning densitometry of Western blots are shown as normalized values to radixin (A), ezrin (B) and moesin (C) and expressed as means ± S.E. from three independent experiments. *P < 0.05 vs. unstimulated control.
3.6. Involvement of ERM in S1P-induced EC cytoskeletal remodeling
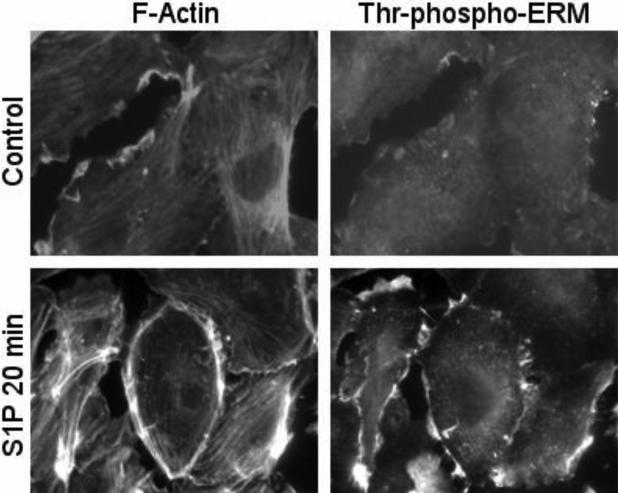
Increased EC barrier function is tightly associated with remodeling of the cell cytoskeleton and accompanied by actin rearrangement manifested by formation of a peripheral cortical actin ring and increased MLCK-catalyzed MLC phosphorylation, spatially localized in the cell periphery [2]. The distribution of phosphorylated ERM in EC before and after S1P treatment was examined. Before S1P treatment, minimal phosphorylated ERM proteins were observed in the cytoplasm as well as at the cell borders (Fig. 9). Stimulation with S1P induced an increase in the amount of phosphorylated ERM proteins, consistent with the immunoblotting studies (Fig. 1). The phosphorylated ERM proteins were localized primarily at the cell periphery along with cortical actin rings at 20 min (Fig. 9). The observation that phosphorylated ERM proteins were concentrated along EC edges upon S1P treatment led us to examine the role of these proteins in modulating endothelial cytoskeletal rearrangements that occur during S1P-induced barrier enhancement.
Figure 9. Distribution of phospho-ERM in EC after S1P.
EC grown on glass cover slips and treated with 1 μM S1P for 20 min (images at bottom) or non treated control cells (images at top) were subjected to double immunofluorescent staining with Texas red phalloidin to visualize F-actin (A) and anti-phospho-ERM Ab (B). Threonine-phosphorylated ERM proteins predominantly localized to the periphery of ECs following S1P stimulation (20 min). Images are representative of 3 independent experiments. Scale bar = 10 μm.
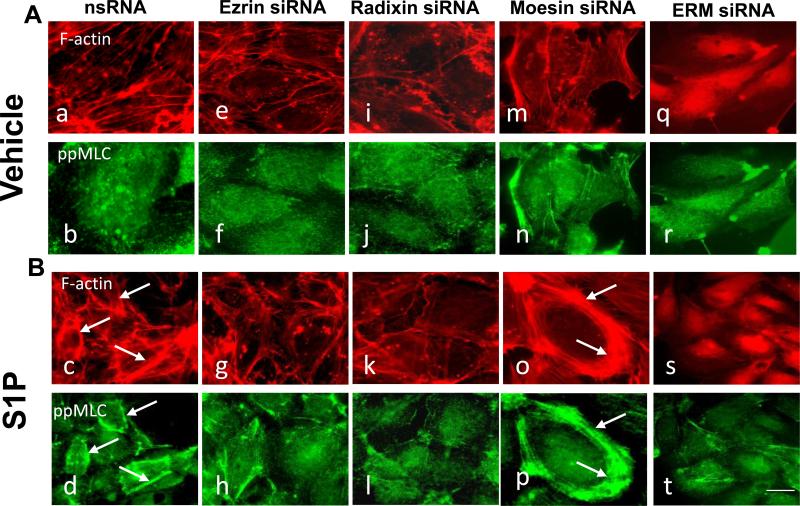
In the next series of experiments we analyzed the effect of ERM depletion on the human endothelial actin cytoskeleton. EC were transfected with nonspecific RNA duplex oligonucleotides (Fig. 10) or ERM-specific siRNA (Fig. 10, Suppl Fig. 2) followed by S1P challenge (20 min, 1 μM). Double immunofluorescent staining using Texas red phalloidin to visualize F-actin and di-phospho-MLC antibody to detect phosphorylated MLC was performed, as described in Methods. Unstimulated EC transfectedwith ezrin-, radixin-, or moesin--specific siRNAs, either individually or in combination showed no significant difference in the organization of actin cytoskeleton and levels of MLC phosphorylation compared with control EC exposed to nonspecific RNA. However, S1P stimulation of EC treated with nonspecific RNA induced robust cortical actin ring formation and accumulation of peripheral di-phospho-MLC, which was nearly abolished by the combination of siRNAs for radixin/ezrin/radixin, pan-ERM depletion, or by radixin or ezrin alone or their combination. In contrast, moesin depletion alone or double depletion of moesin and ezrin combined enhanced peripheral cortical ring formation and MLC phosphorylation (Fig. 10, Suppl Fig. 2).
Figure 10. Effects of ERM depletion on S1P-induced cytoskeletal remodeling.
EC grown on glass cover slips were incubated with siRNA to ezrin, radixin, moesin, or combination of siRNAs to all three proteins, or treated with non-specific siRNA duplex as described in Methods followed by S1P treatment (1μM, 20 min). ECs were subjected to double immunofluorescent staining with Texas Red phalloidin to visualize F-actin (panels A and B, upper images) and anti-pp-MLC Ab (Panels A and B, bottom images). Incubation with siRNA to radixin (k, l) and combined siRNAs to ezrin, radixin, and moesin (s, t) almost completely inhibits S1P-induced cortical actin ring formation and peripheral MLC phosphorylation compared with control (nsRNA) incubation (c, d, arrows). Incubation with siRNA to ezrin (g, h) partially attenuates S1P-induced cortical actin ring formation and peripheral MLC phosphorylation. In contrast, pretreatment with siRNA to moesin enhances S1P-stimulated cortical actin ring formation and peripheral MLC phosphorylation (o, p, arrows) compared with incubation with nsRNA. Bar = 10 μM. Images are representative of three independent experiments.
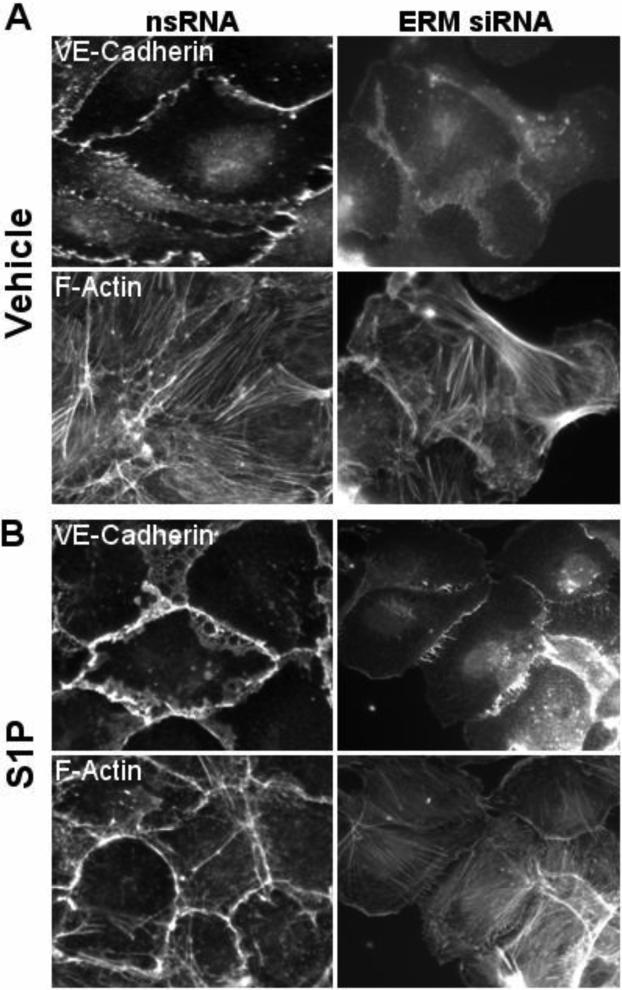
The role of ERM in modulating junctional complex formation after S1P was then examined by comparing the distribution of the key junctional protein VE-cadherin and F-actin in EC treated with control siRNA or pan-ERM siRNA. Before S1P treatment, the distribution of VE-cadherin and F-actinwas similar in EC treated with control or ERM siRNA (Fig. 11). S1P treatment for 20 min in control siRNA-treated EC caused F-actin reorganization that included cortical ring formation and VE-cadherin thickening and bundling along the EC periphery (Fig. 11). However, these changes were prevented in EC treated with pan-ERM siRNA, indicating that ERM proteins are required (Fig. 11). In addition, VE-cadherin appeared disjointed and less continuous at the EC borders and diffuse in the cytoplasm compartment of the EC (Fig. 11). These data together demonstrate that ERM proteins are downstream targets of S1P-induced signaling mechanisms and play an essential and differential role in the regulation of the endothelial actomyosin cytoskeleton.
Figure 11. Effect of ERM depletion on the distribution of the F-actin and VE-cadherin.
Quiescent HPAEC monolayers grown on glass cover slips were incubated with combination of siRNAs to ezrin, radixin, and moesin or treated with non-specific siRNA duplex as described in Methods followed by S1P treatment (1μM, 20 min). Cells were subjected to double immunofluorescent staining with Texas Red phalloidin to detect F-actin (panels A and B, bottom images) and anti-VE-cadherin Ab (Panels A and B, upper images). ERM silencing inhibits S1P-induced redistribution of F-actin and VE-cadherin to the cell periphery. Images are representative of three independent experiments.
4. Discussion
We and others previously have described potent EC barrier enhancement induced by the angiogenic sphingolipid S1P, which involves Rac GTPase-dependent cortical actin rearrangement as an integral step [2, 48, 50]. Although the ERM family of actin-binding proteins act both as linkers between the actin cytoskeleton and integral plasma membrane proteins as well as signal transducers for agonists that induce cytoskeletal remodeling [18], the role of ERM proteins in S1P barrier responses are unknown. Recent data indicate that S1P increases ERM phosphorylation at a critical regulatory threonine site [51]. We therefore explored whether the ERM family of proteins play a role in modulating the S1P-induced endothelial barrier protective response. Our data demonstrate S1P-induced ERM phosphorylation on a conserved threonine residue critical for ERM activation by conformational changes and strongly suggest important roles for the ERM proteins in mediating endothelial barrier enhancement by S1P. This phosphorylation requires S1P-induced signaling pathways that include activation of PKC isoforms, Rac1, Rho, and p38. S1P also produces translocation of phosphorylated ERM from the cytoplasm to EC periphery within the early stages of barrier enhancement (Fig. 9). Most importantly, our data demonstrate differential roles for the ERM proteins in this response, despite their structural similarities and reported functional redundancy (Figs. 4, 5, 8, 10). Radixin exerted a particularly prominent and essential role in the promotion of EC barrier function by S1P, while moesin appears to have opposing inhibitory effects (Fig. 5). This observation about moesin is consistent with recent reports describing its involvement in increased permeability induced by hypoxia in the blood-brain barrier [52] and advanced glycation end products (AGE) in human microvascular EC [53].
Prior data obtained using knockout mice lacking individual ERM proteins largely support the functional redundancy of the three ERM proteins, with defects observed when only one ERM protein was expressed [54-59]. However, the differential biological functioning of these proteins in S1P-mediated EC barrier responses may reflect important structural differences between these proteins. Moesin lacks a polyproline stretch present in the two other proteins that may be critical for certain protein-protein interactions [60]. Moreover, ezrin, but not moesin, is phosphorylated on tyrosine in EGF-challenged human A431 cells despite tyrosine 145 conservation in both proteins [61]. Ezrin is uniquely required for T cell activation [62] and radixin specifically mediates anchoring of the GABAA α5 subunit to the actin cytoskeleton which is dependent on radixin-phosphoinositide binding and activation. In contrast, ezrin and moesin do not appear to interact with this receptor [63]. In Jurkat T cells moesin and ezrin bind different proteins and have complementary, phosphorylation-regulated roles in formation of the immunological synapse [62].
The possibility exists that ezrin, radixin and moesin exert cooperative interactions to regulate the EC barrier, with radixin playing a key barrier-enhancing role. This is suggested by experiments in which depletion of all three ERM proteins produced TER decreases below basal level during the early stages of S1P treatment (Fig. 5). In contrast, radixin depletion leads to a slight increase in TER during early S1P–mediated increases in TER (5 to 10 min) (Fig. 5). Moreover, combined depletion of the ERM proteins results in more significant attenuation of S1P-induced Rac1 activation and activation of the Rac1 downstream target PAK1, compared with radixin knockdown alone (Fig. 4). The finding that moesin has some synergistic functional interaction with ezrin and radixin in mouse mammary tumor MTD-IA cell-cell and cell-substrate adhesion and microvilli formation also supports this possibility [64]. Conditional deletion of ezrin in murine T cells in combination with moesin silencing demonstrated that ezrin and moesin exhibit unique translocation and phosphorylation patterns in response to T cell antigen receptor (TCR) engagement and function synergistically to promote T cell activation [65].
Recent reviews have summarized the current knowledge about ERM proteins as controllers of signaling molecules and of the cortical cytoskeleton, with the Rho family GTPases and PKC isoforms implicated in regulating ERM function through phosphoinositides and phosphorylation of the C-terminal threonine residue [18, 28, 66]. Binding of the ERM proteins to membrane lipid PIP2 and subsequent phosphorylation of a conserved C-terminal threonine are thought to unfold inactive monomers, thus unmasking sites involved in interaction with other proteins [18, 28, 66]. Rac can induce localized production of PIP2 [47] through formation of complexes with a type I phosphatidylinositol-4-phosphate 5-kinase and diacylglycerol kinase that can synthesize phosphatidic acid and activate PIP2 production [67, 68]. Our data indicate that Rac1 may be upstream of ERM activation after S1P, possibly through regulation of PIP2 production. In addition to binding to ERM proteins, PIP2 may also modulate PKC signaling pathways leading to ERM phosphorylation. Activated by G-proteins, phospholipase C cleaves PIP2 into inositol-1,4,5-triphosphate and 1,2-diacylglycerol (DAG). Activation of classical (α, β, γ) and unconventional PKC isoforms (δ, ε, ν and θ) requires DAG. Thus, elevation of PIP2 production may be required for the activation of PKC isoforms, one of the upstream regulators for ERM phosphorylation.
Several protein kinases have been reported to phosphorylate the C-terminal threonine residue of ERM proteins. Examples include PKCα [19, 28], PKCβ, θ and ν [31, 32], PKCι [33], LOK [29], Rho kinases/ROCK [34, 35], GRK2 [36], NIK [37], MRCK [38], p38 [32] and Mst4 [39]. Prior work indicates that S1P signals through S1P1 receptor and heterotrimeric protein Gi to activate PKCδ, ε and ζ isoforms in HPAEC and that PKCζ regulates S1P-induced Rac activation [69]. In human pulmonary EC, our data now indicate that PKC isoforms ζ, β, and δ participate in S1P-induced ERM phosphorylation at the C-terminal threonine site (Fig. 3).
S1PR1, S1PR2 and S1PR3 differentially participate in vascular EC barrier regulation by S1P. They are coupled to different G proteins and therefore stimulate different downstream pathways leading to either increased (S1PR1) or decreased (S1PR2, S1PR3) barrier function. S1P induced enhancement of EC barrier function by activation of S1P1 receptor has been demonstrated in vivo and in vitro [6, 7, 70], while in contrast S1PR2 and S1PR3 activation results in RhoA-mediated barrier disruption [6, 7, 70]. Interestingly, our data indicate that the barrier enhancing S1P1 receptor is not involved in the increased ERM phosphorylation observed after S1P (Figs. 6, 8). Moreover, the S1P-induced increase in ERM phosphorylation at the critical threonine regulatory site occurs almost exclusively in moesin and ezrin (Fig. 8), while the barrier enhancing radixin protein exhibits no change in its phosphorylation status. Our data indicate that S1P primarily induces moesin and ezrin threonine phosphorylation in pulmonary EC through activation of S1PR2 and/or S1PR3 (Fig. 7), suggesting the possibility that this phosphorylation event is not functionally required for barrier enhancement after S1P. Because radixin does not exhibit increased regulatory threonine phosphorylation after S1P in these cells, the mechanism by which it participates in improving barrier function remains unclear. One hypothesis is that the pool of threonine-phosphorylated radixin that exists in unstimulated cells (Fig. 8) may be activated by the accumulation of PIP2 after S1P stimulation, leading to translocation of activated radixin to the plasma membrane to participate in cytoskeletal rearrangements that result in barrier enhancement. Support for this hypothesis is provided by the recent report in Drosophila cells that PIP2 binding alone can recruit moesin to the cell membrane independent of its phosphorylation [71]. Another possibility is that phosphorylation of radixin at sites other then C-terminal threonine may result in activation. For example, several additional sites have been reported for ezrin (threonine 235, tyrosines 145 and 353) [72, 73], but the functional roles of phosphorylation at these sites are still unclear.
An important feature of ERM proteins is their ability to act both upstream and downstream of Rho GTPases (reviewed in 11, 21), which suggests the existence of a positive feedback loop between these two types of proteins. Our data support the findings that ERM proteins function both upstream and downstream of the Rac pathway after S1P in EC (Figs. 2C, 4), which stimulates the peripheral actin rearrangements that mediate S1P-induced barrier enhancement [2, 49]. Our experiments demonstrate that knockdown of either radixin or all ERM proteins significantly reduces Rac activation and activation of the Rac downstream target PAK1 (Fig. 4), which is a principal mediator of Rac-dependent signaling to the cytoskeleton. These findings are consistent with prior work that overexpression of either the C-terminal domain of radixin or ezrin T567D, in which an aspartic acid mimics the constitutive threonine phosphorylation of the C-terminus, induced Rac1 activation in NIH 3T3 fibroblasts and in Madin-Darby canine kidney cells correspondingly [74, 75]. In addition, overexpression of the ezrin T576D resulted in increased membrane ruffling and lamellipodia [25]. The specific mechanism by which the ERM proteins activate Rac1 remains unknown. The Rho GDP dissociation inhibitor (RhoGDI) and ERM proteins directly interact [76] and may displace RhoGDI from Rac1, allowing Rac1 to bind GTP and be subsequently activated. ERM proteins may be involved in RhoGDI displacement from Rac-GTP in S1P-induced EC barrier regulation. Another possibility is that ERM may regulate Rac-specific guanine nucleotide exchange factors (GEFs) such as Tiam1 and PAK-interacting exchange factor (βPIX), which are known to be involved in Rac activation after S1P [77] and focal adhesion structure, respectively [78]. An analogous example is provided by the C-terminal threonine-phosphorylated form of ezrin that associates with the Cdc42/Rho specific GEF Dbl and causes Rho activation [79]. It is possible that interaction between ERM proteins, Tiam and/or βPIX is involved in the activation of S1P-induced Rac/Cdc42-dependent signaling, a hypothesis currently being evaluated.
5. Conclusions
S1P-induced barrier protective effects on the pulmonary endothelium have been associated with remodeling of the actin cytoskeleton, focal adhesion rearrangement and the increased interaction between adherens junction (AJ) proteins α/β-catenin and VE-cadherin [6, 48, 81-83]. ERM proteins may modulate such intermediate signaling events for cytoskeletal changes and barrier enhancement as Rac/Cdc42-dependent signaling, focal adhesions and AJ. Our data demonstrate that depletion of either radixin alone, or of all three ERM proteins, attenuates S1P-induced Rac activation, cortical cytoskeleton rearrangement, increase in TER, and VE-cadherin peripheral redistribution. Thus, despite their structural similarities and reported functional redundancy, the ERM proteins differentially modulate S1P-induced changes in lung EC cytoskeleton and permeability. These results advance our mechanistic understanding of EC barrier regulation and identify the ERM family as potential targets for therapeutic manipulation in this clinically important physiologic process.
Supplementary Material
Supplemental Figure 1. Specificities of individual ERM siRNAs. Ezrin, radixin, and moesin depletion was induced by specific siRNA duplexes and assessed for cross silencing effects by immunoblotting with appropriate Ab, as compared with treatment with nonspecific (ns) siRNA. Immunoblotting with β-tubulin Ab was used as a normalization control. Quantitative analysis of protein expression was performed by scanning densitometry of the membranes and expressed in relative density units (RDU). Results are means ± S.E. for three independent experiments. *, significant difference (p < 0.05) when compare with cells treated with ns siRNA.
Supplemental Figure 2. Effects of ezrin, radixin, and moesin depletion on S1P-induced cytoskeletal remodeling. EC grown on glass cover slips were incubated with combinations of siRNAs to ezrin, radixin, and moesin or treated with non-specific siRNA duplex as described in Methods followed by S1P treatment (1μM, 20 min). ECs were subjected to double immunofluorescent staining with Texas Red phalloidin to visualize F-actin (panels A and B, upper images) and anti-pp-MLC Ab (Panels A and B, bottom images). Incubation with combined siRNAs to ezrin and radixin (g, h) inhibits S1P-induced cortical actin ring formation and peripheral MLC phosphorylation compared with control (nsRNA) incubation (c, d, arrows). In contrast, combination siRNA to ezrin and moesin enhances S1P-stimulated cortical actin ring formation and peripheral MLC phosphorylation (o, p arrows) compared with incubation with nsRNA. Bar = 10 μM. Results are representative of three independent experiments.
Supplemental Figure 3. Effects of S1P on phosphorylation of PKC isoforms in HPAEC. Confluent HPAEC were treated either with control vehicle or S1P (1 μM) for the indicated times, and phosphorylated PKCζ (A), PKCθ (B), PKCβ (C), and PKCδ (D) were detected via immunoblot. Bar graphs represent relative densitometry of fold changes in phosphorylated PKC isoforms after S1P relative to vehicle-treated control and expressed as means ± S.E. from three independent experiments. *, significantly different from cells treated with EBM-2 (p < 0.05); #, significantly different from cells treated with EBM-2 (p < 0.01).
Supplemental Figure 4. Depletion of PKC isoforms and p38 MAPK by siRNA. PKCβ (A), PKCδ (B), PKCθ (C), PKCζ (D), and p38 MAPK (E) depletion were induced by specific siRNA duplexes and assessed for silencing effects by immunoblotting with appropriate Ab, as compared with treatment with nonspecific (ns) siRNA. Immunoblotting with β-actin Ab was used as a normalization control. Quantitative analysis of protein expression was performed by scanning densitometry and expressed in relative density units (RDU). Results are means ± S.E. for three independent experiments. #, significant difference (p < 0.01) when compared with cells treated with ns siRNA.
Highlights.
Ezrin/radixin/moesin (ERM) proteins mediate endothelial barrier enhancement by S1P.
S1P stimulates ERM phosphorylation on a regulatory threonine residue.
This phosphorylation is dependent on several PKC isoforms, p38, and Rac.
ERM proteins differentially regulate endothelial cytoskeletal structure after S1P.
Radixin promotes S1P barrier effects while moesin inhibits them.
Acknowledgments
This work was supported by grants from the National Institutes of Health (NIH) Heart Lung Blood Institute (NHLBI) [Garcia, HL058064; Dudek, HL088144].
Abbreviations
- ERM
ezrin, radixin, and moesin proteins
- Rac1
Rac1 GTPase
- PKC
protein kinase C
- PAK1
p21/Cdc42/Rac1-activated kinase 1
- S1P
sphingosine-1 phosphate
Footnotes
Publisher's Disclaimer: This is a PDF file of an unedited manuscript that has been accepted for publication. As a service to our customers we are providing this early version of the manuscript. The manuscript will undergo copyediting, typesetting, and review of the resulting proof before it is published in its final citable form. Please note that during the production process errors may be discovered which could affect the content, and all legal disclaimers that apply to the journal pertain.
References
- 1.Dudek SM, Garcia JG. J.Appl. Physiol. 2001;91:1487–1500. doi: 10.1152/jappl.2001.91.4.1487. [DOI] [PubMed] [Google Scholar]
- 2.Garcia JGN, Liu F, Verin AD, Birukova A, Dechert MA, Gerthoffer WT, Bamburg JR, English D. J.Clin. Invest. 2001;108:689–701. doi: 10.1172/JCI12450. [DOI] [PMC free article] [PubMed] [Google Scholar]
- 3.Rivera R, Chun J. Rev. Physiol. Biochem. Pharmacol. 2008;160:25–46. doi: 10.1007/112_0507. [DOI] [PubMed] [Google Scholar]
- 4.Rosen H, Gonzalez-Cabrera PJ, Sanna MG, Brown S. Annu. Rev. Biochem. 2009;78:743–68. doi: 10.1146/annurev.biochem.78.072407.103733. [DOI] [PubMed] [Google Scholar]
- 5.Hannun YA, Obeid LM. Nat. Rev. Mol. Cell. Biol. 2008;9:139–150. doi: 10.1038/nrm2329. [DOI] [PubMed] [Google Scholar]
- 6.Komarova YA, Mehta D, Malik AB. Sci. STKE. 2007;2007:re8. doi: 10.1126/stke.4122007re8. [DOI] [PubMed] [Google Scholar]
- 7.Shikata Y, Birukov KG, Garcia JG. J. Appl. Physiol. 2003b;94:1193–203. doi: 10.1152/japplphysiol.00690.2002. [DOI] [PubMed] [Google Scholar]
- 8.Lee OH, Kim YM, Lee YM, Moon EJ, Lee DJ, Kim JH, Kim KW, Kwon YG. Biochem. Biophys. Res. Commun. 1999;264:743–50. doi: 10.1006/bbrc.1999.1586. [DOI] [PubMed] [Google Scholar]
- 9.Mehta D, Konstantoulaki M, Ahmmed GU, Malik AB. J. Biol. Chem. 2005;280:17320–17328. doi: 10.1074/jbc.M411674200. [DOI] [PubMed] [Google Scholar]
- 10.Garcia JG, Davis HW, Patterson CE. J. Cell. Physiol. 1995;163:510–522. doi: 10.1002/jcp.1041630311. [DOI] [PubMed] [Google Scholar]
- 11.Garcia JG. Microvasc. Res. 2009;77:1–3. doi: 10.1016/j.mvr.2009.01.001. [DOI] [PubMed] [Google Scholar]
- 12.Garcia JGN, Schaphorst KL, Verin AD, Vepa S, Patterson CE, Natarajan V. J. Appl. Physiol. 2000;89:2333–2343. doi: 10.1152/jappl.2000.89.6.2333. [DOI] [PubMed] [Google Scholar]
- 13.Lum H, Malik AB. Can. J. Physiol. Pharmacol. 1996;74:787–800. doi: 10.1139/y96-081. [DOI] [PubMed] [Google Scholar]
- 14.Liu F, Schaphorst KL, Verin AD, Jacobs K, Birukova A, Day RM, Bogatcheva N, Bottaro DP, Garcia JGN. FASEB J. 2002;16:950–62. doi: 10.1096/fj.01-0870com. [DOI] [PubMed] [Google Scholar]
- 15.Birukov KG, Bochkov VN, Birukova AA, Kawkitinarong K, Rios A, Leitner A, Verin AD, Bokoch GM, Leitinger N, Garcia JGN. Circ. Res. 2004;95:892–901. doi: 10.1161/01.RES.0000147310.18962.06. [DOI] [PubMed] [Google Scholar]
- 16.Jacobson JR, Dudek SM, Singleton PA, Kolosova IA, Verin AD, Garcia JGN. Am. J. Physiol. Lung. Cell. Mol. Physiol. 2006;291:L289–L295. doi: 10.1152/ajplung.00343.2005. [DOI] [PubMed] [Google Scholar]
- 17.Jacobson JR, Dudek SM, Birukov KG, Ye SQ, Grigoryev DN, Girgis RE, Garcia JGN. Am. J. Respir. Cell. Mol. Biol. 2004;30:662–70. doi: 10.1165/rcmb.2003-0267OC. [DOI] [PubMed] [Google Scholar]
- 18.Fehon RG, McClatchey A, Bretscher A. Nat. Rev. Mol. Cell. Biol. 2010;11:276–287. doi: 10.1038/nrm2866. [DOI] [PMC free article] [PubMed] [Google Scholar]
- 19.Serrador JM, Nieto M, Sanchez-Madrid F. Trends. Cell. Biol. 1999;9:228–233. doi: 10.1016/s0962-8924(99)01553-6. [DOI] [PubMed] [Google Scholar]
- 20.Ng T, Parsons M, Hughes WE, Monypenny J, Zicha D, Gautreau A, Arpin M, Gschmeissner S, Verveer PJ, Bastiaens PIH, Parker PJ. EMBO J. 2001;20:2723–2741. doi: 10.1093/emboj/20.11.2723. [DOI] [PMC free article] [PubMed] [Google Scholar]
- 21.Wu KL, Khan S, Lakhe-Reddy S, Jarad G, Mukherjee A, Obejero-Paz CA, Konieczkowski M, Sedor JR, Schelling JR. J. Biol .Chem. 2004;279:26280–26286. doi: 10.1074/jbc.M400814200. [DOI] [PubMed] [Google Scholar]
- 22.Pearson MA, Reczek D, Bretscher A, Karplus PA. Cell. 2000;101:259–270. doi: 10.1016/s0092-8674(00)80836-3. [DOI] [PubMed] [Google Scholar]
- 23.Fievet BT, Gautreau A, Roy C, Del Maestro L, Mangeat P, Louvard D, Arpin M. J. Cell.Biol. 2004;164:653–659. doi: 10.1083/jcb.200307032. [DOI] [PMC free article] [PubMed] [Google Scholar]
- 24.Matsui T, Yonemura S, Tsukita S. Curr. Biol. 1999;9:1259–1262. doi: 10.1016/s0960-9822(99)80508-9. [DOI] [PubMed] [Google Scholar]
- 25.Gautreau A, Louvard D, Arpin M. J. Cell. Biol. 2000;150:193–203. doi: 10.1083/jcb.150.1.193. [DOI] [PMC free article] [PubMed] [Google Scholar]
- 26.Krieg J, Hunter T. J. Biol. Chem. 1992;267:19258–19265. [PubMed] [Google Scholar]
- 27.Srivastava J, Elliott BE, Louvard D, Arpin M. Mol. Biol. Cell. 2005;16:1481–1490. doi: 10.1091/mbc.E04-08-0721. [DOI] [PMC free article] [PubMed] [Google Scholar]
- 28.Ivetic A, Ridley AJ. Immunology. 2004;112:165–176. doi: 10.1111/j.1365-2567.2004.01882.x. [DOI] [PMC free article] [PubMed] [Google Scholar]
- 29.Belkina NV, Liu Y, Hao JJ, Karasuyama H, Shaw S. Proc. Natl. Acad. Sci .U S A. 2009;106:4707–4712. doi: 10.1073/pnas.0805963106. [DOI] [PMC free article] [PubMed] [Google Scholar]
- 30.Chuan YC, Pang ST, Cedazo-Minguez A, Norstedt G, Pousette A, Flores-Morales A. J. Biol. Chem. 2006;281:29938–29948. doi: 10.1074/jbc.M602237200. [DOI] [PubMed] [Google Scholar]
- 31.Pietromonaco SF, Simons PC, Altman A, Elias L. J. Biol. Chem. 1998;273:7594–7603. doi: 10.1074/jbc.273.13.7594. [DOI] [PubMed] [Google Scholar]
- 32.Koss M, Pfeiffer GR, Wang Y, Thomas ST, Yerukhimovich M, Gaarde WA, Doerschuk CM, Wang Q. J. Immunol. 2006;176:1218–1227. doi: 10.4049/jimmunol.176.2.1218. [DOI] [PubMed] [Google Scholar]
- 33.Wald FA, Oriolo AS, Mashukova A, Fregien NL, Langshaw AH, Salas PJ. J. Cell .Sci. 2008;121(Part 5):644–654. doi: 10.1242/jcs.016246. [DOI] [PMC free article] [PubMed] [Google Scholar]
- 34.Matsui T, Maeda M, Doi Y, Yonemura S, Amano M, Kaibuchi K, Tsukita S, Tsukita S. J. Cell. Biol. 1998;140:647–657. doi: 10.1083/jcb.140.3.647. [DOI] [PMC free article] [PubMed] [Google Scholar]
- 35.Oshiro N, Fukata Y, Kaibuchi K. J. Biol. Chem. 1998;273:34663–34666. doi: 10.1074/jbc.273.52.34663. [DOI] [PubMed] [Google Scholar]
- 36.Cant SH, Pitcher JA. Mol. Biol. Cell. 2005;16:3088–3099. doi: 10.1091/mbc.E04-10-0877. [DOI] [PMC free article] [PubMed] [Google Scholar]
- 37.Baumgartner M, Sillman AL, Blackwood EM, Srivastava J, Madson N, Schilling JW, Wright JH, Barber DL. Proc. Natl. Acad. Sci. USA. 2006;103:13391–13396. doi: 10.1073/pnas.0605950103. [DOI] [PMC free article] [PubMed] [Google Scholar]
- 38.Nakamura N, Oshiro N, Fukata Y, Amano M, Fukata M, Kuroda S, Matsuura Y, Leung T, Lim L, Kaibuchi K. Genes. Cells. 2000;5:571–581. doi: 10.1046/j.1365-2443.2000.00348.x. [DOI] [PubMed] [Google Scholar]
- 39.ten Klooster JP, Jansen M, Yuan J, Oorschot V, Begthel H, Di Giacomo V, Colland F, d e Koning J, Maurice MM, Hornbeck P, Clevers H. Dev. Cell. 2009;16:551–62. doi: 10.1016/j.devcel.2009.01.016. [DOI] [PubMed] [Google Scholar]
- 40.Birukov KG, Jacobson JR, Flores AA, Ye SQ, Birukova AA, Verin AD, Garcia JG. Am. J. Physiol. Lung. Cell. Mol. Physiol. 2003;285:L785–L797. doi: 10.1152/ajplung.00336.2002. [DOI] [PubMed] [Google Scholar]
- 41.Birukova AA, Smurova K, Birukov KG, Kaibuchi K, Garcia JG, Verin AD. Microvasc. Res. 2004;67:64–77. doi: 10.1016/j.mvr.2003.09.007. [DOI] [PubMed] [Google Scholar]
- 42.Verin AD, Birukova A, Wang P, Liu F, Becker P, Birukov K, Garcia JG. Am. J. Physiol. Lung. Cell. Mol. Physiol. 2001;281:L565–L574. doi: 10.1152/ajplung.2001.281.3.L565. [DOI] [PubMed] [Google Scholar]
- 43.Elbashir SM, Harborth J, Lendeckel W, Yalcin A, Weber K, Tuschl T. Nature. 2001;411:494–498. doi: 10.1038/35078107. [DOI] [PubMed] [Google Scholar]
- 44.Toullec D, Pianetti P, Coste H, Bellevergue P, Grand-Perret T, Ajakane M, Baudet V, Boissin P, Boursier E, Loriolle F, Duhamell L, Charon D, Kirilovsky J. J. Biol. Chem. 1991;266:15771–15781. [PubMed] [Google Scholar]
- 45.Wilkinson SE, Parker PJ, Nixon JS. Biochem. J. 1993;294(Pt 2):335–337. doi: 10.1042/bj2940335. [DOI] [PMC free article] [PubMed] [Google Scholar]
- 46.Martiny-Baron G, Kazanietz MG, Mischak H, Blumberg PM, Kochs G, Hug H, Marme D, Schachtele C. J. Biol .Chem. 1993;268:9194–9197. [PubMed] [Google Scholar]
- 47.Tolias KF, Hartwig JH, Ishihara H, Shibasaki Y, Cantley LC, Carpenter CL. Curr. Biol. 2000;10:153–156. doi: 10.1016/s0960-9822(00)00315-8. [DOI] [PubMed] [Google Scholar]
- 48.Wang L, Dudek SM. Microvasc. Res. 2009;77:39–45. doi: 10.1016/j.mvr.2008.09.005. [DOI] [PMC free article] [PubMed] [Google Scholar]
- 49.Dudek SM, Camp SM, Chiang ET, Singleton PA, Usatyuk PV, Zhao Y, Natarajan V, Garcia JGN. Cell. Signal. 2007;19:1754–1764. doi: 10.1016/j.cellsig.2007.03.011. [DOI] [PMC free article] [PubMed] [Google Scholar]
- 50.Rosen H, Sanna MG, Cahalan SM, Gonzalez-Cabrera PJ. Trends. Immunol. 2007;28:102–107. doi: 10.1016/j.it.2007.01.007. [DOI] [PubMed] [Google Scholar]
- 51.Canals D, Jenkins RW, Roddy P, Hernández-Corbacho MJ, Obeid LM, Hannun YA. J. Biol. Chem. 2010;285:32476–32485. doi: 10.1074/jbc.M110.141028. [DOI] [PMC free article] [PubMed] [Google Scholar]
- 52.Hicks K, O'Neil RG, Dubinsky WS, Brown RC. Am. J. Physiol. Cell. Physiol. 2010;298:C1583–1593. doi: 10.1152/ajpcell.00458.2009. [DOI] [PMC free article] [PubMed] [Google Scholar]
- 53.Guo X, Wang L, Chen B, Li Q, Wang J, Zhao M, Wu W, Zhu P, Huang X, Huang Q. Am. J .Physiol .Heart. Circ. Physiol. 2009;297:H238–246. doi: 10.1152/ajpheart.00196.2009. [DOI] [PubMed] [Google Scholar]
- 54.Saotome I, Curto M, McClatchey AI. Dev. Cell. 2004;6:855–864. doi: 10.1016/j.devcel.2004.05.007. [DOI] [PubMed] [Google Scholar]
- 55.Tamura A, Kikuchi S, Hata M, Katsuno T, Matsui T, Hayashi H, Suzuki Y, Noda T, Tsukita S, Tsukita S. J. Cell .Biol. 2005;169:21–28. doi: 10.1083/jcb.200410083. [DOI] [PMC free article] [PubMed] [Google Scholar]
- 56.Kikuchi M, Hata K, Fukumoto Y, Yamane Y, Matsui T, Tamura A. Nat. Genet. 2002;31:320–325. doi: 10.1038/ng905. [DOI] [PubMed] [Google Scholar]
- 57.Kitajiri S, Fukumoto K, Hata M, Sasaki H, Katsuno T, Nakagawa T, Ito J, Tsukita S, Tsukita S. J. Cell .Biol. 2004;166:559–570. doi: 10.1083/jcb.200402007. [DOI] [PMC free article] [PubMed] [Google Scholar]
- 58.Khan SY, Ahmed ZM, Shabbir MI, Kitajiri SI, Kalsoom S, Tasneem S. Hum. Mut. 2007;28:417–423. doi: 10.1002/humu.20469. [DOI] [PubMed] [Google Scholar]
- 59.Doi Y, Itoh M, Yonemura S, Ishihara S, Takano H, Noda T, Tsukita S, Tsukita S. J. Biol. Chem. 1999;274:2315–2321. doi: 10.1074/jbc.274.4.2315. [DOI] [PubMed] [Google Scholar]
- 60.Gautreau A, Poullet P, Louvard D, Arpin M. Proc. Natl .Acad. Sci. USA. 1999;96:7300–7305. doi: 10.1073/pnas.96.13.7300. [DOI] [PMC free article] [PubMed] [Google Scholar]
- 61.Franck Z, Gary R, Bretscher A. J. Cell. Sci. 1993;105:219–231. doi: 10.1242/jcs.105.1.219. [DOI] [PubMed] [Google Scholar]
- 62.Ilani T, Khanna C, Zhou M, Veenstra TD, Bretscher A. J. Cell. Biol . 2007;179:733–746. doi: 10.1083/jcb.200707199. [DOI] [PMC free article] [PubMed] [Google Scholar]
- 63.Loebrich S, Bähring R, Katsuno T, Tsukita S, Kneussel M. EMBO J. 2006;25:987–999. doi: 10.1038/sj.emboj.7600995. [DOI] [PMC free article] [PubMed] [Google Scholar]
- 64.Takeuchi K, Sato N, Kasahara H, Funayama N, Nagafuchi A, Yonemura S, Tsukita S, Tsukita S. J. Cell. Biol. 1994;125:1371–1384. doi: 10.1083/jcb.125.6.1371. [DOI] [PMC free article] [PubMed] [Google Scholar]
- 65.Shaffer MH, Dupree RS, Zhu P, Saotome I, Schmidt RF, McClatchey AI, Freedman BD, Burkhardt JK. J. Immunol . 2009;182:1021–1032. doi: 10.4049/jimmunol.182.2.1021. [DOI] [PMC free article] [PubMed] [Google Scholar]
- 66.Niggli V, Rossy J. Int. J. Bioch. Cell. Biol. 2008;40:344–349. doi: 10.1016/j.biocel.2007.02.012. [DOI] [PubMed] [Google Scholar]
- 67.Tolias KF, Couvillon AD, Cantley LC, Carpenter CL. Mol. Cell .Biol. 1998;18:762–770. doi: 10.1128/mcb.18.2.762. [DOI] [PMC free article] [PubMed] [Google Scholar]
- 68.Weernink PA, Meletiadis K, Hommeltenberg S, Hinz M, Ishihara H, Schmidt M, Jakobs KH. J. Biol .Chem. 2004;279:7840–7849. doi: 10.1074/jbc.M312737200. [DOI] [PubMed] [Google Scholar]
- 69.Gorshkova I, He D, Berdyshev E, Usatuyk P, Burns M, Kalari S, Zhao Y, Pendyala S, Garcia JGN, Pyne NJ, Brindley DN, Natarajan V. J. Biol. Chem. 2008;283:11794–11806. doi: 10.1074/jbc.M800250200. [DOI] [PMC free article] [PubMed] [Google Scholar]
- 70.Sammani S, Moreno-Vinasco L, Mirzapoiazova T, Singleton PA, Chiang ET, Evenoski CL, Wang T, Mathew B, Husain A, Moitra J, Sun X, Nunez L, Jacobson JR, Dudek SM, Natarajan V, Garcia JG. Am. J. Respir. Cell. Mol .Biol. 2010;43:394–402. doi: 10.1165/rcmb.2009-0223OC. [DOI] [PMC free article] [PubMed] [Google Scholar]
- 71.Roch F, Polesello C, Roubinet C, Martin M, Roy C, Valenti P, Carreno S, Mangeat P, Payre F. J Cell. Sci. 2010;123(Pt 12):2058–2067. doi: 10.1242/jcs.064550. [DOI] [PubMed] [Google Scholar]
- 72.Yang HS, Hinds PW. Mol Cell. 2003;11:1163–1176. doi: 10.1016/s1097-2765(03)00135-7. [DOI] [PubMed] [Google Scholar]
- 73.Krieg J, Hunter T. J Biol Chem. 1992;267:19258–19265. [PubMed] [Google Scholar]
- 74.Liu G, Voyno-Yasenetskaya TA. J. Biol.Chem. 2005;280:39042–39049. doi: 10.1074/jbc.M504341200. [DOI] [PubMed] [Google Scholar]
- 75.Pujuguet P, Del Maestro L, Gautreau A, Louvard D, Arpin M. Mol. Biol .Cell. 2003;14:2181–2191. doi: 10.1091/mbc.E02-07-0410. [DOI] [PMC free article] [PubMed] [Google Scholar]
- 76.Takahashi K, Sasaki T, Mammoto A, Takaishi K, Kameyama T, Tsukita S, Tsukita S, Takai Y. J. Biol. Chem. 1997;272:23371–23375. doi: 10.1074/jbc.272.37.23371. [DOI] [PubMed] [Google Scholar]
- 77.Singleton PA, Dudek SM, Chiang ET, Garcia JG. FASEB J. 2005;19:1646–1656. doi: 10.1096/fj.05-3928com. [DOI] [PubMed] [Google Scholar]
- 78.Manser E, Loo TH, Koh CG, Zhao ZS, Chen XQ, Tan L, Tan I, Leung T, Lim L. Mol. Cell. 1998;1:183–192. doi: 10.1016/s1097-2765(00)80019-2. [DOI] [PubMed] [Google Scholar]
- 79.Lee JH, Katakai T, Hara T, Gonda H, Sugai M, Shimizu A. J. Cell .Biol. 2004;167:327–337. doi: 10.1083/jcb.200403091. [DOI] [PMC free article] [PubMed] [Google Scholar]
- 80.D'Angelo R, Aresta S, Blangy A, Del Maestro L, Louvard D, Arpin M. Mol .Biol.Cell. 2007;18:4780–4793. doi: 10.1091/mbc.E06-12-1144. [DOI] [PMC free article] [PubMed] [Google Scholar]
- 81.Shikata Y, Birukov KG, Garcia JG. J. Appl. Physiol. 2003;94:1193–1203. doi: 10.1152/japplphysiol.00690.2002. [DOI] [PubMed] [Google Scholar]
- 82.Shikata Y, Birukov KG, Birukova AA, Verin A, Garcia JGN. FASEB J. 2003;17:2240–2249. doi: 10.1096/fj.03-0198com. [DOI] [PubMed] [Google Scholar]
- 83.Sun X, Shikata Y, Wang L, Ohmori K, Watanabe N, Wada J, Shikata K, Birukov KG, Makino H, Jacobson JR, Dudek SM, Garcia JGN. Microvasc. Res. 2009;77:304–313. doi: 10.1016/j.mvr.2008.12.004. [DOI] [PMC free article] [PubMed] [Google Scholar]
Associated Data
This section collects any data citations, data availability statements, or supplementary materials included in this article.
Supplementary Materials
Supplemental Figure 1. Specificities of individual ERM siRNAs. Ezrin, radixin, and moesin depletion was induced by specific siRNA duplexes and assessed for cross silencing effects by immunoblotting with appropriate Ab, as compared with treatment with nonspecific (ns) siRNA. Immunoblotting with β-tubulin Ab was used as a normalization control. Quantitative analysis of protein expression was performed by scanning densitometry of the membranes and expressed in relative density units (RDU). Results are means ± S.E. for three independent experiments. *, significant difference (p < 0.05) when compare with cells treated with ns siRNA.
Supplemental Figure 2. Effects of ezrin, radixin, and moesin depletion on S1P-induced cytoskeletal remodeling. EC grown on glass cover slips were incubated with combinations of siRNAs to ezrin, radixin, and moesin or treated with non-specific siRNA duplex as described in Methods followed by S1P treatment (1μM, 20 min). ECs were subjected to double immunofluorescent staining with Texas Red phalloidin to visualize F-actin (panels A and B, upper images) and anti-pp-MLC Ab (Panels A and B, bottom images). Incubation with combined siRNAs to ezrin and radixin (g, h) inhibits S1P-induced cortical actin ring formation and peripheral MLC phosphorylation compared with control (nsRNA) incubation (c, d, arrows). In contrast, combination siRNA to ezrin and moesin enhances S1P-stimulated cortical actin ring formation and peripheral MLC phosphorylation (o, p arrows) compared with incubation with nsRNA. Bar = 10 μM. Results are representative of three independent experiments.
Supplemental Figure 3. Effects of S1P on phosphorylation of PKC isoforms in HPAEC. Confluent HPAEC were treated either with control vehicle or S1P (1 μM) for the indicated times, and phosphorylated PKCζ (A), PKCθ (B), PKCβ (C), and PKCδ (D) were detected via immunoblot. Bar graphs represent relative densitometry of fold changes in phosphorylated PKC isoforms after S1P relative to vehicle-treated control and expressed as means ± S.E. from three independent experiments. *, significantly different from cells treated with EBM-2 (p < 0.05); #, significantly different from cells treated with EBM-2 (p < 0.01).
Supplemental Figure 4. Depletion of PKC isoforms and p38 MAPK by siRNA. PKCβ (A), PKCδ (B), PKCθ (C), PKCζ (D), and p38 MAPK (E) depletion were induced by specific siRNA duplexes and assessed for silencing effects by immunoblotting with appropriate Ab, as compared with treatment with nonspecific (ns) siRNA. Immunoblotting with β-actin Ab was used as a normalization control. Quantitative analysis of protein expression was performed by scanning densitometry and expressed in relative density units (RDU). Results are means ± S.E. for three independent experiments. #, significant difference (p < 0.01) when compared with cells treated with ns siRNA.


