Abstract
The coronary sinus (CS) vessel serves as a conduit for the deployment of percutaneous transvenous mitral annuloplasty (PTMA) devices for the treatment of functional mitral regurgitation. Characterization of the mechanical response of the CS is an important step towards an understanding of tissue–device interaction in PTMA intervention. The purpose of this study was to investigate the mechanical properties of the porcine CS using the pressure–inflation test and constitutively model the wall behavior using a four fiber family strain energy function (SEF). The results showed that the CS exhibited an S-shaped pressure–radius response and could be dilated up to 88% at a pressure of 80 mm Hg. Excellent results from model fitting indicated that the four fiber family SEF could capture the experimental data well and could be used in future numerical simulations of tissue–device interaction. In addition, a histological study was performed to identify the micro-structure of the CS wall. We found a high content of striated myocardial fibers (SMFs) surrounding the CS wall, which was also mainly composed of SMFs, while the content of smooth muscle cells was very low. Elastin and collagen fibers were highly concentrated in the luminal and outer layers and sparsely distributed in the medial layer of the CS wall. These structural and mechanical properties of the CS should be taken into consideration in future PTMA device designs.
Keywords: Coronary sinus, Mechanical testing, Constitutive modeling, Percutaneous, Mitral valve repair
1. Introduction
Mitral regurgitation (MR) is the abnormal leakage of blood back into the left atrium during systole. Common co-morbidities associated with MR include myocardial infarction [1], severe systolic dysfunction and left ventricular dilation [2]. The prognosis of MR is difficult, and the patient can be asymptomatic in mild and moderate MR cases [3]. A routine examination of 1336 men and 1545 women (54 ± 10 years of age) in the Framingham Study [4] found that 19% of men and 19.1% of women had greater than or mild MR. The presence of MR was found to be an independent predictor of cardiovascular mortality [5] and impaired survival [6]. It has been shown that functional MR can decrease the survival rate at year 5–48.7% for mild cases and 39.9% for moderate to severe cases in a population of patients with left ventricular systolic dysfunction and heart failure [7].
Surgical mitral valve repair and replacement have been used to correct MR. However, relatively high operative mortality rates, up to 6–12% [8-11], and a significantly increased risk for patients of advanced ages and/or with other co-morbidities have limited the use of these procedures. Recently, a new percutaneous intervention, called percutaneous transvenous mitral annuloplasty (PTMA), utilizing a transcatheter technique for correcting MR, was introduced. Fig. 1 illustrates one of these PTMA devices. This PTMA device consists of a 12F outer diameter guide catheter and dilator, a 9F delivery catheter and a nickel-titanium alloy (nitinol) implant. The implant itself is composed of three sections: a distal self-expanding anchor, a spring-like “bridge” and a proximal self-expanding anchor. The proximal and distal self-expanding anchors, once embedded within the coronary sinus (CS), will expand and position at the CS ostium and the great cardiac vein (GCV) ends, respectively. The bridge element can be shortened. Hence, it will pull the proximal and distal anchors together, displacing the posterior annulus anteriorly and reducing the mitral annulus diameter along the septal–lateral axis.
Fig. 1.
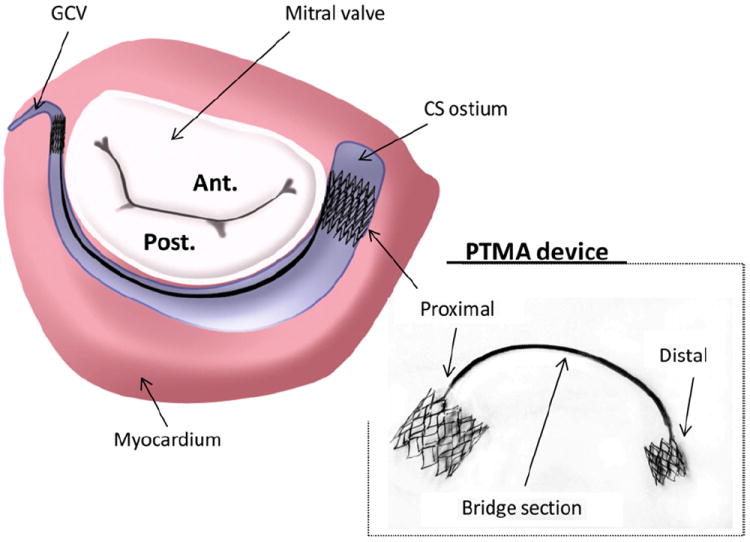
Illustration of a PTMA device being deployed in the coronary sinus (CS) vessel, which is adjacent to the posterior mitral annulus. Ant, anterior mitral leaflet; Post, posterior mitral leaflet; GCV; great cardiac vein.
Several animal and human clinical trials using various PTMA devices have recently been conducted [11-13]. Although early clinical efficacy was demonstrated, device dysfunction and fatigue fracture were reported in these studies. The first in-human clinical trial of a PTMA device as shown in Fig. 1 in five patients was conducted by Webb et al. [12] in 2006. In this study device fracture at the bridge section was reported in three patients and severe MR grade recurrence was observed after bridge separation. In addition, although no severe injury to the CS was detected, compression of the surrounding arteries (i.e. left circumflex artery) was reported. Because the PTMA device was in direct contact with the CS, biomechanical interaction between the device and the tissue could be a critical factor for device end results. We assume that a better understanding of biomechanical interaction between the device and the host tissues may elicit the underlying implant failure mechanisms and improve PTMA device design.
In this study we conducted the first, to our knowledge, biomechanical characterization of the CS using a porcine model. A pressure–diameter inflation test was performed on the CS in its intact, in-service configuration, e.g. the CS was not dissected from the surrounding myocardium, to quantify the in vitro mechanical responses. A strain energy function (SEF) was utilized to characterize the nonlinear hyperelastic properties of the vessel wall. In addition, the CS histology was studied to elicit its structural components.
2. Materials and methods
2.1. Pressure–inflation experiment
The coronary sinus is a large venous vessel that returns deoxygenated blood from the left heart and drains into the right atrium. It begins at the termination of the great cardiac vein (GCV), marked by the valve of Vieussens internally and the small oblique vein or vein of Marshall (OV) externally. Located in the sulcus of the atrio-ventricular groove, the CS runs along the posterior side of the annulus of the left atrium and ends at the Thebesian valve, which marks the CS ostium [14-16]. In this study we focused on material characterization of the CS ostium region about 10 mm from the Thebesian valve, since it is the region that is directly in contact with the proximal anchor stent of a PTMA device. Porcine hearts were used in this study because of the similarity between porcine and human hearts in terms of mitral valve related applications [17].
A total of seven fresh porcine hearts, typical of 6–9 months old with a weight range of 400–500 g, were obtained from a local abattoir. Upon delivery on ice they were subjected to vessel pressure–inflation testing within 48 h. Prior to testing the hearts were separated from excess tissue (e.g. aorta arch and fat) and blood clumps. The right atrium was incised to expose the CS ostium and a small section about 5 mm from the CS ostium was detached from the left atrial appendage (LAA) for the purpose of connecting a plastic cannula to the CS to produce the inflow pressure. The plastic cannulae varied in size to fit various CS diameters (e.g. 4, 6 and 8 mm). The other end of the CS (at the junction of the CS and GCV) was secured with surgical forceps. To ensure pressure stabilization all other branches of the CS were occluded with ligatures. Then the whole heart was submerged in a small plexiglass tank (21 mm long × 18 mm wide × 18 mm high and 2.8 mm thick). The front side of the tank was replaced with a thin (0.35 mm thick) clear plastic sheet for the purposes of imaging. The tank was filled with Ca2+-free saline solution at room temperature. The heart was stabilized by being rested on a sponge placed on the bottom of the tank. The cannula at the CS ostium end was connected to a pressure gauge, which was linked by a flexible plastic tube to a water tank where a hand-operated pump was used to apply pressure to the CS. The ultrasound probe (7.5 MHz transducer RT320, General Electronic Inc.) projected a beam perpendicular to the CS on the clear plastic sheet side of the tank to collect two-dimensional (2D) cross-sectional images of the CS (see Fig. 2a). Since the water tank was clear the ultrasound wave travelled through the tank and the water to the tissue and then back to the probe. All data were recorded at a cross-section about 10 mm from the CS ostium.
Fig. 2.
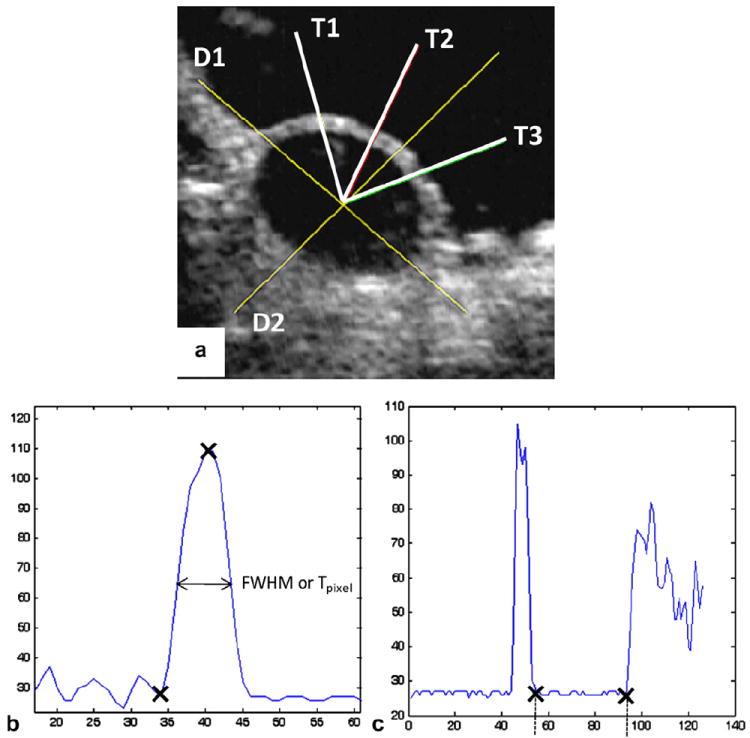
(a) An ultrasound image of a cross-section of the inflated CS vessel, with two line segments D1 and D2 for measuring diameters and three line segments T1, T2 and T3 for thickness measurements; (b) thickness measurements using the FWHM method (to obtain Tpixel, or the thickness in pixels, of the width of the half amplitude of the peak); (c) diameter measurements (distance between the two crosses, in pixels), both processed by the Matlab “improfile” function.
Each specimen was subjected to preconditioning by inflating up to 80 mm Hg and then venting the pressure back to 0 mm Hg. This process was repeated 20 times to minimize hysteresis. Testing was then conducted by increasing the pressure from 0 to 80 mm Hg in increments of 5 mm Hg s−1. At each pressure a 2D ultrasonic image of the CS cross-section was taken immediately using custom-written image capture software. A total of 17 images were taken for each heart, and the inner diameter and CS wall thickness were measured using image post-processing code written in Matlab (Mathworks, Natick, MA). Utilizing ultrasound images to capture the cross-sectional CS geometry during the inflation test allowed direct measurement of the tissue thickness. This method may provide a more accurate estimation of circumferential stretch and stress using Eqs. (1)-(3) below, compared with other methods that use the derived thickness based on markers on the surface of the vessel, particularly when the vessel is curved and partially imbedded in surrounding tissue.
2.2. Ultrasound image analysis
All images were imported into the Matlab program and analyzed using a Matlab function called “improfile”. Briefly, the image processing technique involved identifying boundaries of tissues from the change in impedance of the medium when the ultrasound wave travelled from water to tissue and from tissue to water. The change in impedance resulted in a change in the image intensity, with high (white) and low (black) intensities indicating tissue and water, respectively. The “improfile” function identifies the intensity values along a line or a multiline path specified by the user, interpolating to find the intensity value for each pixel and graphing these intensity values. Both diameter and thickness values were determined by detecting the pixel value along line segments (Fig. 2b and c).
For diameter measurements two line segments were drawn across the anterior–posterior and superior–inferior views of the vessel. As the CS is partially imbedded in the myocardium, the inflated vessel circumference at low pressure may not be circular. Therefore, two measurements of diameters were recorded and averaged. A center point was determined from the intersection of these two lines. Thickness was measured by drawing three lines, originating from the center point and each going separately through three different sections across the thickness (see Fig. 2a). Thickness measurement was estimated using a basic image analysis technique termed full-width half-maximum (FWHM) [18]. Real measurements of tissues using a non-rotating thickness gauge (Mitutoyo, Model 7301) determined that FWHM provided a good approximation of thickness. Basically, FWHM is the full width of the section (across the CS wall) at the half maximum value (intensity value). Three measurements of thickness were averaged to obtain the mean. Units in pixels were converted to lengths according to ultrasound image calibration.
2.3. Histology
Each CS vessel was removed from the heart and fixed in formalin for 24 h prior to histological processing. Cross-sections through the thickness of both the anterior and posterior CS sections were examined. Each sample was sliced into several 6 μm pieces in both the axial and circumferential directions using a cryostat microtome and then stained with Verhoeff–Van Gieson (VVG) stain. Thus, the black strands are elastic fibers and the bright red materials are collagen fibers. Muscle fibers can also be distinguished as a duller red or light brown color. Histological images were obtained with an Olympus 220 digital camera coupled to an Olympus CX41 light microscope and analyzed using LabView software (National Instruments, Austin, TX).
2.4. Constitutive modeling
The pressure–radius data were utilized to characterize CS mechanical properties using a four fiber family SEF [19]. For a segment of CS with initial and deformed axial lengths L and l, respectively, with the assumption of tissue incompressibility, the vessel wall volume V is a constant during inflation. Thus, we have:
| (1) |
where A and B denote the initial, unloaded inner and outer radii, respectively, and a and b denote the deformed, loaded inner and outer radii, respectively. Following the method presented in Wicker et al. [19], the associated mean stretch ratios in the CS circumferential and axial directions were computed as:
| (2) |
Note that both the initial and deformed lengths were not experimentally measured in this study. Instead, using Eq. (1) and the assumption of tissue incompressibility, the axial stretch was calculated using Eq. (2). The mean circumferential (σθ) and axial (σz) Cauchy stresses [20] can be calculated using the pressure–radius experimental data in the deformed configurations:
| (3) |
where P is the luminal pressure (the outer pressure was assumed to be approximately 0), h = b − a is the thickness and πa2 P accounts for the luminal pressure acting over the projected inner cross-sectional area of the CS.
We assumed that the CS behaved as a hyperelastic material following the concept of pseudoelasticity [21], thus the four fiber family model W could be expressed as:
| (4) |
where c, and are the material parameters and the superscript k represents the kth fiber families. The fiber families k = 1 and 2 represent axially (0°) and circumferentially (90°) oriented fibers, respectively, and the fiber families k = 3 and 4 represent diagonally oriented fibers (see Fig. 3). Note that these fiber families do not reflect the physical fibers, instead they are virtual fibers representing all fibers oriented in four directions throughout the vessel wall. The parameter l1 is the first invariant of the right Cauchy–Green tensor, is the stretch of kth fiber family and represents the angle between the fiber family and the CS axial direction, with , and . For Eq. (4) , , , and are typically assumed [19,22,23], therefore, a total of six parameters was needed to be determined.
Fig. 3.
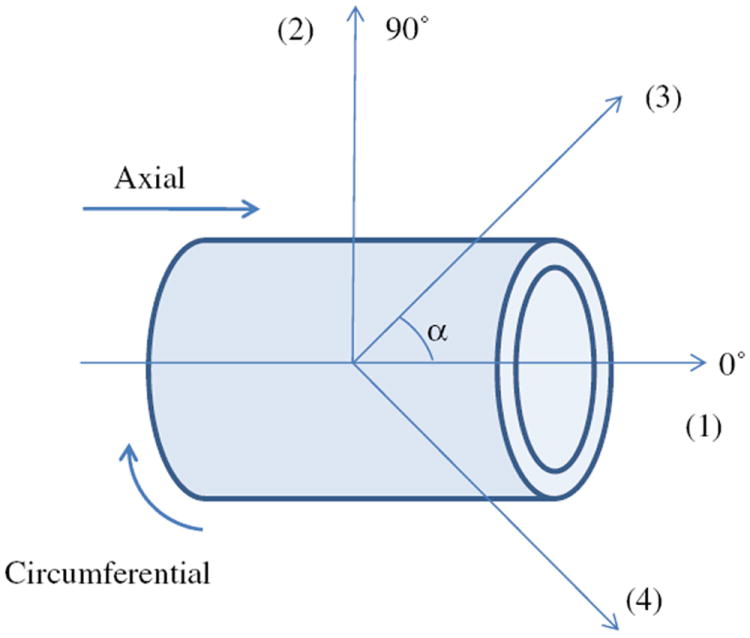
Schematic of the vessel fiber orientation, with k = 1 and 2 are 0° (axial) and 90° (circumferential) oriented fibers, respectively, and k = 3 and 4 are diagonally oriented fibers.
Finally, the associated mean circumferential and axial Cauchy stresses were [23],
| (5) |
The constitutive model was fitted to the experimental pressure–diameter data, yielding six optimal parameters for each data-set. In addition, the mean responses of seven pressure–diameter data were obtained and fitted. The material parameters of the mean response (P_Mean_Exp_Data) and the mean values of the optimal material parameters (P_Mean_Para) were compared. The goodness of the fit was determined using the R2 value based on the Levenberg–Marquardt nonlinear regression algorithm using Systat 10 (Systat Software, Chicago, IL). Variations in the test data are presented in terms of standard errors.
3. Results
3.1. CS anatomy
Similarly to the human CS, the porcine CS has the same major tributaries, which are the GCV, the OV, which descends along the lateral and inferior wall of the left atrium and joins the GCV to form the CS, and the inferior left ventricular vein (ILV), which drains from the diaphragmatic surface of the left ventricle (see Fig. 4a and b). However, we noticed that there was a distinct difference between the porcine and human CS. Unlike the human OV, which is small [14,15], the diameter of the porcine OV was as large as the diameter of the CS (see Fig. 4a), and there was no obvious differentiation that separated this vessel from the CS. Fig. 5 illustrates the CS cut along its long axis. The internal surface of the CS resembled the right atrial endocardium, rather than the endothelium of a vein. The free wall of the CS was surrounded by a striated myocardial fiber (SMF) cuff that runs obliquely starting from the OV. Superior to this SMF sheet was a thin layer of connective tissue, which also surrounded the OV (Fig. 5a). The anterior part of the CS was attached to the LAA, and the barrier between the LAA and CS could also be identified (long dashed line in Fig. 5c).
Fig. 4.
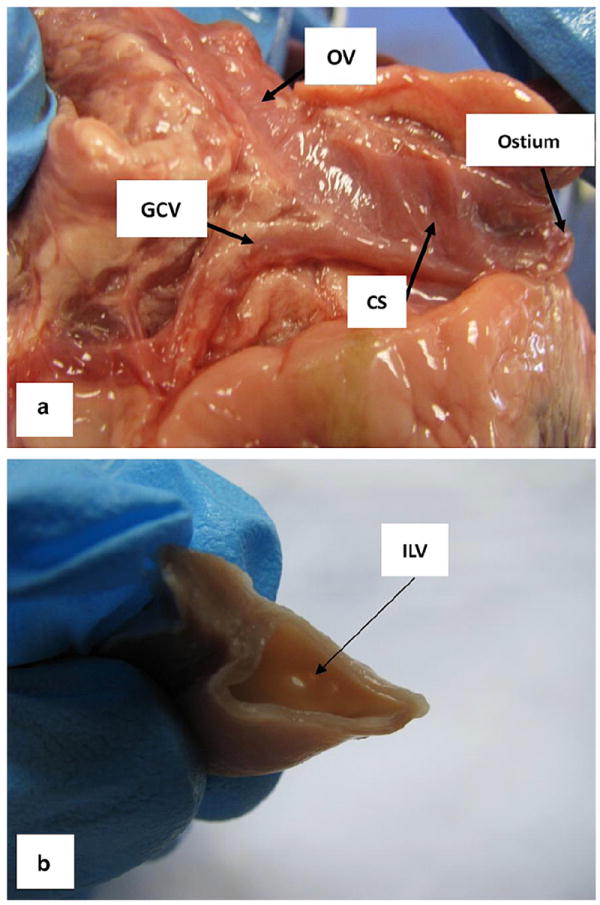
The major tributaries of the CS: (a) the great cardiac vein (GCV) and the oblique vein of Marshall (OV) and (b) the inferior left ventricular vein (ILV).
Fig. 5.
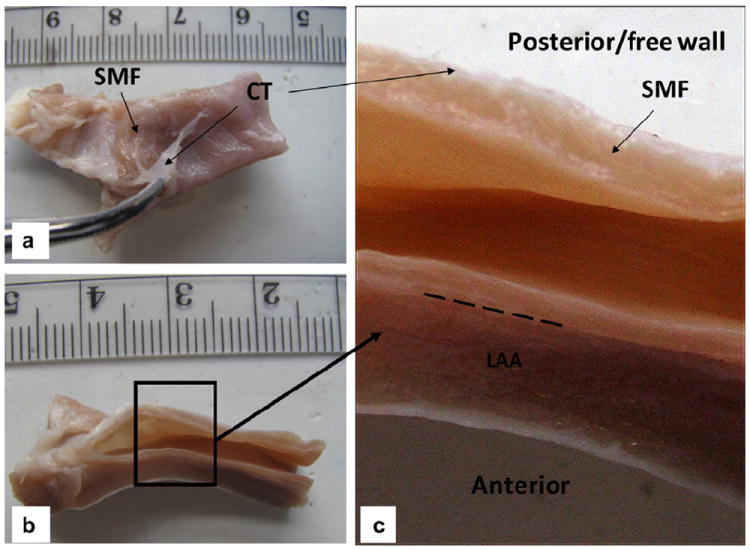
(a) Coronary sinus (CS) vessel fixed in 10% formalin for 2 days, with the connective tissue (CT) peeled off to expose the striated myocardial fiber (SMF) layer; (b) axial view; (c) a closer view of the CS inner wall with distinctive layers of SMF, CT and left atrial appendage (LAA). The long dashed line indicates the barrier between the CS wall and LAA.
3.2. Mechanical responses of the CS
Initial and maximum dilated diameters and thicknesses of seven specimens are listed in Table 1. The mean pressure versus the inner diameter response of seven CS are illustrated in Fig. 6. The CS exhibited an S-shaped curve, typical for blood vessels [20]. Below a pressure of 10 mm Hg the CS did not exhibit obvious dilatation. However, in the pressure range 10–30 mm Hg there was a rapid extension of the CS diameter. As the pressure increased above 30 mm Hg the wall became progressively less distensible and stayed nearly flat at high pressures. At 30 mm Hg pressure the CS could be dilated by up to approximately 60%, and at 80 mm Hg by up to about 88%. The CS vessel wall thickness decreased with applied pressure (see Fig. 6b), as one would expect.
Table 1.
Initial and maximum dilated diameters and thicknesses of seven specimens.
| Specimen | D0 | D | T0 | T | D/D0 | T/T0 |
|---|---|---|---|---|---|---|
| 1 | 4.90 | 12.50 | 1.37 | 0.71 | 2.55 | 0.52 |
| 2 | 3.11 | 6.55 | 0.56 | 0.55 | 2.11 | 0.98 |
| 3 | 5.04 | 10.09 | 1.12 | 0.63 | 2.00 | 0.56 |
| 4 | 8.54 | 11.72 | 1.06 | 0.62 | 1.37 | 0.58 |
| 5 | 7.06 | 10.86 | 1.54 | 1.02 | 1.54 | 0.66 |
| 6 | 4.22 | 7.59 | 1.54 | 1.15 | 1.80 | 0.75 |
| 7 | 6.00 | 10.95 | 1.42 | 0.63 | 1.83 | 0.44 |
| Mean | 5.55 | 10.04 | 1.23 | 0.76 | 1.88 | 0.64 |
D0 is the initial diameter, D is the maximum distended diameter, T0 is the initial thickness and T is the thickness at maximum pressure, 80 mm Hg. All measurements are in mm.
Fig. 6.
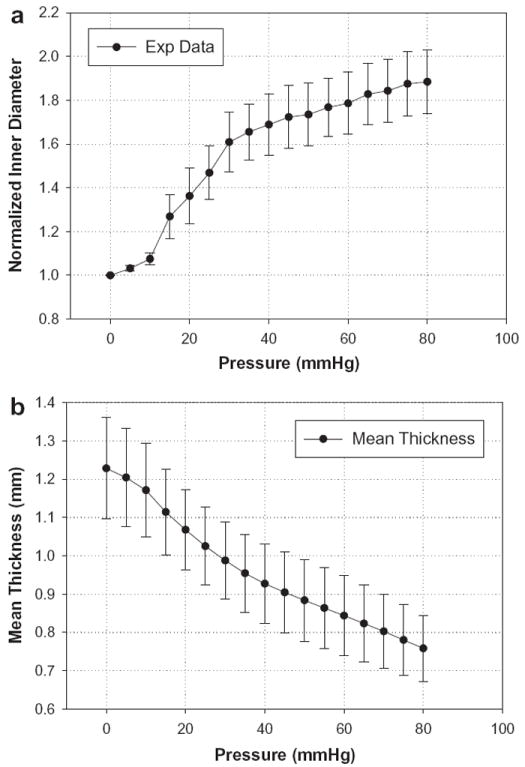
(a) The normalized pressure versus inner diameter experimental results from seven porcine CS inflated to a maximum pressure of 80 mm Hg; (b) thickness change of the anterior section of the CS vessel. Data are expressed as means ± standard error.
The mean stress versus stretch curves for the CS obtained from the pressure–inflation experiments can be seen in Fig. 7 for both the axial and circumferential directions. The maximum stress values were 35.5 ± 4.64 and 75.95 ± 9.34 kPa for the axial and circumferential, respectively, under 80 mm Hg pressure. The response in the axial direction showed an initial contraction, which ceased at about 10 mm Hg, followed by an extension at higher pressures.
Fig. 7.
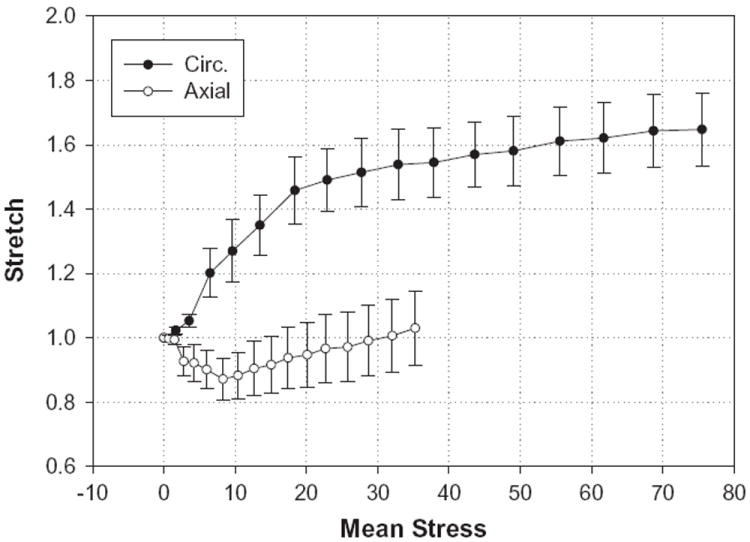
Stretch–stress curves for the CS obtained from the pressure–inflation tests. The upper curve represents the response in the circumferential (Circ.) direction, while the lower curve is for the axial direction. Data are expressed as means ± standard error.
3.3. Micro-structure of the CS vessel wall
The circumferentially cut sections of the posterior (free wall) and anterior (section attached to the LAA) CS are illustrated in Fig. 8. The posterior CS sections were covered by a layer of SMFs oriented circumferentially (see Fig. 8a). The CS wall, unlike other vessel walls, was mainly composed of SMFs, with a small content of smooth muscle cells (SMCs). The SMCs were only observed in bundles in the outer layer of the anterior section of the CS (see Fig. 8b, arrow). The SMF orientations were similar in both the anterior and posterior sections, where they aligned in the circumferential direction in the luminal layer and realigned in the transverse direction in the medial layer. Collagen and elastin fibers were found throughout the vessel wall (see Fig. 8c and d), while collagen fibers were sparsely scattered in the SMF layer. Elastin fibers were aligned in the axial direction in the luminal layer and realigned in the circumferential direction in the medial layer of the CS wall. Crimping of the collagen fibers was also observed in the axial direction in the CS luminal layer (see Fig. 8c).
Fig. 8.
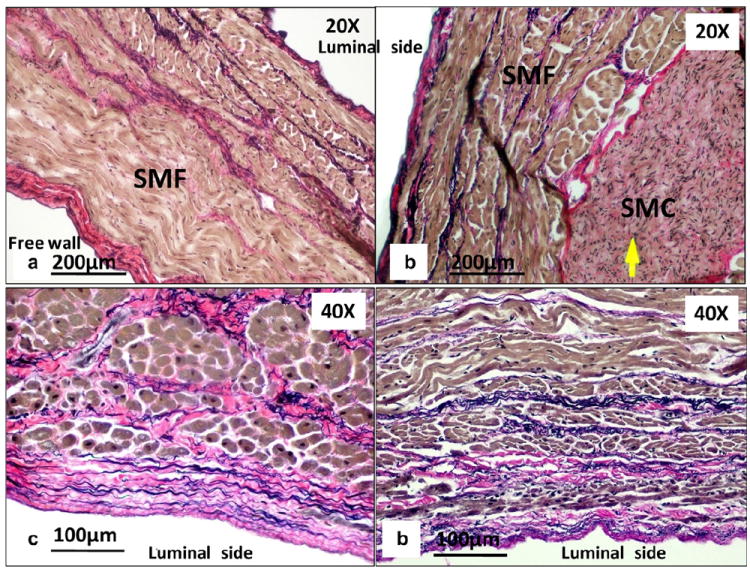
Circumferential-cut sections of (a) the posterior (free wall) and (b) the anterior wall of the CS. Close-up views of the CS at the luminal layer along the (c) axial and (d) circumferential axes. The arrow indicates smooth muscle cells (SMCs).
3.4. Constitutive modeling
Material parameters and R2 values of seven individual specimens obtained from the four fiber family model fit are summarized in Table 2. The model captures the tissue response well, with a mean R2 value of 0.914 ± 0.036. The parameters of P_Mean_Para and P_Mean_Exp_Data are also listed in Table 2.
Table 2.
Material parameters for the four fiber family model.
| Specimen | Material parameters
|
R2 | |||||||
|---|---|---|---|---|---|---|---|---|---|
| c (kPa) |
|
|
|
|
α0 | ||||
| 1 | 0.00E + 00 | 3.94E – 21 | 1.12E – 07 | 31.36 | 0.51 | 31.60 | 0.996 | ||
| 2 | 1.85E + 00 | 3.25E – 21 | 1.36E – 08 | 2.21 | 0.23 | 60.34 | 0.800 | ||
| 3 | 1.57E + 01 | 1.16E – 17 | 1.00E – 02 | 1.66 | 0.66 | 46.29 | 0.816 | ||
| 4 | 8.97E + 00 | 3.50E – 21 | 2.31E + 00 | 28.40 | 1.34 | 58.76 | 0.998 | ||
| 5 | 1.64E + 01 | 2.76E – 20 | 2.43E + 00 | 5.43 | 3.37 | 49.18 | 0.970 | ||
| 6 | 4.30E + 00 | 1.00E – 05 | 1.00E – 02 | 1.17 | 1.40 | 70.81 | 0.823 | ||
| 7 | 3.01E + 00 | 2.71E – 21 | 1.00E – 02 | 2.51 | 1.22 | 53.17 | 0.995 | ||
| Mean_Para | 7.18E + 00 | 1.43E – 06 | 6.82E – 01 | 10.39 | 1.25 | 52.88 | 0.914 | ||
| Standard error | 2.52E + 00 | 1.43E – 06 | 4.36E – 01 | 5.07 | 0.39 | 4.68 | 0.036 | ||
| Mean_Exp_Data | 1.30E + 00 | 2.23E – 17 | 1.87E – 08 | 28.88 | 0.91 | 42.03 | 0.998 | ||
Fig. 9 gives a comparison between the fits of the two parameter sets. The fit was excellent for the P_Mean_Exp_Data parameters in both the circumferential (solid line) and axial (long dash line) directions. In contrast, P_Mean_Para did not produce a desirable fit, underestimating the axial direction and largely overestimating the fibers in the circumferential direction.
Fig. 9.
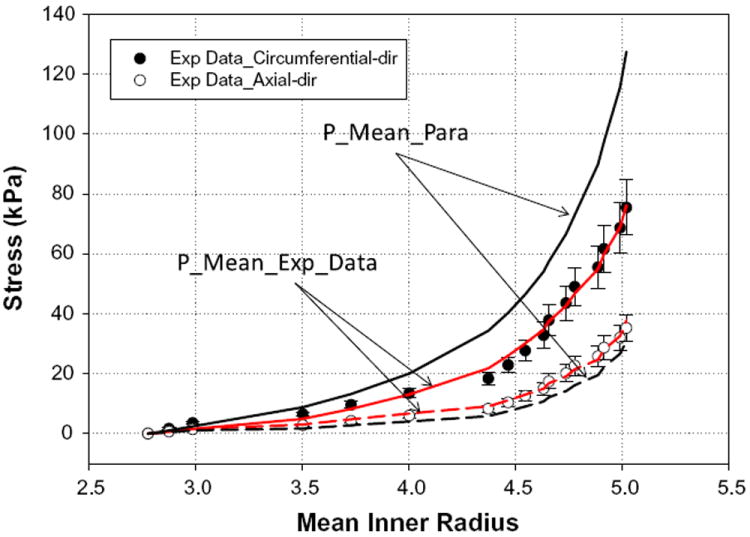
Fits of the mean experimental data for all seven specimens (P_Mean_-Exp_Data) and mean parameters obtained from averaging individual parameters (P_Mean_Para). Solid lines are the circumferential fits, while long dashed lines represent the axial fits. Fitting of the results shows that the parameters obtained from averaging the experimental data (P_Mean_Exp_Data) provided a better fit. Data are expressed as means ± standard error.
4. Discussion
Although the mechanical properties of arteries have been extensively studied, there are relatively few studies on the mechanical properties of venous tissues [20,21], and to our knowledge none on the CS vessel. This is probably because the CS has seldom been treated as a load-bearing tissue. Recent applications of PTMA devices in the treatment of MR utilize the CS as a host conduit for the deployment and function of such devices. It is thus important to quantify the mechanical properties of the CS so that CS tissue–device interactions can be better understood and the device failure observed by Webb et al. [12] can be avoided in the future.
In this study we observed that the CS pressure–diameter response was generally similar to many artery and vein responses [24-27]. The CS was very distensible at low pressures and became much stiffer at above physiological pressures (see Fig. 6a). However, the difference between the CS and other vessels observed in our histological study was the presence of a high content of SMF in the CS wall, with a relatively lower content of collagen, elastin and SMCs. Apparently, the structural constituents of the CS are very different to those of a typical vein or artery, in which collagen, elastin and SMCs are the main constituents. Similar findings of SMF layers covering the CS have been reported in anatomical studies of the human CS [15,16]. It has been argued that the CS might be a small cardiac chamber that joins the other four chambers at the level of the crux cordis [15]. The histological structure obtained from this study appears to concur that the CS may not be a cardiac vein but rather a structural extension of the right atrial chamber, because of the high content of SMF in the vessel wall.
The four fiber family model is an extension of Holzapfel’s two fiber family model [22], which has been successfully utilized to model various blood vessel tissues [28-31]. In general, this model can capture the CS mechanical responses well. The model and the associated parameters obtained in this study can be implemented in numerical simulations to further investigate the tissue–implant mechanical interactions. The material constants of the model obtained from fitting of the experimental data might not be unique. Multiple other sets of material constants may result in the same goodness of fit. The issue of determinability of constitutive models has recently been discussed by Criscione [32,33]. A new set of kinematic tensor bases proposed by Criscione [32] might have the potential to overcome the co-variance or co-alignment issues inherent in the kinematic variables of strain-invariant or Green strain-based formulations.
Typically, the modeling approach with tissue micro-structure considerations, based on the pioneering work by Lanir [34], has employed either discrete [22,35] or statistical distribution functions [36,37] to describe the orientations of tissue fibers. The four fiber family model utilizes an isotropic term for the tissue matrix substance and anisotropic terms for the fibers in four assumed fiber directions. For the isotropic term the parameter c represents the relative contribution of the extracellular matrix (ECM). The mean value of 1.3 kPa obtained in this study suggests that the isotropic ECM plays a significant role in CS wall responses. For anisotropic fiber responses we observed that c1,2 was close to 0. This indicates that axial and circumferential fibers made negligible contributions. However, fibers in the diagonal direction, represented by c3,4, appeared to be responsible for most of overall tissue mechanical responses. Since we did not determine the quantitative histology of the CS wall, a definitive correlation between the predicted model and actual fiber architectures cannot be established.
The response in the axial direction varied from contraction to extension at low to high stresses, respectively. As shown in Fig. 7, the initial decrease in axial stretch at low stress occurred simultaneously with a dramatic increase in the circumferential stretch. This behavior might be due to tissue incompressibility or volume preservation. However, as the CS wall consists of complex multilayer nonlinear, anisotropic tissue structures, coupling between the axial and circumferential directions could be more complex than that due to tissue volume preservation.
In our estimation of CS wall stressweutilized the ideal cylindrical model. However, the CS wall has an oval shape due to partial attachment to the surrounding myocardium (see Fig. 2a). During the inflation tests the average minor to major axis ratio of the CS vessel was 0.48 at 5 mm Hg, 0.7 at 20 mm Hg, 0.85 at 50 mm Hg and 0.93 at 80 mm Hg. Using the cylindrical model in data analysis is a way to represent the average stress in an oval shape. A precise estimation of stress in an oval shape should be as follows [38]: let m and n be the semi-axes of an oval shape, with n > m. The minimal and the maximal stresses in the oval shape are and , respectively, and the stress at the point x, y can be obtained as , where s is the arc length on the oval shape. From the cylindrical model we used , which is the mean value between the maximal and minimal stresses. Thus, the maximum error with the cylindrical model was , which is located at the minor and major axes of the oval shape. Based on the minor to major axis ratios during the inflation test, the maximum errors in the stress estimation were 26% at 5 mm Hg, 15% at 20 mm Hg, 7.5% at 50 mm Hg and 3.5% at 80 mm Hg. Converted into actual stress values they were 0.63, 1.78, 3.39 and 2.63 kPa at 5, 20, 50 and 80 mm Hg, respectively.
There are some limitations in this study. First, the sample size was small. We only performed experiments on seven porcine hearts. A larger number of specimens may provide more statistical power in analyzing the data. Also, the validity of extrapolation of the mechanical properties the of porcine CS to the human CS is currently unknown. A study of human CS tissue properties is currently ongoing in our laboratory. We hope that in the near future we could compare human and porcine data, and use them to explain why PTMA devices respond differently in animal and human clinical trials [11-13,39-41]. Lastly, we only studied the passive behavior of the CS. The in vivo observations by Barceló et al. [15] using digital cine CS angiography showed a reduction of the CS diameter during the cardiac cycle, with the maximal diameter being observed at ventricular systole, an intermediate diameter during diastole and the minimal diameter at atrial systole. This diameter change may be caused by active contraction of myocardial fibers or simply by pressure changes during the cardiac cycle. A further investigation of this phenomenon is necessary.
In conclusion, we have presented a biomechanical characterization of the porcine CS. Under 80 mm Hg pressure-only loading conditions the CS exhibited an S-shaped pressure–radius response and could be dilated by up to 88%. The model fitting results indicate that the four fiber family model can capture the experimental data well. By histological study we observed abundant SMFs covering the CS and also within the CS vessel wall, while SMCs were very few. Elastin and collagen fibers were highly concentrated in the luminal and outer layers of the CS wall, but sparsely distributed in the medial layer. In future studies we will conduct finite element analysis of the interaction between the CS vessel and a proximal stent, utilizing the mechanical properties of the CS obtained in this study. We may also conduct mechanical characterization of the human CS using cadaver tissues. Nonetheless, this study represents an early step towards a complete understanding of PTMA intervention and an analysis of the device failures observed in current clinical trials.
Acknowledgments
This work was supported in part by a NIH Predoctoral Fellowship, the University of Connecticut Research Foundation and American Heart Association SDG Grant 0930319N. The authors would like to thank Eric Sirois and Michael Harman for their help with the experiments and imaging processing.
Footnotes
Appendix A. Figures with essential color discrimination
Certain figures in this article, particularly Figures 1, 2, 3, 4, 5, 8 and 9, are difficult to interpret in black and white. The full color images can be found in the online version, at doi: 10.1016/j.actbio.2010.05.028.
Conflict of interest
The authors have no conflicts of interest related to this study.
References
- 1.Barzilai B, Gessler C, Perez J, Schaab C, Jaffe A. Significance of Doppler-detected mitral regurgitation in acute myocardial infarction. Am J Cardiol. 1988;61:220–3. doi: 10.1016/0002-9149(88)90919-8. [DOI] [PubMed] [Google Scholar]
- 2.Patel JB, Borgeson DD, Barnes ME, Rihal CS, Daly RC, Redfield MM. Mitral regurgitation in patients with advanced systolic heart failure. J Card Fail. 2004;10(4):285–91. doi: 10.1016/j.cardfail.2003.12.006. [DOI] [PubMed] [Google Scholar]
- 3.Enriquez-Sarano M, Avierinos J-F, Messika-Zeitoun D, Detaint D, Capps M, Nkomo V, et al. Quantitative determinants of the outcome of asymptomatic mitral regurgitation. N Engl J Med. 2005;352:875–83. doi: 10.1056/NEJMoa041451. [DOI] [PubMed] [Google Scholar]
- 4.Singh JP, Evans JC, Levy D, Larson MG, Freed LA, Fuller DL, et al. Prevalence and clinical determinants of mitral, tricuspid, and aortic regurgitation (The Framingham Heart Study) Am J Cardiol. 1999;83:897–902. doi: 10.1016/s0002-9149(98)01064-9. [DOI] [PubMed] [Google Scholar]
- 5.Lamas GA, Mitchell GF, Flaker GC, Smith SC, Jr, Gersh BJ, Basta L, et al. Clinical significance of mitral regurgitation after acute myocardial infarction. Survival and ventricular enlargement investigators. Circulation. 1997;96(3):827–33. doi: 10.1161/01.cir.96.3.827. [DOI] [PubMed] [Google Scholar]
- 6.Tcheng J, Jackman J, Nelson C, Gardner L, Smith L, Rankin S, et al. Outcome of patients sustaining acute ischemic mitral regurgitation during myocardial infarction. Ann Intern Med. 1992;117:18–24. doi: 10.7326/0003-4819-117-1-18. [DOI] [PubMed] [Google Scholar]
- 7.Trichon BH, Felker M, Shaw LK, Cabell CH, O’Connor CM. Relation of frequency and severity of mitral regurgitation to survival among patients with left ventricular systolic dysfunction and heart failure. Am J Cardiol. 2003;91:538–43. doi: 10.1016/s0002-9149(02)03301-5. [DOI] [PubMed] [Google Scholar]
- 8.Di Donato M, Frigiola A, Menicanti L, Boghdabi A, Badia T, Neagu A, et al. Moderate ischemic mitral regurgitation and coronary artery bypass surgery: effect of mitral repair on clinical outcome. J Heart Valve Dis. 2003;12(3):272–9. [PubMed] [Google Scholar]
- 9.Gillinov AM, Wierup PN, Blackstone EH, Bishay ES, Cosgrove DM, White J, et al. Is repair preferable to replacement for ischemic mitral regurgitation? J Thorac Cardiovasc Surg. 2001;122(6):1125–41. doi: 10.1067/mtc.2001.116557. [DOI] [PubMed] [Google Scholar]
- 10.Grossi EA, Goldberg JD, LaPietra A, Ye X, Zakow P, Sussman M, et al. Ischemic mitral valve reconstruction and replacement: comparison of long-term survival and complications. J Thorac Cardiovasc Surg. 2001;122(6):1107–24. doi: 10.1067/mtc.2001.116945. [DOI] [PubMed] [Google Scholar]
- 11.Dubreuil O, Basmadjian A, Ducharme A, Thibault B, Crepeau J, Lam JY, et al. Percutaneous mitral valve annuloplasty for ischemic mitral regurgitation: first in man experience with a temporary implant. Catheter Cardiovasc Interv. 2007;69(7):1053–61. doi: 10.1002/ccd.21186. [DOI] [PubMed] [Google Scholar]
- 12.Webb JG, Harnek J, Munt BI, Kimblad PO, Chandavimol M, Thompson CR, et al. Percutaneous transvenous mitral annuloplasty: initial human experience with device implantation in the coronary sinus. Circulation. 2006;113(6):851–5. doi: 10.1161/CIRCULATIONAHA.105.591602. [DOI] [PubMed] [Google Scholar]
- 13.Duffy SJ, Federman J, Farrington C, Reuter DG, Richardson M, Kaye DM. Feasibility and short-term efficacy of percutaneous mitral annular reduction for the therapy of functional mitral regurgitation in patients with heart failure. Catheter Cardiovasc Interv. 2006;68(2):205–10. doi: 10.1002/ccd.20810. [DOI] [PubMed] [Google Scholar]
- 14.Loukas M, Bilinsky S, Bilinsky E, El-Sedfy A, Anderson RH. Cardiac veins: a review of the literature. Clin Anat. 2009;22:129–45. doi: 10.1002/ca.20745. [DOI] [PubMed] [Google Scholar]
- 15.Barceló A, Fuente LMDL, Stertzer SH. Anatomic and histologic review of the coronary sinus. Int J Morphol. 2004;22(4):331–8. [Google Scholar]
- 16.Chauvin M, Shah DC, Haïssaguerre M, Marcellin L, Brechenmacher C. The anatomic basis of connections between the coronary sinus musculature and the left atrium in humans. Circulation. 2000;101:647–52. doi: 10.1161/01.cir.101.6.647. [DOI] [PubMed] [Google Scholar]
- 17.Kunzelman KS, Cochran RP, Verrier ED, Eberhart RC. Anatomic basis for mitral valve modelling. J Heart Valve Dis. 1994;3(5):491–6. [PubMed] [Google Scholar]
- 18.Prince JL, Links J. Medical imaging signals and systems. Englewood Cliffs, NJ: Prentice Hall; 2005. [Google Scholar]
- 19.Wicker B, Hutchens H, Wu Q, Yeh A, Humphrey J. Normal basilar artery structure and biaxial mechanical behaviour. Comput Methods Biomech Biomed Engin. 2008;11(5):539–51. doi: 10.1080/10255840801949793. [DOI] [PubMed] [Google Scholar]
- 20.Humphrey JD. Cardiovascular solid mechanics: cells, tissues, and organs. New York: Springer; 2002. [Google Scholar]
- 21.Fung YC. Biomechanics: mechanical properties of living tissues. New York: Springer Verlag; 1993. [Google Scholar]
- 22.Holzapfel GA, Gasser TC. A new constitutive framework for arterial wall mechanics and a comparative study of material models. J Elast. 2000;61:1–48. [Google Scholar]
- 23.Baek S, Gleason RL, Rajagopal KR, Humphrey JD. Theory of small on large: potential utility in computations of fluid–solid interactions in arteries. Comput Methods Appl Mech Eng. 2007;196:3070–8. [Google Scholar]
- 24.Monos E, Contney S, Cowley AJ, Stekiel W. Effect of long-term tilt on mechanical and electrical properties of rat saphenous vein. Am J Physiol. 1989;256(4 Pt 2):H1185–1191. doi: 10.1152/ajpheart.1989.256.4.H1185. [DOI] [PubMed] [Google Scholar]
- 25.Stooker W, Gok M, Sipkema P, Niessen H, Baidoshvili A, Westerhof N, et al. Pressure–diameter relationship in the human greater sapheneous vein. Ann Thorac Surg. 2003;76:1533–8. doi: 10.1016/s0003-4975(03)00896-8. [DOI] [PubMed] [Google Scholar]
- 26.Wesly R, Vaishnav R, Fuchs J, Patel D, Greenfield JJ. Static linear and nonlinear elastic properties of normal and arterialized venous tissue in dog and man. Circ Res. 1975;37(4):509–20. doi: 10.1161/01.res.37.4.509. [DOI] [PubMed] [Google Scholar]
- 27.Hayashi K, Mori K, Miyazaki H. Biomechanical response of femoral vein to chronic elevation of blood pressure in rabbits. Am J Physiol Heart Circ Physiol. 2002;284:H511–8. doi: 10.1152/ajpheart.00620.2002. [DOI] [PubMed] [Google Scholar]
- 28.Eberth JF, Taucer AI, Wilson E, Humphrey JD. Mechanics of carotid arteries in a mouse model of Marfan syndrome. Ann Biomed Eng. 2009;37(6):1093–104. doi: 10.1007/s10439-009-9686-1. [DOI] [PMC free article] [PubMed] [Google Scholar]
- 29.Gleason RL, Dye WW, Wilson E, Humphrey JD. Quantification of the mechanical behavior of carotid arteries from wild-type, dystrophin-deficient, and sarcoglycan-Î knockout mice. J Biomech. 2008;41(15):3213–8. doi: 10.1016/j.jbiomech.2008.08.012. [DOI] [PMC free article] [PubMed] [Google Scholar]
- 30.Hansen L, Wan W, Gleason RL. Microstructurally motivated constitutive modeling of mouse arteries cultured under altered axial stretch. J Biomech Eng. 2009;131(10):101015. doi: 10.1115/1.3207013. [DOI] [PMC free article] [PubMed] [Google Scholar]
- 31.Wicker BK, Hutchens HP, Wu Q, Yeh AT, Humphrey JD. Normal basilar artery structure and biaxial mechanical behaviour. Comput Methods Biomech Biomed Engin. 2008;11(5):539–51. doi: 10.1080/10255840801949793. [DOI] [PubMed] [Google Scholar]
- 32.Criscione JC. A constitutive framework for tubular structures that enables a semi-inverse solution to extension and inflation. J Elast. 2004;77(1):57–81. [Google Scholar]
- 33.Criscione JC. Kinematics framework optimized for deformation, growth, and remodeling in vascular organs. Biomech Model Mechanobiol. 2008;7(4):285–93. doi: 10.1007/s10237-007-0103-0. [DOI] [PubMed] [Google Scholar]
- 34.Lanir Y. A structural theory for the homogeneous biaxial stress–strain relationships in flat collageneous tissues. J Biomech. 1979;12:423–36. doi: 10.1016/0021-9290(79)90027-7. [DOI] [PubMed] [Google Scholar]
- 35.Holzapfel GA, Gasser TC. A viscoelastic model for fiber-reinforced composites at finite strains: continuum basis, computational aspects and applications. Comput Methods Appl Mech Eng. 2001;190(34):4379–403. [Google Scholar]
- 36.Gasser TC, Ogden RW, Holzapfel GA. Hyperelastic modelling of arterial layers with distributed collagen fibre orientations. J R Soc Interface. 2006;3(6):15–35. doi: 10.1098/rsif.2005.0073. [DOI] [PMC free article] [PubMed] [Google Scholar]
- 37.Sacks MS. Incorporation of experimentally-derived fiber orientation into a structural constitutive model for planar collagenous tissues. J Biomech Eng. 2003;125(2):280–7. doi: 10.1115/1.1544508. [DOI] [PubMed] [Google Scholar]
- 38.Fullers CE, Johnston WA. Applied mechanics. New York: John Wiley & Sons; 1919. Thin oval cylinder; pp. 467–70. [Google Scholar]
- 39.Condado JA, Velez-Gimon M. Catheter-based approach to mitral regurgitation. J Interv Cardiol. 2003;16(6):523–34. doi: 10.1046/j.1540-8183.2003.01052.x. [DOI] [PubMed] [Google Scholar]
- 40.Kaye DM, Byrne M, Alferness C, Power J. Feasibility and short-term efficacy of percutaneous mitral annular reduction for the therapy of heart failure-induced mitral regurgitation. Circulation. 2003;108(15):1795–7. doi: 10.1161/01.CIR.0000096051.23734.28. [DOI] [PubMed] [Google Scholar]
- 41.Maniu CV, Patel JB, Reuter DG, Meyer DM, Edwards WD, Rihal CS, et al. Acute and chronic reduction of functional mitral regurgitation in experimental heart failure by percutaneous mitral annuloplasty. J Am Coll Cardiol. 2004;44(8):1652–61. doi: 10.1016/j.jacc.2004.03.085. [DOI] [PubMed] [Google Scholar]


