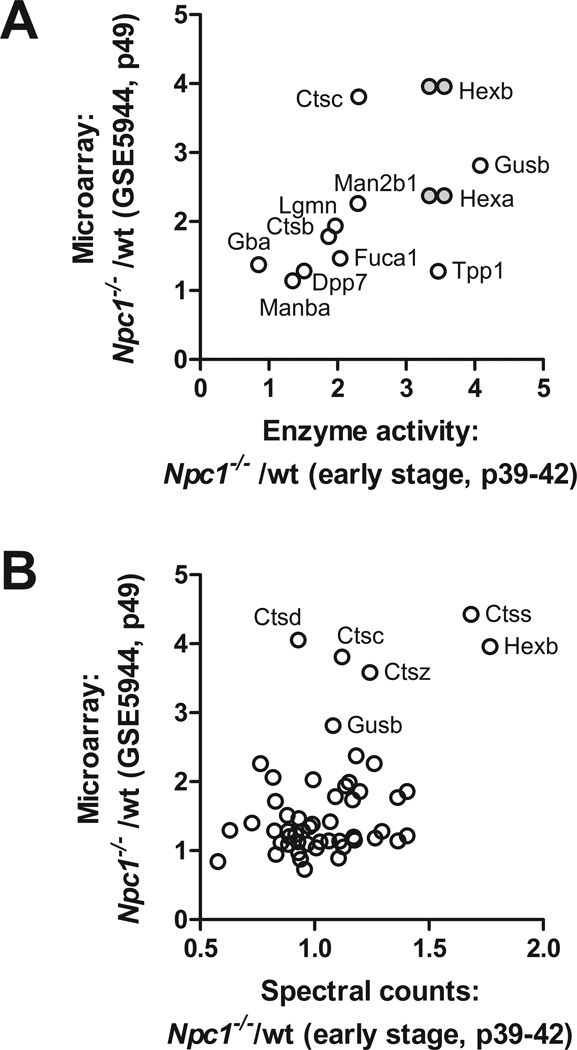
Figure 4. Relationship between lysosomal gene expression profiles and protein levels and activities in Npc1−/− mice.
Fold-change of Npc1−/− compared to wild-type as measured by transcription profiling was compared with fold-change of enzyme activity (Panel A) and relative protein levels estimated by spectral counting (Panel B). Note that in Panel A, transcription profile data for HexA and HexB (grey filled symbols) are plotted against both total β-hexosaminidase activity (i.e., HEXA/HEXB heterodimer and HEXB homodimer) and β-hexosaminidase A activity (HEXA/HEXB heterodimer).

