

Abstract
The deep cerebellar nuclei (DCN) convey the final output of the cerebellum and are a major site of activity-dependent plasticity. Here, using patch-clamp recording and two-photon calcium imaging in rat brain slices, we demonstrate that DCN dendrites exhibit three hallmarks of active amplification of electrical signals. First, they produce calcium transients with rise times of tens of milliseconds, comparable in amplitude and duration to calcium spikes in other neurons. Second, calcium signal amplitudes are undiminished along the length of dendrites to the farthest distances from the soma. Third, they can generate calcium signals even in the presence of tetrodotoxin, a sodium channel blocker that abolishes somatic action potential initiation. DCN calcium transients do require the action of T-type calcium channels, a common voltage-gated conductance in excitable dendrites. Dendritic calcium influx was evoked by release from hyperpolarization, peaked within tens of milliseconds, and was observed in both transient- and weak-rebound-firing neurons. In a survey across the DCN, transient-burst rebound firing, which was accompanied by the most rapid calcium flux, was more common in lateral nucleus than in interpositus nucleus and was not seen in medial nucleus. Rebound firing and calcium transients were not present in animals shipped 1–3 days before recording, a condition associated with elevated maternal and pup corticosterone and reduced pup body weight. Rebounds could be restored by the protein kinase C activator phorbol 12-myristate-13-acetate. Thus local calcium-based dendritic excitability supports a stage of presomatic amplification that is under regulation by stress and neuromodulatory influence.
Keywords: deep cerebellar nuclei, calcium spikes, active dendrites, cerebellum, T-type calcium channels, maternal stress, developmental sensitivity
the deep cerebellar nuclei (DCN) receive converging input streams from upstream cerebellar structures, the inferior olive, the mossy fibers, and Purkinje cells (PCs) of the cerebellar cortex, as well as neuromodulatory sources. As the cerebellum's sole conduit to other brain structures, the DCN are also a site of dynamic change and plasticity, which are thought to be essential for multiple forms of adaptive learning (Albus 1971; Barlow 2002; Ito 2012; Marr 1969). It is, therefore, of central importance in cerebellar research to know how DCN neurons integrate and process inputs.
Several forms of activity-dependent plasticity have been observed in DCN neurons, including potentiation of both excitatory inputs (Pugh and Raman 2006, 2008; Zheng and Raman 2010) and PC inhibitory inputs (Aizenman et al. 1998), as well as activity-dependent increases in firing excitability (Zhang et al. 2004). In each case, a key component of the induction mechanism is release from hyperpolarization, followed by increased spiking and/or burst firing.
Considerable progress in understanding the mechanisms of DCN spiking and bursting has come from intracellular and patch-clamp recording. A prominent feature of many DCN neurons is low-voltage-activated (LVA) T-type calcium conductance, which can support burst firing (Cain and Snutch 2010; Suzuki and Rogawski 1989). For full activation, T-type channels require hyperpolarization to remove inactivation (Carbone and Lux 1984; Llinás and Yarom 1981; Perez-Reyes 2003). Some DCN neurons fire a burst following inhibitory synaptic stimulation, release from hyperpolarization, or uncaging of GABA (Aizenman and Linden 1999; Alviña et al. 2009; Czubayko et al. 2001; Jahnsen 1986; Llinás and Mühlethaler 1988), and rebound bursts are blocked by T-type channel antagonists (Alviña et al. 2009; Boehme et al. 2011). Transient bursting (TB) neurons are associated with the rapidly gating Cav3.1 T-type channel isoform and are found predominantly in more lateral regions of the DCN, whereas weak bursters (WBs) preferentially express the slower gating Cav3.3 (Molineux et al. 2006, 2008). Rebounds also occur in awake rodents (Hoebeek et al. 2010), suggesting that a major role of T-type current is to support rebound excitation.
T-type calcium conductance is abundant in DCN dendrites, as demonstrated by immunostaining (Molineux et al. 2006) and calcium imaging (Gauck et al. 2001; Zhang et al. 2004). T-current is present in recordings from acutely prepared slices (Alviña et al. 2009; Boehme et al. 2011; Molineux et al. 2008) and a small fraction of neurons in slice culture (Muri and Knöpfel 1994), but not at all in isolated DCN neurons (Raman et al. 2000; Zheng and Raman 2009). Furthermore, rebound-associated calcium signals near the soma are small (Zheng and Raman 2009). These findings invite the possibility that DCN dendrites are capable of calcium-based excitation.
Since PC axons synapse most heavily on DCN dendrites (De Zeeuw and Berrebi 1995), where excitatory mossy fibers impinge (Chan-Palay 1977), local excitability is an attractive mechanism for shaping plasticity (Sjöström et al. 2008). Dendritic excitability would add an essential new component to learning models (Person and Raman 2010; Pugh and Raman 2006; Steuber et al. 2011). We, therefore, applied two-photon fluorescence calcium imaging and patch-clamp recording to better understand the conditions under which DCN dendrites are excitable.
MATERIALS AND METHODS
Slicing procedure.
All procedures were approved by the Princeton University Institutional Animal Care and Use Committee. Postnatal days 13–19 (P13–19) Sprague-Dawley rats (Charles River Laboratories, Wilmington MA) were anesthetized with isoflurane and decapitated. The cerebellum and brain stem were removed and immersed in ice-cold artificial cerebrospinal fluid (ACSF) containing the following (in mM): 126 NaCl, 3 KCl, 1 NaH2PO4, 25 NaHCO3, 20 d-glucose, 2 CaCl2, and 1 MgCl2 and oxygenated with 95% O2/5% CO2. The tissue block was transferred to a dissecting dish filled with ice-cold ACSF, the dura removed, and the brain stem severed at the peduncles. The remaining cerebellum was bisected sagittally through the vermis with a no. 21 blade scalpel (Fine Science Tools, Foster City, CA). Both halves were blotted with filter paper and mounted using cyanoacrylate glue on a Leica VT1000S vibratome (Nussloch, Germany) set to speed 1.0–2.5 and frequency 8–9. Sagittal slices 250- to 300-μm-thick were cut using ceramic blades (Lafayette Instrument, Lafayette, IN). Slices were taken at distances of 1.8–4.5 mm medial from the most lateral extreme of the paramedian lobule; the mediolateral slice location was defined using this distance. Slices were incubated for 45–60 min at 34°C and then brought to room temperature. Occasionally, P19 rats were sliced following the same procedure above, except that dissection and slicing were performed at 34°C as described in previous literature (Dingledine et al. 1980; Oertel 1983). This did not lead to systematic differences in recordings.
Locating cells within the deep nuclei.
To determine the location of recorded cells, each slice was imaged after recording using an Olympus BX51WI epifluorescence microscope with a MicroFire camera (Olympus, Center Valley, PA). The slice was transferred to a slide and mounted in ACSF. Filled cells were then photographed under epifluorescence, and 4–10 bright-field or dark-field images of the slice were obtained. These images were tiled, and the slice was aligned with the slice images in Fig. 2. Mediolateral locations were visually registered with Paxinos coordinates (Paxinos and Watson 1998), which are reported. Because the atlas was based on a fixed specimen of different age, coordinates are approximate and correspond to older animals. The border between the medial portion of the lateral nucleus and the interpositus nucleus could not be determined accurately because of the absence of histological landmarks in the parasagittal plane; cells in this region were assigned to the lateral nucleus (Czubayko et al. 2001).
Fig. 2.

Effects of shipping on burst firing and stress responses. A: RI plotted for each plane of section for animals shipped at postnatal days 7–8 (P7–8) and P13. Horizontal lines indicate the median. Inset: box and whisker plot of RI from recordings at 34°C grouped by shipping date. **P < 0.005, n = 57 P7–8, n = 26 P13. RI values for interpositus were greater than lateral nucleus in P13-shipped animals (P < 0.01, two-tailed test, corrected for multiple comparisons). Other nucleus-nucleus comparisons, including within P7–8-shipped animals, were not significant. B, left: maternal corticosterone levels in dams of P14 pups shipped 1 day (P13) or 1 wk (P7) previously. Middle: pup body weight. Right: the fraction of TBs under P7–8-shipped, P13-shipped, and after phorbol 12-myristate-13-acetate (PMA) treatment in P13-shipped animals. *P < 0.05, **P < 0.002, ***P < 10−4.
Electrophysiological recording and calcium imaging.
Slices were placed in an immersion recording chamber (Warner Instruments, Hamden, CT) at room temperature (∼21°C) or 34°C and perfused with ACSF at a rate of 2–4 ml/min. Cells from all three cerebellar nuclei were whole-cell patch-clamped (borosilicate pipettes, 2–8 MΩ) using a pipette solution containing (in mM) 133 methanesulfonic acid, 7.4 KCl, 0.3 MgCl2, 3 Na2ATP, 0.3 Na3GTP, and 0.02 EGTA, pH 7.3 with KOH, 290 mOsm. In some nonimaging experiments, EGTA was replaced with 0.2 mM Calcium Green-1 (Invitrogen, Carlsbad, CA). For reported imaging experiments, EGTA was replaced with 0.2 mM fluo-5F (Invitrogen, Carlsbad, CA). In some cases, 10–30 μM Alexa 594 or 568 (Invitrogen, Carlsbad, CA) was added. The calculated ECl was −75 mV at 34°C.
Cells that were accepted for recording fired tonically at zero injected current, generated overshooting spikes, and had access resistance of 2–10 times pipette resistance. Four cells that did not spike at zero current were accepted because their other whole cell parameters were otherwise within acceptable limits, and a subpopulation of glycinergic interneurons with this behavior has been reported to exist in the literature (Uusisaari and Knöpfel 2010). Several cells with input resistance of ∼80 MΩ were also accepted, as otherwise their behavior was indistinguishable from other cells in the dataset. Action potential width was calculated for each cell as the half-maximum-amplitude width of the average of more than eight peak-aligned spontaneous spikes.
Imaging was done on a custom two-photon microscope running ScanImage 3.6 software (Pologruto et al. 2003) by band (62.5 Hz) scanning. Before imaging, cells were loaded with calcium indicator dye for a minimum of 20 min and an average of 45 min to allow distal dendrites to fill. Scans were oriented to include one or more regions of the dendrite at once. Fine dendrites with diameter ∼1 μm were selected at distances spanning 22–374 μm from the center of the soma. Distance was measured along dendrites from maximum intensity projections of image stacks using the Simple Neurite Tracer plug-in for Fiji/ImageJ (Longair et al. 2011). For calculation of ΔF/F, the baseline fluorescence F was defined as the fluorescence at zero injected current.
Electrophysiological signals were recorded using an Axopatch 200B (2-kHz filtering) and digitized with National Instruments hardware controlled by IGOR Pro 6 (WaveMetrics, Lake Oswego, OR) using custom routines and the NiDAQ Tools package. In some cases, signals were recorded using a Multiclamp 700A amplifier, digitized with a Digidata 1320, and acquired using pCLAMP software (Molecular Devices, Sunnyvale, CA). All recordings were made in current clamp mode, with the exception of voltage pulses used to measure series and input resistance. TB neurons were defined as firing at least two spikes at >10 times the baseline firing rate after removal of a hyperpolarizing current step to lower than −70 mV of 200- to 1,000-ms duration (Molineux et al. 2006). The remaining neurons were classified as WBs if their maximum firing rate did not meet this criterion after successively negative hyperpolarizing steps down to −150 mV.
Pharmacology experiments and chemicals.
Chemicals were from Sigma-Aldrich, unless otherwise noted. NNC 55–0396 dihydrochloride (Tocris Bioscience, Ellisville, MO), tetrodotoxin (TTX), and kynurenate (Ascent Scientific, Princeton, NJ) were applied to slices by gravity perfusion.
For treatment with phorbol 12-myristate-13-acetate (PMA), slices were incubated in oxygenated ACSF containing 200–400 nM PMA at 37°C for 10 min, then transferred to the recording chamber. PMA was dissolved in dry DMSO at 1 mM, aliquoted, and stored at −80°C. Before use, aliquots were thawed and sonicated for 10 min and then added to ACSF immediately before incubating slices in PMA solution. Because PMA binding of PKC is irreversible, slices were used up to 8 h after PMA treatment.
Data analysis.
Electrophysiology and imaging data were analyzed using IGOR Pro and MATLAB 2008a (The Mathworks, Natick, MA) using custom-written routines. Membrane voltage was corrected postrecording for liquid junction potentials calculated using JPCalc (Molecular Devices, Sunnyvale, CA). All data reported in the text are means ± SD, unless otherwise specified. Error bars in Figs. 2 and 5 are displayed as SE.
Fig. 5.

Calcium transient amplitude and distance from the cell body. A: example in which proximal and distal regions (white circles) were imaged. Calcium transients, their derivatives, and membrane voltage are shown on right. Traces were obtained from distal location in gray and proximal location in black. B: ΔF/F plotted vs. distance from the soma in WBs (gray circles) and TBs (black circles). Lines are average of peak ΔF/F values averaged in 60-μm bins. C: ΔF/F data from B, normalized to the maximum within-cell ΔF/F, averaged in 40-μm bins. *P < 0.05.
Stress measurements.
After being housed in the animal facility for 8 days (P7 shipping condition) or 1 day (P13 shipping condition), P14 pups and their dams were weighed immediately before rapid unanesthetized decapitation and trunk blood collection. Whole blood was centrifuged for 20 min at 2,000 rpm at 4°C, and a further 10 min at 3,000 rpm. Supernatant was removed and frozen at −80°C for less than 1 mo before processing using the Coat-A-Count assay (Siemens, Los Angeles, CA), according to the manufacturer's standard procedure, except that the maximum 125I-corticosterone was calculated using a 1:10 diluted 125I-corticosterone solution in ddH2O. Because of the nonlinearity introduced by conversion to ng/ml corticosterone, statistical tests were performed on %bound values.
RESULTS
We recorded from acutely prepared cerebellar brain slices in 189 whole cell recordings from neurons of all three DCN. Three major subtypes of DCN neurons, large and small glutamate decarboxylase (GAD)-negative (presumptive glutamatergic) and GAD-positive (GABAergic) have previously been categorized based on parameters, including input resistance, action potential width, and the presence of a fast after-hyperpolarization (AHP) (Aizenman et al. 2003; Uusisaari et al. 2007). In the cells reported here, two of these measures were more strongly overlapping with the reported range for large, glutamatergic neurons than with that for GABAergic neurons: input resistance, which was 462 ± 364 MΩ in WBs and 386 ± 280 MΩ in TBs (Aizenman et al. 2003; Czubayko et al. 2001; Uusisaari et al. 2007) and spontaneous action potential half-width at 34°C, which was 0.5 ± 0.2 ms (interquartile range 0.4–0.7 ms) for TBs and 0.6 ± 0.3 ms (interquartile range 0.4–0.7 ms) for WBs. Fast AHPs, which can be found in some large glutamatergic neurons, but are absent in GABAergic neurons (Uusisaari et al. 2007), were present in 46% of TBs and 45% of WBs. Four neurons were included that did not fire at rest, typical of a subtype of glycinergic interneurons (Uusisaari and Knöpfel 2010). Thus all three measurements were indicative of a majority of large glutamatergic neurons.
The most striking electrophysiological characteristic of DCN neurons is the presence of rebound bursts in a subset of cells. DCN neurons could 1) resume their pre-hyperpolarization baseline firing rate; 2) transiently fire at an elevated rate; or 3) generate a rebound burst of two to six spikes at 50–600 Hz. In the case of a burst, the burst was often followed by an AHP lasting 70–140 ms (Fig. 1A, upper trace).
Fig. 1.

Firing properties of weak (WB) and transient burster (TB) deep cerebellar nuclei (DCN) neurons. A: voltage traces from a TB and WB. Cells were distinguished by their firing response after removal of hyperpolarization. B: maximum instantaneous firing rate (1/interspike interval) posthyperpolarization vs. average baseline rate for cells recorded at 21°C (open circles) and 34°C (filled circles). Cells in the shaded area [rebound index (RI) > 10, shaded area in gray] were defined as TBs. A unity line is plotted for reference in B and C. C: maximum instantaneous firing rate (1/interspike interval) averaged over a 300-ms window following hyperpolarization vs. baseline firing rate. Data are further subdivided by recording temperature.
DCN cells that fire rebound bursts have been termed TBs, and other cells termed WBs (Molineux et al. 2006). To quantify the transient nature of bursting, we classified neurons using a rebound index (RI) defined as the maximum instantaneous firing rate (1/minimum interspike interval) divided by the pre-hyperpolarization baseline firing rate. Nearly all DCN neurons (148 out of 151, 98%) had an RI > 1. Ninety-eight neurons were categorized as WBs (RI < 10), and 53 neurons were categorized as TBs (RI > 10; Fig. 1B). An alternate method of quantifying rebound is to calculate the firing rate averaged over the first 300 ms following removal of hyperpolarization (Zheng and Raman 2009) (Fig. 1C). However, this quantity did not significantly differ between TBs and WBs, supporting the need for RI for classification (Molineux et al. 2008; Uusisaari et al. 2007; for discussion see Boehme et al. 2011).
To test whether burst firing was enhanced at near-physiological temperature, we compared firing and rebound characteristics at 21°C (22 TBs, 30 WBs) and 34°C (31 TBs and 68 WBs). Across all recorded neurons, the zero-current firing rate was higher at 34°C (15.3 ± 10.6 Hz, range 2.5–60.8 Hz, n = 99) than at 21°C (12.0 ± 7.4 Hz, range = 2.4–39.5 Hz, n = 52; P < 0.05, two-tailed t-test), and input resistance was lower for TBs at 34°C but not WBs (see Table 1). In WBs, RI significantly decreased with increasing temperature (P < 0.05, two tailed t-test), while maximum post-hyperpolarization firing rate and baseline rate did not significantly vary with respect to temperature (nonsignificant, see Table 1). In TBs, RI increased with temperature (28 ± 18 at 34°C vs. 17 ± 5 at 21°C, P < 0.005, two-tailed t-test), as did the maximum post-hyperpolarization firing rate (295 ± 133 at 34°C, 151 ± 34 at 21°C, P < 10−5, two-tailed t-test), while the baseline rate did not differ significantly. All of these measurements indicate that depolarizing conductances and bursting tendencies were enhanced in TBs with increasing temperature.
Table 1.
Properties of recorded deep cerebellar nuclei neurons
| Parameters | WB | TB | Combined | PMA |
|---|---|---|---|---|
| 34°C | ||||
| n | 68 | 31 | 14 | |
| Zero-current firing rate, Hz | 16.3 ± 11.4 (3.6–60.8) | 13.0 ± 8.4 (2.5–39.3) | 15.3 ± 10.6 (2.5–60.8) | 9.4 ± 3.3 (6–16.5) |
| Maximum instantaneous rate, Hz | 46 ± 53 (6–345) | 295 ± 133 (48–588) | 160 ± 106 (19–417) | |
| Rebound index | 2.9 ± 2.1 (1.0–9.5) | 28.0 ± 18.3 (10.7–92.5) | 19.1 ± 17.1 (3.2–69.5) | |
| Input resistance, MΩ | 465 ± 370 (72–1,636) | 290 ± 198 (86–862) | 410 ± 335 (72–1,636) | 257 ± 181 (106–825) |
| ΔF/F (70–374 μm) | 105 ± 60 (−9–261) | 126 ± 87 (−17–411) | ||
| Median 20-80% rise, ms | 58 ± 44 (10–101) | 21 ± 16 (10–146) | ||
| t1/2 fall time, ms | 480 ± 484 (128–1,696) | 160 ± 89 (64–880) | ||
| 21°C | ||||
| n | 30 | 22 | ||
| Zero-current firing rate, Hz | 13.6 ± 8.9 (2.4–39.5) | 9.7 ± 3.9 (4.7–20.4) | 12.0 ± 7.4 (2.4–39.5) | |
| Maximum instantaneous rate, Hz | 65 ± 69 (5–227) | 151 ± 34.0 (91–213) | ||
| Rebound index | 4.1 ± 2.8 (1.1–9.0) | 16.8 ± 4.6 (10.2–24.1) | ||
| Input resistance, MΩ | 455 ± 356 (90–1,500) | 521 ± 326 (100–1,700) | 483 ± 342 (90–1,700) | |
Values reported for electrophysiological properties and %ΔF/F are means ± SD (with range in parentheses); n = 64 WB and 28 TB for electrophysiological data; for imaging n = 15 WB and 13 TB. 20-80% rise time and half-time (t1/2) fall time are reported as median ± estimated SD. WB, weak bursters; TB, transient bursters; PMA, phorbol 12-myristate-13-acetate; F, fluorescence.
Stress and neuromodulatory influences.
Prior literature is not consistent on the prevalence of bursting neurons. In lateral and interpositus nuclei, few large cells are reported to burst (Zheng and Raman 2009), yet the interpositus is also reported to be a location in which TBs are abundant (Engbers et al. 2011; Tadayonnejad et al. 2009). We observed that burst firing depended on the amount of time animals were housed before slice preparation. Comparing animals shipped to our facility at age P7–8 and recorded at 34°C (8.2 ± 1.0 days housed locally, 62 cells) with those shipped at P13 (2.2 ± 1.0 days housed locally, 26 cells), the RI distribution was shifted significantly higher for P7–8-shipped animals (Kolmogorov-Smirnov test, P < 0.005, Fig. 2A, inset). The input resistance of cells from P7–8-shipped and P13-shipped animals did not significantly differ (two-tailed t-test; data not shown). More TBs were found in the lateral nucleus in recordings from P7–8-shipped animals than P13-shipped animals (two-tailed t-test assuming unequal variance, P < 0.002, n = 57 cells, including 21°C data) (Fig. 2A). This difference was not significant in the interposed and medial nuclei (n = 44 P7–8 and n = 10 P13; nonsignificant, two-tailed t-test).
Brain signaling could be influenced by shipping via stress mechanisms, a signaling pathway that is known to mediate the effects of variations in maternal care (Meaney and Szyf 2005). Maternal blood corticosterone was nearly four times higher 1 day after shipping than it was 7 days after shipping (Fig. 2B) (426 ± 148 ng/ml compared with 115 ± 30 ng/ml, n = 2 dams each condition; P < 0.05, one-tailed t-test). P13-shipped pups weighed less than P7-shipped pups (29.9 ± 2.7 g compared with 31.7 ± 1.6 g, n = 19 pups each condition; P < 0.05, two-tailed t-test) and had higher blood corticosterone (59.0 ± 12.6 ng/ml compared with 51.5 ± 18.0 ng/ml, P < 0.05, one-tailed test on assay %bound corticosterone) (Fig. 2B). Taken together, these measurements quantify stress-related disruptions in both pups and dams associated with recent shipping.
To test if TB properties could be recovered in P13-shipped animals, we pretreated a subset of slices with the PKC activator PMA (200–400 nM) at 37°C for 10 min before transferring the slice to the recording chamber. PMA increases T-type currents in several preparations, including thalamic reticular neurons (Chemin et al. 2007; Joksovic et al. 2010). TBs were found more frequently in PMA-treated slices (10 out of 14 lateral and interpositus DCN neurons, Fig. 2B) compared with 9 out of 58 neurons from untreated slices (P < 10−4, one-tailed Fisher exact test) and 2 out of 14 neurons incubated in 0.04% DMSO vehicle at 37°C (P < 0.05). Thus neuromodulatory influence could counteract and rescue the effects of shipping-induced loss of the TB phenotype.
Anatomical distribution of burst firing.
The DCN project to different downstream targets (Buisseret-Delmas et al. 1998; Chan-Palay 1977; Ruigrok and Voogd 2000; Strick et al. 2009; Teune et al. 2000) and receive input from different microzones of cerebellar cortex (Andersson and Oscarsson 1978; Groenewegen et al. 1979; Oscarsson and Sjölund 1977; Sugihara and Shinoda 2004; Sugihara et al. 2009). Our large data set allowed us to classify firing differences as a function of anatomical location. We obtained recordings from the lateral nucleus (primarily ventral locations, especially pars compacta), the posterior interpositus, and the medial nucleus (Figs. 2A and 3). Among cells recorded from animals shipped at P7–8, TBs were heterogeneously distributed: 54% (24/44) of cells recorded in the lateral nucleus were TBs, compared with 40% (16/40) in the interpositus, and 0% (0/8) in the medial nucleus (Fisher 2 × 3 exact test, P = 0.01; Fig. 3).
Fig. 3.
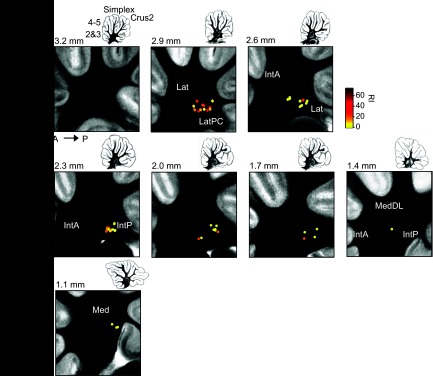
Location of WB and TB. Location are of cells recorded superimposed on photographs of 300-μm sagittal sections of living DCN slices arranged from lateral to medial. RI is indicated by color scale at top right. Drawings at top right of each image show the entire cerebellum at each plane of section. The dorsal-ventral and anterior-posterior axes are indicated. Numbers indicate approximate mediolateral distance of each section from the midline according to Paxinos and Watson (1998). Abbreviations: Lat, lateral nucleus; Lat-PC, lateral nucleus pars compacta; IntA, interpositus anterior; Med, medial nucleus; MedDL, medial nucleus, dorsolateral protuberance.
Dendritic calcium transients in DCN neurons.
To test whether burst-inducing stimuli elicited dendritic calcium spikes, neurons were loaded with the fluorescent calcium indicator 200 μM fluo-5F (KD = 1.0 μM) and imaged at band scan rates (16 ms/scan). In “transient hyperpolarization” experiments, cells were allowed to spike freely at zero injected current, hyperpolarized for 1 s, and returned to zero current (Fig. 4, A and B). The average membrane voltage during hyperpolarization was −80.7 ± 9.0 mV and did not significantly differ between WBs and TBs (nonsignificant, two-tailed t-test, n = 13 WBs, 14 TBs). Resting fluorescence F was defined under zero-currrent, freely spiking conditions. Peak fluorescence change was calculated from dendrites located 70–374 μm from the soma during the first 300 ms of the second zero-current period following hyperpolarization. Dendritic calcium transients were large both in TBs (126 ± 87% ΔF/F, interquartile range 64–188%; n = 13 cells, 61 measurements, coefficient of variation = 0.69) and in WBs (105 ± 60% ΔF/F, interquartile range 62 to 135%, n = 14 cells, 39 measurements; coefficient of variation = 0.57; Fig. 4). In cells in which two branches of the same dendrite were scanned, calcium signals were sometimes seen in one branch but not the other (data not shown). In summary (Fig. 4C), transient-hyperpolarization experiments demonstrated a continuum of dendritic response amplitudes, with WBs often generating calcium signals as large as those seen in TBs.
Fig. 4.

Calcium signals from WB and TB. A: calcium transients in WBs can be small (left black trace) or large (right black trace). The largest transients are found in TBs (right trace), although transients in these cells are not exclusively larger than those found in WBs (TBs, left trace). Time derivative of the calcium transient (gray traces) and concurrent membrane voltage are shown below the calcium traces. In TBs, calcium influx rates are larger. B: representative maximum intensity projection of a filled DCN neuron showing a representative imaging location. White circle indicates the region of dendrite scanned using 8-line, 16-ms band scans perpendicular to the dendrite axis (WB, left trace). Calcium measurements in A were made at a similar distance as the locations indicated in B. C: cumulative histogram of calcium transient amplitudes in TB (black trace) and WB neurons (gray trace) following hyperpolarizations below ECl (−75 mV) imaged at 70–374 μm from the soma. F, fluorescence.
We were able to identify 10 probable glutamatergic cells (spike half-width < 0.75 ms and the presence of a fast AHP) and 4 probable GABAergic cells (spike half-width >0.75, no fast AHP) in our imaging dataset. These groups were imaged over a comparable range of dendritic distances (glutamatergic 115 ± 72 μm, GABAergic 114 ± 82 μm) and membrane voltage during hyperpolarization (glutamatergic −79 ± 12 mV, GABAergic −77 ± 2 mV). The rebound-associated calcium influx was comparable between these two groups (glutamatergic 112 ± 57% ΔF/F, GABAergic 107 ± 29%), suggesting that dendritic calcium transients were present across DCN neuron subtypes.
The kinetics of dendritic calcium flux differed between TBs and WBs. In the subset of cells where rebound-associated calcium influx overshot baseline levels (n = 13 TBs, 13 WBs), calcium signals rose rapidly immediately following the removal of hyperpolarization (Fig. 4A, gray traces in second row), with a 20–80% rise time of 21 ± 16 ms in TBs (median ± estimated SD, range 10–146 ms) and 58 ± 44 ms in WBs (range 10–101 ms; P < 0.01, two-tailed t-test). Thus calcium influx occurred mainly over a few tens of milliseconds in both TBs and WBs, with WB influx occurring more slowly [Figs. 4 and 6, gray traces indicating d(%ΔF)/dt]. From peak values, calcium returned to pre-hyperpolarization baseline rapidly in TBs (t1/2 = 160 ± 89 ms, median ± estimated SD, range 64–880 ms), indicating that calcium influx had largely terminated after a few tens of milliseconds. In contrast, calcium declined considerably more slowly in WBs (t1/2 = 480 ± 484 ms, range 128–1696 ms; different from TBs, P < 0.05, two-tailed test), indicative of a prolonged calcium influx, as expected for Cav3.3 current (Iftinca et al. 2007; Molineux et al. 2008).
Fig. 6.
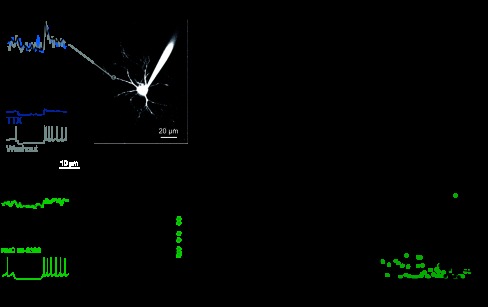
Pharmacological manipulation of dendritic calcium transients. A: transients and membrane voltage before (black trace), during (blue trace), and after (gray trace) application of 2 μM tetrodotoxin (TTX). B: ratio of ΔF/F after TTX application to ΔF/F before TTX plotted vs. distance from the soma (n = 10 cells). Black line is 6-point neighborhood average. C: transients and membrane voltage before (black trace) and after (green trace) application of 10 μM NNC 55–0396 (n = 8 cells). Graph on right shows the ratio of peak ΔF/F before to after NNC 55–0396 in TBs (green circles) and PMA-TBs (green triangles) for distances > 80 μm from the soma. D: ratio of ΔF/F after NNC 55–0396 application to ΔF/F before NNC 55–0396 plotted vs. distance from the soma. Black line is 6-point neighborhood average. E, left: firing patterns elicited by successive steps of hyperpolarization before NNC 55–0396 application, showing the intervals used to calculate minimum voltage and maximum instantaneous rate. Bursting occurs following hyperpolarization to low voltages (inset). F: post-hyperpolarization firing rates in TBs before (black) and after (green) NNC 55–0396 application. Cells were normalized to the minimum and maximum rates attained during trials (includes both NNC 55–0396 and baseline) and fit by a sigmoid. Voltages in F have been corrected for liquid junction potentials.
Low perisomatic calcium flux is a hallmark of WBs.
In other neuron types, calcium signals that depend on T-type calcium current are larger on distal dendrites than proximal dendrites (Crandall et al. 2010; Johnston and Delaney 2010). To assess spatial heterogeneity in calcium entry, we made measurements from multiple locations per dendrite in TBs and WBs (Fig. 5A). Measurements were made using eight-line band scans (16 ms/scan). The minimum voltage during hyperpolarization was −90 ± 10 mV. The average hyperpolarization was −83 ± 6 mV, and resting fluorescence F was defined under zero-currrent, freely spiking conditions.
We tested whether TB and WB neurons differed in their spatial pattern of calcium influx. During hyperpolarization, fluorescence decreased from pre-hyperpolarization levels by an average of −33 ± 18% ΔF/F from baseline (n = 14 cells, 39 regions) and reached a minimum of −49 ± 20% ΔF/F, consistent with previous reports (Zheng and Raman 2009). During rebound the peak fluorescence change increased to 127 ± 73% ΔF/F from baseline (range, 9–348%). In both TB and WB dendrites, calcium transients did not diminish with increasing distance from the soma (Fig. 5). WB neurons showed increasing signals with distance from the soma (Fig. 5B; ΔF/F correlated with distance, r = 0.69, n = 15, P < 0.01). For further analysis, data were normalized to the maximum ΔF/F within each dendrite (Fig. 5C). In WBs the normalized fluorescence change was significantly correlated with distance from the soma (r = +0.71, P < 0.005, n = 15 locations, 7 dendrites), whereas such a correlation was not significant in TBs (r = +0.31, P = 0.14, n = 23 locations, 10 dendrites). TBs had larger calcium transients than WBs at proximal locations (<40 μm; P < 0.05, n = 3 TBs, 4 WBs), but not at more distal locations (Fig. 5C). Thus a distinguishing feature of WBs was a relative absence of rebound-driven calcium flux near the soma.
The relatively smaller size of calcium transients near the soma could arise from lower per-membrane area flux, or by increased perisomatic dendrite diameter. Variation in surface-to-volume ratio could potentially mask trends such as a decrease in calcium flux density with distance from the soma. To begin with, this was unlikely because imaged dendrites were chosen to be uniformly small (2.4 ± 1.2 μm; n = 15 cells, 38 measurements). As a further test, the product of peak rebound-associated calcium signal with diameter was calculated. This quantity did not decrease with distance from the soma in either TBs or WBs, (WBs: r = +0.36, n = 15 locations, P = 0.9; TBs: r = +0.16, n = 23, P = 0.8). Thus any increased fluorescence signals at distal locations were likely to arise from increased calcium flux rather than narrowing of dendrites.
Dendritic calcium transients require T-type channels but not sodium channels.
Rebound-associated calcium influx could be mediated by T-type calcium conductance, which gates rapidly at low voltages (LVA) and can support regenerative spikes (Jahnsen and Llinás 1984); or by sodium-based action potentials, which activate high-voltage-activated L-type calcium conductance (Zheng and Raman 2009).
We blocked action potentials using the sodium channel blocker TTX (2–5 μM) during transient hyperpolarization experiments. Calcium transients persisted in the presence of TTX (7 WBs and 3 TBs). In TBs, the peak fluorescence was 136 ± 59% of the pre-TTX value (not different from 100%, P = 0.5; Fig. 6, A and B), and in WBs, calcium transients were 173 ± 149% of the pre-TTX value (not different from 100%, P = 0.3). The peak fluorescence was not diminished at any distances from the soma (Fig. 6B), with no change at distances greater than 80 μm from the soma (92 ± 60%) and enhancement at closer distances (264 ± 139%, n = 10; P < 0.005, two-tailed test), suggesting that, if anything, calcium-based excitability or prolonged calcium influx was increased perisomatically when sodium conductance was absent. Thus rebound-associated dendritic calcium transients did not require sodium-based action potentials in either TBs or in WBs.
To test for a requirement for LVA-type current, we used the mibefradil derivative NNC 55–0396, an irreversible blocker of T-type calcium current (Fig. 6, C and D). A concentration of 10–15 μM was used to selectively block T-type current (IC50 = 6.8 μM; Huang et al. 2004; Li et al. 2005) without affecting sodium current (50 μM; A. Fekete and K. R. Delaney, personal communication) or L-type current (100 μM; Huang et al. 2004; Li et al. 2005). In some neurons, spiking was inhibited at 15 μM NNC 55–0396; in these cases, imaging was performed 15–55 min after washout of drug, when spiking had returned.
Blockade of T-type channels was confirmed by the cessation of bursting (Alviña et al. 2009) during rebound from hyperpolarization (Fig. 6E, inset). Compared with a predrug peak firing rate of 297 ± 132 Hz following hyperpolarizations to voltages between −75 and −100 mV, after NNC treatment the peak firing rate was reduced to 25 ± 20 Hz, within the range of rebound firing rates in WB neurons (P = 0.1, Kolmogorov-Smirnov test). NNC also reduced firing rates in two WBs (from 59 ± 1 Hz to 13 ± 2 Hz for hyperpolarizations to an average of −87 mV; P < 0.05, paired two-tailed t-test, n = 2), consistent with a Cav3.3-dependent mechanism for rebound firing in WBs (Molineux et al. 2006). Across all cells the relationship between firing rate and pre-rebound hyperpolarization was flattened from an average rate of 0.58 ± 0.39 normalized to the within-cell range of minimum to maximum rates following hyperpolarization (Fig. 6F) to 0.06 ± 0.07 after drug treatment (paired t-test, P < 10−6, n = 8 cells). Calcium transients were strongly suppressed, reaching a peak of 26 ± 17% of the values measured before NNC application (Fig. 6, C and D) (P < 10−5, two-tailed t-test; n = 8, 2 WB and 6 TB cells). Fluorescence signals were reduced by NNC at all distances (Fig. 6D), an effect that deepened with increasing distance from the soma (Fig. 6C; r = −0.41 of ΔF/F ratio vs. distance, n = 22; P < 0.05, one-tailed linear correlation test). This spatial pattern is consistent with a larger role for sodium action potentials and/or L-type calcium entry in excitation at near-soma locations (Zheng et al. 2010). Taken together, these measurements show that, under rebound conditions, T-type conductance contributes a major part of dendritic calcium influx at distances of up to hundreds of micrometers from the cell body.
Distal calcium transients are relatively decoupled from firing rate.
If dendritic T-current supports soma-independent excitability, calcium influx at distal locations might be expected to be less correlated with transient firing rate. We imaged dendrites at distances between 28 and 317 μm from the soma during rebound from a range of hyperpolarizing voltages, which elicited burst firing frequencies from 4 to 491 Hz. Consistent with past perisomatic measurements (Zheng and Raman 2009), we found that maximum instantaneous firing rate was correlated with the size of the calcium transient at distances less than 130 μm from the soma (r = 0.57, P < 10−8, n = 96 measurements, 7 cells). At more distal locations the correlation was also significant (r = 0.30, P < 0.05; n = 51 measurements, 4 cells). Coupling with somatic firing was stronger near the soma than at distal locations (χ2 between correlation coefficients = 5.0, P < 0.05, Tukey post hoc test). Thus calcium-based excitability at distal dendritic locations is less coupled to somatic firing than at proximal locations.
DISCUSSION
The principal finding of this study is that DCN neuronal dendrites are capable of calcium-based excitation on a scale of tens of milliseconds. This mechanism was prominent in distal dendrites and required the action of T-type calcium channels, but not sodium channels. Calcium transients occurred in TB neurons, which were found in interpositus and lateral nuclei as well as in WB neurons. These findings indicate that dendrites are independently excitable compartments in most medium/large DCN neurons, with hyperpolarization as a key trigger.
Previous results demonstrated that calcium signals are seen in distal dendrites of TBs (Gauck et al. 2001; Zhang et al. 2004), but less often observed in the proximal dendrites of WBs exposed to shorter durations of hyperpolarization (Zheng and Raman 2009). Blocking sodium channels blocks the high-frequency firing during rebound in TBs, revealing an underlying waveform of transient depolarization mediated by T- or R-type, LVA calcium channels (Aizenman and Linden 1999; Alviña et al. 2009; Boehme et al. 2011; Llinás and Mühlethaler 1988; Molineux et al. 2008;). Our present findings suggest that these past observations reflect different aspects of a continuum, in which the amount and distribution of T-channels govern the occurrence of somatic burst firing and dendritic excitation in DCN neurons. In addition to the rapid calcium-based excitation we have analyzed, post-hyperpolarization rebound also includes a slower spike rate increase spanning several seconds, which may be supported by a persistent sodium current (Sangrey and Jaeger 2010).
The absence of TB firing in recently shipped pups suggests that deep nuclear excitability can be suppressed by the stress response. We found that, in the short term, shipping increased maternal corticosterone levels and reduced pup body weight, an indicator of maternal care. In rodent early postnatal life, brain development is sensitive to variations in mothering (Meaney and Szyf 2005). Stress hormones can act directly on the deep nuclei, which express both major corticosterone receptor types in the first two postnatal weeks (Lawson et al. 1992). Our findings can potentially account for the variability of reported TB firing in past literature. Alteration of deep nuclear function may also have long-term consequences, since disruption of maternal care can trigger long-lasting developmental effects (Gudsnuk and Champagne 2011). Indeed, in the case of cerebellar function, separation from the dam has been shown to increase glucocorticoid receptor expression in the interpositus nucleus by adulthood and impair eye-blink conditioning (Wilber et al. 2007).
Neuromodulation may also play a key role in regulating DCN dendritic excitability. The DCN is known to receive considerable neuromodulatory input (Chan-Palay 1977; Dieudonné 2001; Jaarsma et al. 1997). Neuromodulation can regulate T-type channel availability in other brain regions (Hildebrand et al. 2007, 2009; Johnston and Delaney 2010), and protein kinases upregulate T-type currents both in culture and in vitro (Chemin et al. 2007; Joksovic et al. 2010). In the case of recent shipping, the restoration of dendritic excitability by PKC activation suggests that, even when T-type channel availability is substantially reduced, modulatory mechanisms are strong enough to rescue function.
Rebound bursting in DCN neurons is challenging to evoke in brain slices, but may be more likely in vivo because of the presence of long-distance connections that are severed in slice preparation. Rebound bursting is evoked in vivo by olivary stimulation and by trains of stimulation to the cerebellar cortex (Bengtsson et al. 2011; Hoebeek et al. 2010). A major mechanism activated is the synchronous activation of many PCs, whose axons impinge principally on DCN dendrites (Chan-Palay 1977; De Zeeuw and Berrebi 1995). PCs release GABA and drive membrane potential toward ECl, and GABAergic activation can by itself drive rebounds (Alviña et al. 2009; Boehme et al. 2011). In brain slices, when hyperpolarization is driven by current injection at the cell body, T-type current activation and rebound firing are measurable when hyperpolarization reaches −72 mV (Engbers et al. 2011) and are larger when hyperpolarization goes below ECl (Alviña et al. 2008; Molineux et al. 2006; Zheng and Raman 2009). In either case, rebound is likely to be maximal when inhibition occurs locally on the dendrite near the site of excitability. Each DCN neuron has been estimated to receive 34–52 PC inputs (Person and Raman 2012), many of which may be transected in a slice, making it difficult to achieve high stimulation levels. Finally, climbing fiber collaterals may provide a source of excitation to provide an added concurrent boost to DCN dendrites in vivo.
All forms of plasticity in DCN neurons reported to date require removal of hyperpolarization and/or burst firing. Our work shows that a key consequence of hyperpolarization's removal is a rapid elevation of dendritic calcium, comparable to calcium spikes in other central nervous system neurons. Dendritic calcium elevation was observed in both TB and WB neurons, a principal difference being that calcium flux was distributed over a longer period in WB neurons. Calcium entry is required for long-term potentiation of both mossy fiber and PC synapses onto DCN neurons (Aizenman et al. 1998; Aizenman and Linden 2000; Pugh and Raman 2006, 2008; Zheng and Raman 2010). Our findings reconcile these findings with the observation that somatic spiking is insufficient to induce plasticity (Pugh and Raman 2006). Dendritic excitability may also work in conjunction with another suggestion in which hyperpolarization is thought to prevent L-type calcium influx that interferes with the induction of mossy fiber-LTP (Person and Raman 2010).
Our findings imply an essential role for synchrony in driving information processing in the olivocerebellar circuit, in which the inferior olive and its climbing fibers provide output to PCs and the DCN. Each climbing fiber innervates multiple PCs to evoke pan-dendritic calcium spikes (Llinás and Sugimori 1980; Tank et al. 1988) that are synchronized across many cells at once (Ozden et al. 2009, 2012; Sugihara et al. 1993; Welsh et al. 1995). PC calcium signals are thought to be an instructive signal for plasticity and are of comparable amplitude (Sarkisov and Wang 2008) to the signals we have observed in DCN neurons. Thus PCs and DCN neurons have two homologous features: climbing fiber input and spikelike dendritic calcium transients. Olivary activation generates DCN rebound bursts (Bengtsson et al. 2011; Hoebeek et al. 2010; Llinás and Mühlethaler 1988) and can drive cerebellar learning, such as classical eye-blink conditioning (Mauk et al. 1986). A tantalizing possibility for future study is the idea that climbing fibers and PCs can act in concert to influence plasticity via DCN dendritic signaling.
GRANTS
This work was supported by National Institute of Neurological Disorders and Stroke Grant R01 NS45193, National Science Foundation IBN-0347719, the Sutherland Cook Fund, the NJ Governor's Council on Autism (S. S.-H. Wang), National Institute of Drug Abuse Grant T90 DA022770 (E. R. Schneider), and the Robert Leet and Clara Guthrie Patterson Trust Fellowship in Brain Circuitry, Bank of America, Trustee (E. F. Civillico).
DISCLOSURES
No conflicts of interest, financial or otherwise, are declared by the author(s).
AUTHOR CONTRIBUTIONS
Author contributions: E.R.S., E.F.C., and S.S.-H.W. conception and design of research; E.R.S. and E.F.C. performed experiments; E.R.S., E.F.C., and S.S.-H.W. analyzed data; E.R.S., E.F.C., and S.S.-H.W. interpreted results of experiments; E.R.S. prepared figures; E.R.S. drafted manuscript; E.R.S., E.F.C., and S.S.-H.W. edited and revised manuscript; E.R.S., E.F.C., and S.S.-H.W. approved final version of manuscript.
ACKNOWLEDGMENTS
The authors thank Elizabeth Gould, Laura Lynch, J. Peter Rickgauer, Tim Schoenfeld, David Tank, and Stephan Thiberge for technical contributions and expert advice.
Present addresses: E. R. Schneider, Department of Cellular & Molecular Physiology, Sterling Hall of Medicine, B-Wing, 333 Cedar St., Room B133, Yale School of Medicine, New Haven, CT 06510; E. F. Civillico, Division of Physics, Office of Science and Engineering Laboratories, Center for Devices and Radiological Health, US Food and Drug Administration, 10903 New Hampshire Ave., Silver Spring, MD 20872.
REFERENCES
- Aizenman CD, Huang EJ, Linden DJ. Morphological correlates of intrinsic electrical excitability in neurons of the deep cerebellar nuclei. J Neurophysiol 89: 1738–1747, 2003 [DOI] [PubMed] [Google Scholar]
- Aizenman CD, Linden DJ. Regulation of the rebound depolarization and spontaneous firing patterns of deep nuclear neurons in slices of rat cerebellum. J Neurophysiol 82: 1697–1709, 1999 [DOI] [PubMed] [Google Scholar]
- Aizenman CD, Linden DJ. Rapid, synaptically driven increases in the intrinsic excitability of cerebellar deep nuclear neurons. Nat Neurosci 3: 109–111, 2000 [DOI] [PubMed] [Google Scholar]
- Aizenman CD, Manis PB, Linden DJ. Polarity of long-term synaptic gain change is related to postsynaptic spike firing at a cerebellar inhibitory synapse. Neuron 21: 827–835, 1998 [DOI] [PubMed] [Google Scholar]
- Albus JS. A theory of cerebellar function. Math Biosci 10: 25–61, 1971 [Google Scholar]
- Alviña K, Ellis-Davies G, Khodakhah K. T-type calcium channels mediate rebound firing in intact deep cerebellar neurons. Neuroscience 158: 635–641, 2009 [DOI] [PMC free article] [PubMed] [Google Scholar]
- Alviña K, Walter JT, Kohn A, Ellis-Davies G, Khodakhah K. Questioning the role of rebound firing in the cerebellum. Nat Neurosci 11: 1256–1258, 2008 [DOI] [PMC free article] [PubMed] [Google Scholar]
- Andersson G, Oscarsson O. Climbing fiber microzones in cerebellar vermis and their projection to different groups of cells in the lateral vestibular nucleus. Exp Brain Res 32: 565–579, 1978 [DOI] [PubMed] [Google Scholar]
- Barlow JS. The Cerebellum and Adaptive Control. Cambridge, UK: Cambridge University Press, 2002 [Google Scholar]
- Bengtsson F, Ekerot CF, Jörntell H. In vivo analysis of inhibitory synaptic inputs and rebounds in deep cerebellar nuclear neurons. PLoS One 6: e18822, 2011 [DOI] [PMC free article] [PubMed] [Google Scholar]
- Boehme R, Uebele VN, Renger JJ, Pedroarena C. Rebound excitation triggered by synaptic inhibition in cerebellar nuclear neurons is suppressed by selective T-type calcium channel block. J Neurophysiol 106: 2653–2661, 2011 [DOI] [PubMed] [Google Scholar]
- Buisseret-Delmas C, Angaut P, Compoint C, Diagne M, Buisseret P. Brainstem efferents from the interface between the nucleus medialis and the nucleus interpositus in the rat. J Comp Neurol 402: 264–275, 1998 [PubMed] [Google Scholar]
- Cain SM, Snutch TP. Contributions of T-type calcium channel isoforms to neuronal firing. Channels (Austin) 4: 475–482, 2010 [DOI] [PMC free article] [PubMed] [Google Scholar]
- Carbone E, Lux HD. A low voltage-activated calcium conductance in embryonic chick sensory neurons. Biophys J 46: 413–418, 1984 [DOI] [PMC free article] [PubMed] [Google Scholar]
- Chan-Palay V. Cerebellar Dentate Nucleus: Organization, Cytology and Transmitters. Berlin: Springer-Verlag, 1977 [Google Scholar]
- Chemin J, Mezghrani A, Bidaud I, Dupasquier S, Marger F, Barrère C, Nargeot J, Lory P. Temperature-dependent modulation of CaV3 T-type calcium channels by protein kinases C and A in mammalian cells. J Biol Chem 282: 32710–32718, 2007 [DOI] [PubMed] [Google Scholar]
- Crandall SR, Govindaiah G, Cox CL. Low-threshold Ca2+ current amplifies distal dendritic signaling in thalamic reticular neurons. J Neurosci 30: 15419–15429, 2010 [DOI] [PMC free article] [PubMed] [Google Scholar]
- Czubayko U, Sultan F, Thier P, Schwarz C. Two types of neurons in the rat cerebellar nuclei as distinguished by membrane potentials and intracellular fillings. J Neurophysiol 85: 2017–2029, 2001 [DOI] [PubMed] [Google Scholar]
- Dieudonné S. Serotonergic neuromodulation in the cerebellar cortex: cellular, synaptic, and molecular basis. Neuroscientist 7: 207–219, 2001 [DOI] [PubMed] [Google Scholar]
- Dingledine R, Dodd J, Kelly JS. The in vitro brain slice as a useful neurophysiological preparation for intracellular recording. J Neurosci Methods 2: 323–362, 1980 [DOI] [PubMed] [Google Scholar]
- Engbers JD, Anderson D, Tadayonnejad R, Mehaffey WH, Molineux ML, Turner RW. Distinct roles for I(T) and I(H) in controlling the frequency and timing of rebound spike responses. J Physiol 589: 5391–5413, 2011 [DOI] [PMC free article] [PubMed] [Google Scholar]
- Gauck V, Thomann M, Jaeger D, Borst A. Spatial distribution of low- and high-voltage-activated calcium currents in neurons of the deep cerebellar nuclei. J Neurosci 21: RC158, 2001 [DOI] [PMC free article] [PubMed] [Google Scholar]
- Groenewegen HJ, Voogd J, Freedman SL. The parasagittal zonation within the olivocerebellar projection. II. Climbing fiber distribution in the intermediate and hemispheric parts of cat cerebellum. J Comp Neurol 183: 551–601, 1979 [DOI] [PubMed] [Google Scholar]
- Gudsnuk KM, Champagne FA. Epigenetic effects of early developmental experiences. Clin Perinatol 38: 703–717, 2011 [DOI] [PubMed] [Google Scholar]
- Hildebrand ME, David LS, Hamid J, Mulatz K, Garcia E, Zamponi GW, Snutch TP. Selective inhibition of Cav3.3 T-type calcium channels by Galphaq/11-coupled muscarinic acetylcholine receptors. J Biol Chem 282: 21043–21055, 2007 [DOI] [PubMed] [Google Scholar]
- Hildebrand ME, Isope P, Miyazaki T, Nakaya T, Garcia E, Feltz A, Schneider T, Hescheler J, Kano M, Sakimura K, Watanabe M, Dieudonné S, Snutch TP. Functional coupling between mGluR1 and Cav3.1 T-type calcium channels contributes to parallel fiber-induced fast calcium signaling within Purkinje cell dendritic spines. J Neurosci 29: 9668–9682, 2009 [DOI] [PMC free article] [PubMed] [Google Scholar]
- Hoebeek FE, Witter L, Ruigrok TJ, De Zeeuw CI. Differential olivo-cerebellar cortical control of rebound activity in the cerebellar nuclei. Proc Natl Acad Sci U S A 107: 8410–8415, 2010 [DOI] [PMC free article] [PubMed] [Google Scholar]
- Huang L, Keyser BM, Tagmose TM, Hansen JB, Taylor JT, Zhuang H, Zhang M, Ragsdale DS, Li M. NNC 55–0396 [(1S,2S)-2-(2-{N-[(3-benzimidazol-2-yl)propyl]-N-methylamino}ethyl)-6-fluoro-1,2,3,4-tetrahydro-1-isopropyl-2-naphtyl cyclopropanecarboxylate dihydrochloride]: a new selective inhibitor of T-type calcium channels. J Pharmacol Exp Ther 309: 193–199, 2004 [DOI] [PubMed] [Google Scholar]
- Iftinca M, Hamid J, Chen L, Varela D, Tadayonnejad R, Altier C, Turner RW, Zamponi GW. Regulation of T-type calcium channels by Rho-associated kinase. Nat Neurosci 10: 854–860, 2007 [DOI] [PubMed] [Google Scholar]
- Ito M. The Cerebellum: Brain for an Implicit Self. Upper Saddle River, NJ: FT, 2012 [Google Scholar]
- Jaarsma D, Ruigrok TJ, Caffé R, Cozzari C, Levey AI, Mugnaini E, Voogd J. Cholinergic innervation and receptors in the cerebellum. Prog Brain Res 114: 67–96, 1997 [DOI] [PubMed] [Google Scholar]
- Jahnsen H. Electrophysiological characteristics of neurones in the guinea-pig deep cerebellar nuclei in vitro. J Physiol 372: 129–147, 1986 [DOI] [PMC free article] [PubMed] [Google Scholar]
- Jahnsen H, Llinás R. Ionic basis for the electro-responsiveness and oscillatory properties of guinea-pig thalamic neurones in vitro. J Physiol 349: 227–247, 1984 [DOI] [PMC free article] [PubMed] [Google Scholar]
- Johnston J, Delaney KR. Synaptic activation of T-type Ca2+ channels via mGluR activation in the primary dendrite of mitral cells. J Neurophysiol 103: 2557–2569, 2010 [DOI] [PubMed] [Google Scholar]
- Joksovic PM, Choe WJ, Nelson MT, Orestes P, Brimelow BC, Todorovic SM. Mechanisms of inhibition of T-type calcium current in the reticular thalamic neurons by 1-octanol: implication of the protein kinase C pathway. Mol Pharmacol 77: 87–94, 2010 [DOI] [PMC free article] [PubMed] [Google Scholar]
- Lawson A, Ahima RS, Krozowski Z, Harlan RE. Postnatal development of corticosteroid receptor immunoreactivity in the rat cerebellum and brain stem. Neuroendocrinology 55: 695–707, 1992 [DOI] [PubMed] [Google Scholar]
- Li M, Hansen JB, Huang L, Keyser BM, Taylor JT. Towards selective antagonists of T-type calcium channels: design, characterization and potential applications of NNC 55–0396. Cardiovasc Drug Rev 23: 173–196, 2005 [DOI] [PubMed] [Google Scholar]
- Llinás R, Mühlethaler M. Electrophysiology of guinea-pig cerebellar nuclear cells in the in vitro brain stem-cerebellar preparation. J Physiol 404: 241–258, 1988 [DOI] [PMC free article] [PubMed] [Google Scholar]
- Llinás R, Sugimori M. Electrophysiological properties of in vitro Purkinje cell dendrites in mammalian cerebellar slices. J Physiol 305: 197–213, 1980 [DOI] [PMC free article] [PubMed] [Google Scholar]
- Llinás R, Yarom Y. Electrophysiology of mammalian inferior olivary neurones in vitro. Different types of voltage-dependent ionic conductances. J Physiol 315: 549–567, 1981 [DOI] [PMC free article] [PubMed] [Google Scholar]
- Longair MH, Baker DA, Armstrong JD. Simple Neurite Tracer: open source software for reconstruction, visualization and analysis of neuronal processes. Bioinformatics 27: 2453–2454, 2011 [DOI] [PubMed] [Google Scholar]
- Marr D. A theory of cerebellar cortex. J Physiol 202: 437–470, 1969 [DOI] [PMC free article] [PubMed] [Google Scholar]
- Mauk MD, Steinmetz JE, Thompson RF. Classical conditioning using stimulation of the inferior olive as the unconditioned stimulus. Proc Natl Acad Sci U S A 83: 5349–5353, 1986 [DOI] [PMC free article] [PubMed] [Google Scholar]
- Meaney MJ, Szyf M. Environmental programming of stress responses through DNA methylation: life at the interface between a dynamic environment and a fixed genome. Dialogues Clin Neurosci 7: 103–123, 2005 [DOI] [PMC free article] [PubMed] [Google Scholar]
- Molineux ML, McRory JE, McKay BE, Hamid J, Mehaffey WH, Rehak R, Snutch TP, Zamponi GW, Turner RW. Specific T-type calcium channel isoforms are associated with distinct burst phenotypes in deep cerebellar nuclear neurons. Proc Natl Acad Sci U S A 103: 5555–5560, 2006 [DOI] [PMC free article] [PubMed] [Google Scholar]
- Molineux ML, Mehaffey WH, Tadayonnejad R, Anderson D, Tennent AF, Turner RW. Ionic factors governing rebound burst phenotype in rat deep cerebellar neurons. J Neurophysiol 100: 2684–2701, 2008 [DOI] [PubMed] [Google Scholar]
- Muri R, Knöpfel T. Activity induced elevations of intracellular calcium concentration in neurons of the deep cerebellar nuclei. J Neurophysiol 71: 420–428, 1994 [DOI] [PubMed] [Google Scholar]
- Oertel D. Synaptic responses and electrical properties of cells in brain slices of the mouse anteroventral cochlear nucleus. J Neurosci 3: 2043–2053, 1983 [DOI] [PMC free article] [PubMed] [Google Scholar]
- Oscarsson O, Sjölund B. The ventral spino-olivocerebellar system in the cat. I. Identification of five paths and their termination in the cerebellar anterior lobe. Exp Brain Res 28: 469–486, 1977 [DOI] [PubMed] [Google Scholar]
- Ozden I, Dombeck DA, Hoogland TM, Tank DW, Wang SSH. Widespread state-dependent shifts in cerebellar activity in locomoting mice. PLoS One 7: e42650, 2012 [DOI] [PMC free article] [PubMed] [Google Scholar]
- Ozden I, Sullivan MR, Lee HM, Wang SSH. Reliable coding emerges from coactivation of climbing fibers in microbands of cerebellar Purkinje neurons. J Neurosci 29: 10463, 2009 [DOI] [PMC free article] [PubMed] [Google Scholar]
- Paxinos G, Watson C. The Rat Brain in Stereotaxic Coordinates. San Diego, CA: Academic, 1998 [Google Scholar]
- Perez-Reyes E. Molecular physiology of low-voltage-activated t-type calcium channels. Physiol Rev 83: 117–161, 2003 [DOI] [PubMed] [Google Scholar]
- Person AL, Raman IM. Deactivation of L-type Ca current by inhibition controls LTP at excitatory synapses in the cerebellar nuclei. Neuron 66: 550–559, 2010 [DOI] [PMC free article] [PubMed] [Google Scholar]
- Person AL, Raman IM. Purkinje neuron synchrony elicits time-locked spiking in the cerebellar nuclei. Nature 481: 502–505, 2012 [DOI] [PMC free article] [PubMed] [Google Scholar]
- Pologruto TA, Sabatini BL, Svoboda K. ScanImage: flexible software for operating laser scanning microscopes. Biomed Eng Online 2: 13, 2003 [DOI] [PMC free article] [PubMed] [Google Scholar]
- Pugh JR, Raman IM. Potentiation of mossy fiber EPSCs in the cerebellar nuclei by NMDA receptor activation followed by postinhibitory rebound current. Neuron 51: 113–123, 2006 [DOI] [PubMed] [Google Scholar]
- Pugh JR, Raman IM. Mechanisms of potentiation of mossy fiber EPSCs in the cerebellar nuclei by coincident synaptic excitation and inhibition. J Neurosci 28: 10549–10560, 2008 [DOI] [PMC free article] [PubMed] [Google Scholar]
- Raman IM, Gustafson AE, Padgett D. Ionic currents and spontaneous firing in neurons isolated from the cerebellar nuclei. J Neurosci 20: 9004–9016, 2000 [DOI] [PMC free article] [PubMed] [Google Scholar]
- Ruigrok TJH, Voogd J. Organization of projections from the inferior olive to the cerebellar nuclei in the rat. J Comp Neurol 426: 209–228, 2000 [DOI] [PubMed] [Google Scholar]
- Sangrey T, Jaeger D. Analysis of distinct short and prolonged components in rebound spiking of deep cerebellar nucleus neurons. Eur J Neurosci 32: 1646–1657, 2010 [DOI] [PMC free article] [PubMed] [Google Scholar]
- Sarkisov DV, Wang SSH. Order-dependent coincidence detection in cerebellar Purkinje neurons at the inositol trisphosphate receptor. J Neurosci 28: 133–142, 2008 [DOI] [PMC free article] [PubMed] [Google Scholar]
- Sjöström PJ, Rancz EA, Roth A, Häusser M. Dendritic excitability and synaptic plasticity. Physiol Rev 88: 769–840, 2008 [DOI] [PubMed] [Google Scholar]
- Steuber V, Schultheiss NW, Silver RA, De Schutter E, Jaeger D. Determinants of synaptic integration and heterogeneity in rebound firing explored with data-driven models of deep cerebellar nucleus cells. J Comput Neurosci 30: 633–658, 2011 [DOI] [PMC free article] [PubMed] [Google Scholar]
- Strick PL, Dum RP, Fiez JA. Cerebellum and nonmotor function. Annu Rev Neurosci 32: 413–434, 2009 [DOI] [PubMed] [Google Scholar]
- Sugihara I, Fujita H, Na J, Quy PN, Li BY, Ikeda D. Projection of reconstructed single Purkinje cell axons in relation to the cortical and nuclear aldolase C compartments of the rat cerebellum. J Comp Neurol 512: 282–304, 2009 [DOI] [PubMed] [Google Scholar]
- Sugihara I, Lang EJ, Llinás R. Uniform olivocerebellar conduction time underlies Purkinje cell complex spike synchronicity in the rat cerebellum. J Physiol 470: 243–271, 1993 [DOI] [PMC free article] [PubMed] [Google Scholar]
- Sugihara I, Shinoda Y. Molecular, topographic, and functional organization of the cerebellar cortex: a study with combined aldolase C and olivocerebellar labeling. J Neurosci 24: 8771–8785, 2004 [DOI] [PMC free article] [PubMed] [Google Scholar]
- Suzuki S, Rogawski MA. T-type calcium channels mediate the transition between tonic and phasic firing in thalamic neurons. Proc Natl Acad Sci U S A 86: 7228–7232, 1989 [DOI] [PMC free article] [PubMed] [Google Scholar]
- Tadayonnejad R, Mehaffey WH, Anderson D, Turner RW. Reliability of triggering postinhibitory rebound bursts in deep cerebellar neurons. Channels (Austin) 3: 149–155, 2009 [DOI] [PubMed] [Google Scholar]
- Tank DW, Sugimori M, Connor JA, Llinás RR. Spatially resolved calcium dynamics of mammalian Purkinje cells in cerebellar slice. Science 242: 773–777, 1988 [DOI] [PubMed] [Google Scholar]
- Teune TM, van der Burg J, van der Moer J, Voogd J, Ruigrok TJ. Topography of cerebellar nuclear projections to the brain stem in the rat. Prog Brain Res 124: 141–172, 2000 [DOI] [PubMed] [Google Scholar]
- Uusisaari M, Knöpfel T. GlyT2+ neurons in the lateral cerebellar nucleus. Cerebellum 9: 42–55, 2010 [DOI] [PMC free article] [PubMed] [Google Scholar]
- Uusisaari M, Obata K, Knöpfel T. Morphological and electrophysiological properties of GABAergic and non-GABAergic cells in the deep cerebellar nuclei. J Neurophysiol 97: 901–911, 2007 [DOI] [PubMed] [Google Scholar]
- Welsh JP, Lang EJ, Suglhara I, Llinás R. Dynamic organization of motor control within the olivocerebellar system. Nature 374: 453–457, 1995 [DOI] [PubMed] [Google Scholar]
- Wilber AA, Southwood CJ, Sokoloff G, Steinmetz JE, Wellman CL. Neonatal maternal separation alters adult eyeblink conditioning and glucocorticoid receptor expression in the interpositus nucleus of the cerebellum. Dev Neurobiol 67: 1751–1764, 2007 [DOI] [PubMed] [Google Scholar]
- De Zeeuw CI, Berrebi AS. Postsynaptic targets of Purkinje cell terminals in the cerebellar and vestibular nuclei of the rat. Eur J Neurosci 7: 2322–2333, 1995 [DOI] [PubMed] [Google Scholar]
- Zhang W, Shin JH, Linden DJ. Persistent changes in the intrinsic excitability of rat deep cerebellar nuclear neurones induced by EPSP or IPSP bursts. J Physiol 561: 703–719, 2004 [DOI] [PMC free article] [PubMed] [Google Scholar]
- Zheng M, Wang Y, Kang L, Shimaoka T, Marni F, Ono K. Intracellular Ca(2+)- and PKC-dependent upregulation of T-type Ca(2+) channels in LPC-stimulated cardiomyocytes. J Mol Cell Cardiol 48: 131–139, 2010 [DOI] [PubMed] [Google Scholar]
- Zheng N, Raman IM. Ca currents activated by spontaneous firing and synaptic disinhibition in neurons of the cerebellar nuclei. J Neurosci 29: 9826–9838, 2009 [DOI] [PMC free article] [PubMed] [Google Scholar]
- Zheng N, Raman IM. Synaptic inhibition, excitation, and plasticity in neurons of the cerebellar nuclei. Cerebellum 9: 56–66, 2010 [DOI] [PMC free article] [PubMed] [Google Scholar]