Abstract
The role of microglia/ macrophages during neuroinflammation and neurodegenerative diseases remains controversial. To date, at least two activations states have been suggested consisting of a classical response (M1) and the alternative response (M2). Identifying selective biomarkers of microglia that representative their functional activation states may help elucidate disease course and understand repair mechanisms. Two cocktails containing either TNF-α, IL-12, and IL-1β (referred to as CKT-1) or IL-13 and IL-4 (referred to CKT-2) were injections into the hippocampus of mice aged 6, 12, or 24 months. Microarray analysis was performed on hippocampal tissue 3 days post injection. Gene transcripts were compared between CKT-1 versus CKT-2 stimulator cocktails. Several selective transcripts expressed for the CKT-1 included CXCL13, haptoglobin, MARCO, and calgranulin B, while a smaller subset of genes was selectively induced by the CKT-2 and consisted of FIZZ1, IGF-1, and EAR 11. Importantly, selective transcripts were induced at all ages by CKT-1, whereas selective gene transcripts induced by CKT-2 decreased with age suggesting an age-related reduction in the IL-4/ IL-13 signaling pathway.
Keywords: Microglia, Cytokines, Inflammation, Macrophage, Alternative Activation, Classical Activation, Microarray
1. Introduction
Microglia are typically viewed as tissue macrophages of the central nervous system, although their embryonic origin may be different from circulating monocytes (Chan, et al., 2007,Ginhoux, et al., 2010,Prinz, et al., 2011,Ransohoff and Cardona, 2010). Microglia constantly survey the CNS and, when necessary, clear cellular debris and contribute to tissue remodeling after CNS injury. They respond to environmental changes with a variety of activation states, differing in morphology and gene expression. Environmental signals such as cytokines, chemokines, and pattern recognition signals can regulate the activation state of the microglia (Morgan, et al., 2005) (Rivest, 2009) (Graeber, 2010).
Peripheral macrophages have been classified as having at least two polarized activation states consisting of classical (M1) and alternative (M2) activation states, analogous to the Th1 and Th2 activation states of T-cells (Mantovani, et al., 2004) (Gordon and Martinez, 2010). M1, or classical activation, is associated with elevations of IFN-γ, IL-1, IL-6, IL-12, and TNFα, and is often characterized as inflammatory. This response pattern causes pathogen destruction but can also result in tissue damage. M2, or alternative activation, is associated with elevations of IL-4 and/or IL-13. This response is associated with parasitic infections and tends to dampen the M1 activation response; in some circumstances this is associated with tissue remodeling and healing (Gordon, 2003) (Taylor, et al., 2005). Additionally, a regulatory macrophage state has recently been described, associated with cytokines such as IL-10 and immune complexes(Martinez-Pomares, 2003). (Tierney, et al., 2008) Although much of the literature supports polarized responses for peripheral macrophages, various activation states of microglia during CNS diseases are less well understood. For example, a recent report described roles for TNF-α in brain repair, preventing neuronal apoptosis, oligodendrocytic proliferation and remyelination of neurons (Arnett, et al., 2001,Park and Bowers, 2010). Microglial activation is prominent in neurodegenerative diseases such as Alzheimer’s and Parkinson’s (Akiyama, et al., 2000). In some circumstances, activated microglia are thought to promote the disease, and many attempts to diminish CNS inflammation have been attempted in Alzheimer’s patients, so far without benefit (Aisen, et al., 2000) (Aisen, et al., 2003) (Breitner, et al., 1995). In mouse models, a complex impact of microglial activation on amyloid versus tau pathology is being observed, with microglial activation by lipopolysaccharide, fractalkine receptor deletion or IL-1 overexpression benefiting amyloid pathology, yet exacerbating tau pathology (DiCarlo, et al., 2001) (Lee, et al., 2010) (Liu, et al., 2010) (Shaftel, et al., 2007). The studies described here were intended to address several questions. The first regarded the degree to which brain microglia express distinct M1 and M2 phenotypes after exposure to cytokine cocktails intended to elicit these phenotypes. The second regarded identification of additional markers to characterize the distinct phenotypes to better understand their role during disease progression. A final question was to determine the degree to which these responses vary over the lifespan of the mouse. Because neurodegeneration occurs on a background of brain aging, we felt that age-associated changes in the response of microglia to cytokine signals may help explain divergent results regarding the role of inflammation in young to middle-aged mouse models compared to the observations in aged human brain.
We chose two cocktails to begin the examination of microglial responses. The first was comprised of IL-1, IL-12 and TNFα. We specifically excluded IFN-gamma from this cytokine mixture for two reasons. The first is that IFN-gamma is a T cell product and T cells are not normally found in the brains of Alzheimer’s patients (Akiyama, et al., 2000). The second is that the response to IFN-gamma in preliminary studies to define cocktail constituents was so massive that no dose of M2 cocktail components could produce a comparable reaction. In order to permit comparisons, we opted to exclude IFN-gamma and induce the classical activation response with a combination of IL-1, IL-12 and TNFα. For the M2 cytokine cocktail, we used both IL-4 and IL-13. Although both appear to use the same signaling system and share receptors (Martinez, et al., 2009), we felt there might still be some unique responses to IL-13 that would be important to monitor.
2. Methods
2.1 Stereotaxic Intracranial Injections
All mice were non-transgenic mice derived from our breeding colony producing a mixed genetic background of 60% C57BL/6; 20% DBA, 10% SJL and 10% SW. Although arguments can be made in either direction, we felt this hybrid background, which we have bred stably for 12 years, may avoid well- described idiosyncratic macrophage responses associated with individual inbred mouse strains. The only selection in this breeding has been the elimination of the retinal degeneration mutation (rd1) contributed by SJL and SW lines. Young (6 months old), middle- aged (12 months), or aged (24 months) mice were injected bilaterallay with 2 µl/ site (4 sites in total; 8µl in total) of an M1 cytokine cocktail (CKT-1) containing TNF-α (667ng), IL-12 (26ng) and IL-1β (26ng), with an M2 cytokine cocktail (CKT-2) containing IL-4 (800ng) and IL-13 (240ng), or with vehicle control (phosphate-buffered saline). The cytokine concentrations represent total mass deliver in 8µl. Mice were injected with a 10 µl Hamilton syringe with a 26 gauge needle in the right and left cortex and in the right and left hippocampus. The bilateral hippocampus and anterior cortex paradigm was used to generate a greater overall repsonse to the activation profile versus a single injection. Based on previous determinations we found that bilateral injections into the hippocampus and anterior cortex produces a greater overall activation response than single or unilateral injections. Previously determined coordinates from bregma were as follows: frontal cortex, anteroposterior, +1.7 mm, lateral, ±2.5 mm, vertical, −3.0 mm; hippocampus, anteroposterior, −2.7 mm; lateral, ±2.7 mm, vertical, −3.0 mm. The solution was dispensed at a constant rate of 0.5 µl/ min.
2.2 Tissue Collection and Histochemical Procedures
Three days after cytokine injections, mice were weighed and injected with 100mg/kg of pentobarbital. Mice were then intracardially perfused with 25 ml of 0.9% saline. The brain was removed, the right hemisphere was dissected on ice and frozen at −80°C, and the left hemisphere was immersion fixed in 4% paraformaldehyde in 100 mM PO4 buffer (pH 7.4) for 24 hours. The tissue was cryoprotected in a series of 10%, 20% and 30% sucrose solutions. Horizontal sections were cut at 25 µm using a sliding microtome and stored at 4°C in Dulbecco’s phosphate buffered saline containing 100 mM sodium azide for immunohistochemistry.
2.3 Microarray Analysis and Quantitative Real-Time PCR (qRT-PCR)
Total RNA was extracted from mouse hippocampus (15–30 mg wet tissue) using rotor-stator emulsification (Tissuemizer) and applied to the RNeasy mini-spin columns kit (Qiagen, Valencia, CA, USA) followed by DNase treatments to removed genomic DNA. All total RNA was reverse transcribed using the Superscript II kit (Invitrogen, Carlsbad, CA, USA) following manufacturer’s protocol. For microarray analysis only, an aliquot of total mRNA from two mice of the same group and same age was pooled together for a total of 1 µg per sample yielding three samples per treatment group. Ocean Ridge Biosciences performed microarray analysis. Arrays were subjected to slide format with a total of 38, 467 spots. Raw data was filtered to remove manufacturer and visual QC flags resulting in 38, 338 spot intensities. Raw data was background subtracted, Log2 transformed and normalized resulting in 34, 954 mouse probes. After true positive thresholds (TPTs) were calculated from negative control probe data, spiking controls, and constitutive mouse probes, 18, 899 mouse probes scored above threshold from at least one group. Probes were ranked by false discovery rate (FDR) with corrected P values using ANOVA with Bayesian Error Model. A total of 2, 851 probes were significant at FDR<0.05.
2.4 Functional Analysis
To determine which gene transcripts and pathways were significantly regulated (up/ down regulated), data were uploaded and analyzed by Ingenuity Pathway Analysis software (IPA 6.0; Ingenuity Systems, www.ingenuity.com). Genes from the entire dataset from all ages represented in a log2 scale that met the FDR<0.05 cutoffs were considered for analysis. Additionally, heat maps and cluster analysis were generated using Genesis Software (version 1.7.2). The genes with the greatest difference (log2 scale) between groups (a separate analysis for each age) were uploaded into the Genesis software to generate heat maps and Hierarchical Clustering Analysis using average linkage clustering parameters. The top ten transcripts that were up regulated and down regulated from each cytokine cocktail compared to the vehicle-treated group from the Ingenuity Pathway Analysis were up-loaded into Genesis software to generate heat expression maps.
Total RNA from each mouse (sample size of 6 per group) was subjected to qRT-PCR. A standard curve was established within the qRT-PCR reaction by adding total RNA from an intra-experimental mouse RNA pool spanning three logs of dynamic range in separate wells to verify linearity of the RT-PCR reaction. Two mass quantities of total RNA (either 5 or 10ng) from all samples were subjected to RT-PCR reactions for comparison with the standard curve. Qiagen’s QuantiTect primer assays® target gene primers (see Table 1. for catalogue information) were purchased and used with SYBR Green-based real-time qRT-PCR (Qiagen, Valencia, CA, USA). The qRT-PCR was performed as follows; one cycle of 95°C/5 min, 95°C/30sec and 60°C/1 min followed by 40 amplification cycles of 95°C/30 s. Although primer pairs were considered validated; we performed additional melt curve analysis. The melting curve readings were performed for every 1°C at 56–99°C / holding for 1 sec between readings. The Opticon2 TM, Real Time PCR System (Version 4.3, Bio-Rad, Hercules, CA, USA) was used to detect the amplification products. None of the primers used demonstrated more than 1 peak of fluorescence from melt curve analysis. The standard curve was calculated by plotting the average threshold cycle (ΔCT) against the log nanogram quantity of RNA added to the RT-PCR reactions (Nolan, et al., 2006). A linear regression was performed and the slope of the standard curve was used to calculate the mass quantity of standard RNA in each sample. The mass values for the genes of interest were then expressed as a ratio of target gene to GAPDH. To confirm that GAPDH remained unchanged in response to cocktail treatments, we additionally performed RT-PCR on the 18S transcript for comparison of several gene transcripts and verified that GAPDH remained unchanged during experimental manipulations. Differential expression between treatments was compared using one-way ANOVA (Stat View 5.0. Cary, NC). Graphs were generated using GraphPad Prism 4.0 (www.graphpad.com) and KaleidaGraph 4.0 (Synergy Software, Reading PA, www.synergy.com, www.kaleidagraph.com)
Table 1.
Primers Used for qRTPCR
| Gene | Source | Catalogue Numer |
|---|---|---|
| CXCL13 | Qiagen | QT00107917 |
| S100A8 | Qiagen | QT01749958 |
| S100A9 | Qiagen | QT00105252 |
| CCL5 | Qiagen | QT01747165 |
| TIMP1 | Qiagen | QT00996282 |
| MARCO | Qiagen | QT00102004 |
| CHI3L3 | Qiagen | QT00108829 |
| IGF1 | Qiagen | QT00154469 |
| RETNLA | Qiagen | QT00254359 |
| ARG1 | Qiagen | QT00134288 |
| EAR11 | Qiagen | QT00266959 |
| ERDR1 | Qiagen | QT00318577 |
| 18S | Qiagen | QT01036875 |
| GAPDH | Qiagen | QT01658692 |
2.5 Immunohistochemistry/ Immunofluorescnce
Immunohistochemistry was performed on free-floating sections as described in detail previously (Gordon, et al., 2002). Sections were incubated with primary antibodies rat anti-mouse CD45, rat anti-mouse MARCO (macrophage receptor with collagenous structure), rat anti-mouse F4/80, rat anti-mouse FcγRII/III (Serotec, Raleigh, NC), rat anti-major histocompatibility complex –II (MHCII; BD Pharmigen), rabbit anti-mouse chitinase 3-like-3 (YM1; StemCell Technologies, Vancouver, Canada), rabbit anti- mouse Fizz1 (found in inflammatory zone 1) (Peprotech Inc. Rocky Hill, NJ), goat anti-s100A8 (calgranulin A) and goat anti-s100A9 (calgranulin B) (R&D systems, Minneapolis, MN), chicken anti-arginase-1 (gifted by Dr. Sydney M. Morris, University of Pittsburg School of Medicine) overnight at 4°C, then incubated in the appropriate biotinylated secondary antibody (VectorLabs, Burlingame, CA) for 2h, followed by a 1 hr incubation in avidin-biotin complex reagent. Color development was performed using 3,3'-diaminobenzidine (Sigma, St. Louis, MO) enhanced with nickelous ammonium sulfate (J. T. Baker Chemical Company, Phillipsburg, NJ). For immunofluoresce secondary antibodies Alexa anti-rat-488, Alexa anti-chicken 488, Alexa anti-goat 594, Alexa anti-rabbit 594. Sections were mounted with VectaShield Hardset with DAPI (VectorLabs, Burlingame, CA). Immunofluorescent images were taken with scanning confocal microscope (Fluoview, Olympus).
3. Results
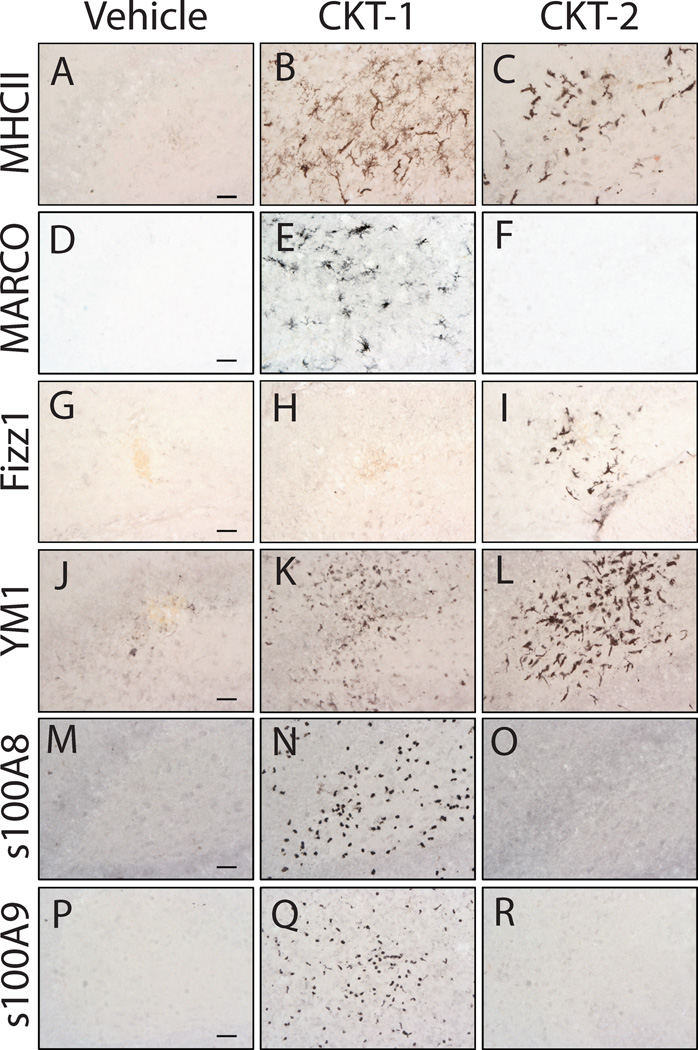
All studies used intracranial injections of either the CKT-1 or CKT-2 cocktails bilaterally into the hippocampus and anterior cortex to increase the total amount of cytokines and the activation response in the CNS. We aimed to mount a similar activation response between both cocktails by use of a general maker (i.e. MHCII, Fig. 3 A), and from previous experiments we found that multiple injections (bilateral hippocampus and anterior cortex) lead to a greater activation response overall. Following intracranial injections, hippocampal tissue from one hemisphere was collected for measurement of RNA 3 days post injection and the other hemisphere was used for immunohistochemistry.
Figure 3.
Photomicrographs of immunohistochemical stains for microglia/ macrophage markers in 6-month-old mice that received cytokine cocktails. Mice were treated intracranially with vehicle (PBS) (Panels A, D, G, J, M, P), CKT-1 (IL-1β, IL-12, TNF-α) (Panels B, E, H, K, N, Q), and CKT-2 (IL-4, IL-13) (Panels C, F, I, L, O, R). Images were centered on the injection sites and stained for MHCII (A–C), MARCO (D–F), FIZZ-1 (G–I), YM1 (J–L), s100A8/ calgranulin A (M–O), and s100A9/ calgranulin B (P–R). MHCII and YM1 were both increased by CKT-1 and CKT-2. Selective induction of MARCO, s100A8 and s100A9 was observed by CKT-1, whereas CKT-2 selectively induced FIZZ1. Scale bar= 25µm.
3.1 Results of Microarray Analysis in Mice after Cytokine Cocktails for Classical and Alternative Activation Responses
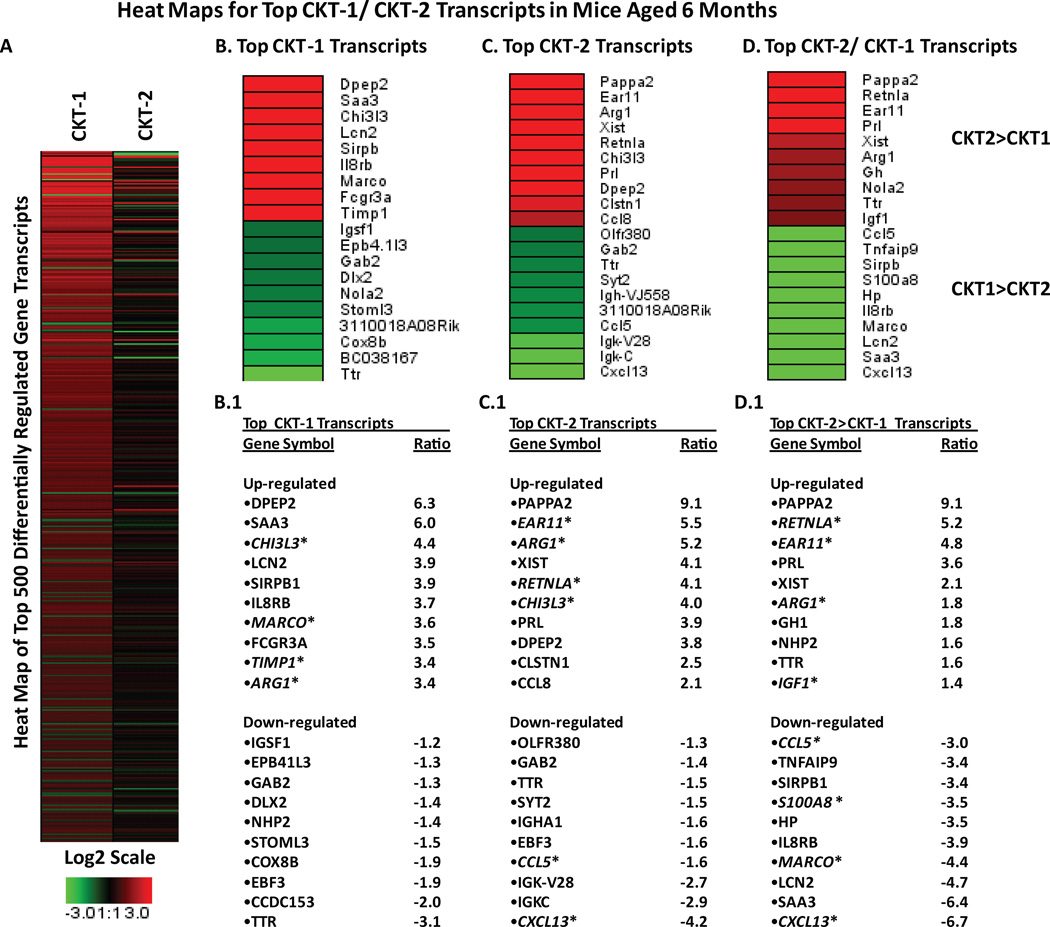
We performed microarray analysis on hippocampal RNA from 6 months old mice following cytokine cocktails designed to elicit bias towards a classical (M1) or an alternative (M2) activation state in the CNS. One goal of this analysis was to confirm existing M1 versus M2 selective markers in brain microglia and possibly identify others not previously recognized or unique to the CNS. Gene transcripts were compared between vehicle, M1 (CKT-1) and M2 (CKT-2) stimulator cocktails. In order to narrow gene candidates, we restricted our analysis to transcripts that were increased or decreased at least 2- fold by the CKT injections. Ingenuity pathway analysis generated 10 of the top gene transcripts that were up regulated and down regulated within three pair-wise comparisons (vehicle vs. CKT-1; vehicle vs. CKT-2; CKT-1 vs. CKT-2). Heat expression maps were generated for the top ten up-regulated and down-regulated transcripts and for cluster analysis of the 50 gene transcripts with the largest changes. In Figure 1A, CKT-1 showed a greater increased expression profile among the top 500 significantly changed gene transcripts compared to CKT-2. Furthermore, analysis showed several top transcripts (Fig. 1 B-B.1) that increased following CKT-1 compared to vehicle at 6mo included SAA, DPEP2, CHI3L3, LCN2, SIRPB1, IL8RB, MARCO, TIMP1, ARG1, whereas those reduced were TTR, EBF3, COX8B, STOML3, GAB2, and DXL2. Following CKT-2, some top and re-occurring transcripts that increased compared to vehicle were EAR11, ARG1, DPEP2, RETNLA, CHI3L3, AND CCL8, whereas those that were down- regulated by CKT-2 included CXCL13, CCL5, EBF3, TTR, SYT2, and GAB2 (Fig 1 C-C.1). Gene transcripts that were regulated similarly by CKT-1 and CKT-2 included DPEP2, CHI3L3, ARG1, GAB2, EBF3, and TTR. Importantly, increased gene transcripts with the largest difference in regulation between CKT-1 and CKT-2 were RETNLA, EAR11, IGF1, CXCL13, SAA3, LCN2, MARCO, IL8RB, S100A8, HP, SIRPB1, TNFAIP9, and CCL5 at 6mo (Fig. 2 D-D.1).
Figure 1.
Heat map of selected genes displaying expression levels from microarray analysis in 6-month-old mice that received cytokine cocktails. [A] Represents top 500 gene transcripts differentially regulated by CKT-1 (TNF-α, IL-1β, IL-12) or CKT-2 (IL-4, IL-13) compared to vehicle (PBS). Overall, more transcripts were changed by the CKT-1 cocktail. [B, C, D] Represent heat expression maps for the top 20 gene transcripts significantly up (red) or down (green) regulated from Ingenuity pathway analysis. [B.1, C.1, D.1] displaying gene symbols and expression values (Log2 scale). Panels [B, B.1] represent CKT-1 compared to vehicle, [C, C.1] represents CKT-2 compared to vehicle, [D, D.1] represent CKT-2 compared to CKT-1.
Figure 2.
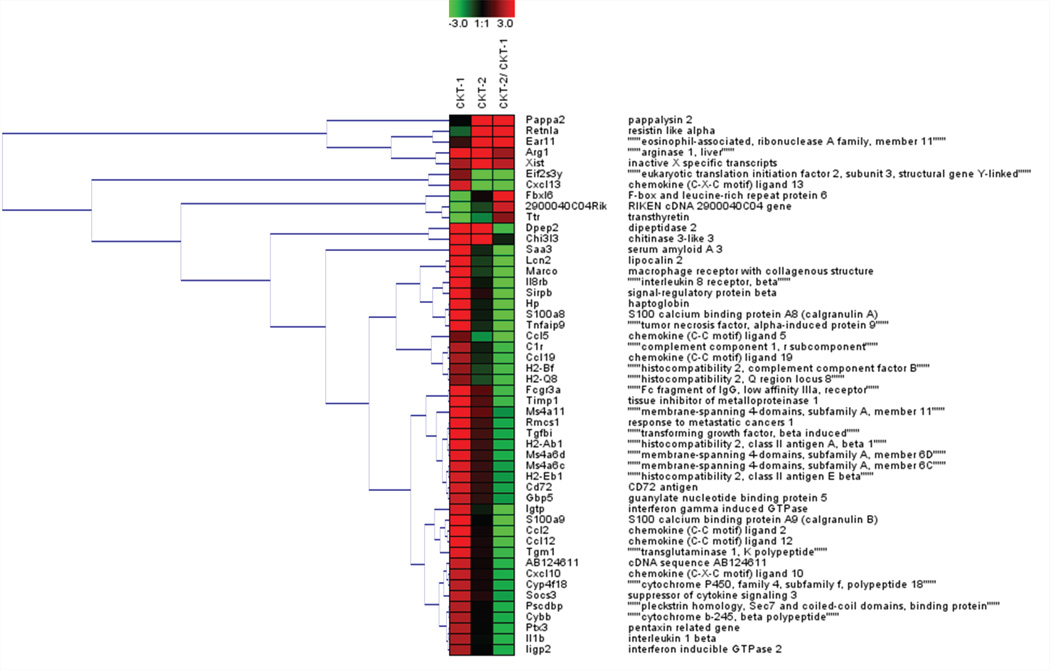
Heat map and cluster analysis for the top 50 gene transcripts in 6-month-old mice that received cytokine cocktails. Expression values are represented on a Log2 scale and show up-regulated (red) and down-regulated (green) gene transcripts. The top 50 transcripts were loaded into Genesis software to perform hierarchical clustering analysis using average linkage clustering parameters. Gene name (middle column) and protein name (right column) for each transcripts is listed for each row.
For the top 50 gene transcripts EAR11 and RETNLA displayed selectivity towards CKT-2 and clustered together along with ARG1 (Fig.2). This was the only gene ensemble that responded more to the CKT-2 cocktail than the CKT-1 cocktail. Cluster analysis indicated similar regulation of expression for the transcripts SAA3, LCN2, MARCO, IL8RB, SIRPB1, HP, S100A8, TNFAIP9, and CCL5 all of which responded more to CKT-1 (Fig.2). Also, of note CXCL13 and EIF2S3Y were clustered together and showed selectivity toward CKT-1. DPEP2 and CHI3L3 clustered together and were increased by both cocktails.
We also performed microarray analysis of gene expression on tissue from 12 and 24 months old mice. These data were not qualitatively different from those at 6 months, but some quantitative differences were observed. For simplicity we are not showing these data, but can make them available upon request.
3.2 Staining of Microglia with Antibodies against the cognate proteins of genes selectively induced by CKT-1 or CKT-2
For several of the transcripts studied by qRT-PCR, there are antibodies commercially available. Immunostaining with these antibodies is presented in Fig 3 in mice injected with vehicle (left column), CKT-1 (center column) or CKT-2 (right column). All images are centered on the injection site in the hippocampus of young mice. For MARCO (Fig.3D–F), S100A8 (Fig.3 M–O) and S100 A9 (Fig. 3P–R), reaction product is visible only when the CKT-1 cocktail is injected, confirming their selectivity at the protein level as well as the RNA level. For Fizz1 (Fig. G–I), immunoreaction product is only found around the CKT-2 injection. For YM1 (Fig. J–L) and MHCII (Fig.3A–C), there is some reaction product visible for both the CKT-1 and CKT-2 injections. However, YM1 was greater for CKT-2. These data again confirm at the protein level the results obtained at the RNA level regarding selectivity of induction by the two different cytokine cocktails.
3.3 Age-related Analysis of Genes Induced by CKT-1 compared to CKT-2
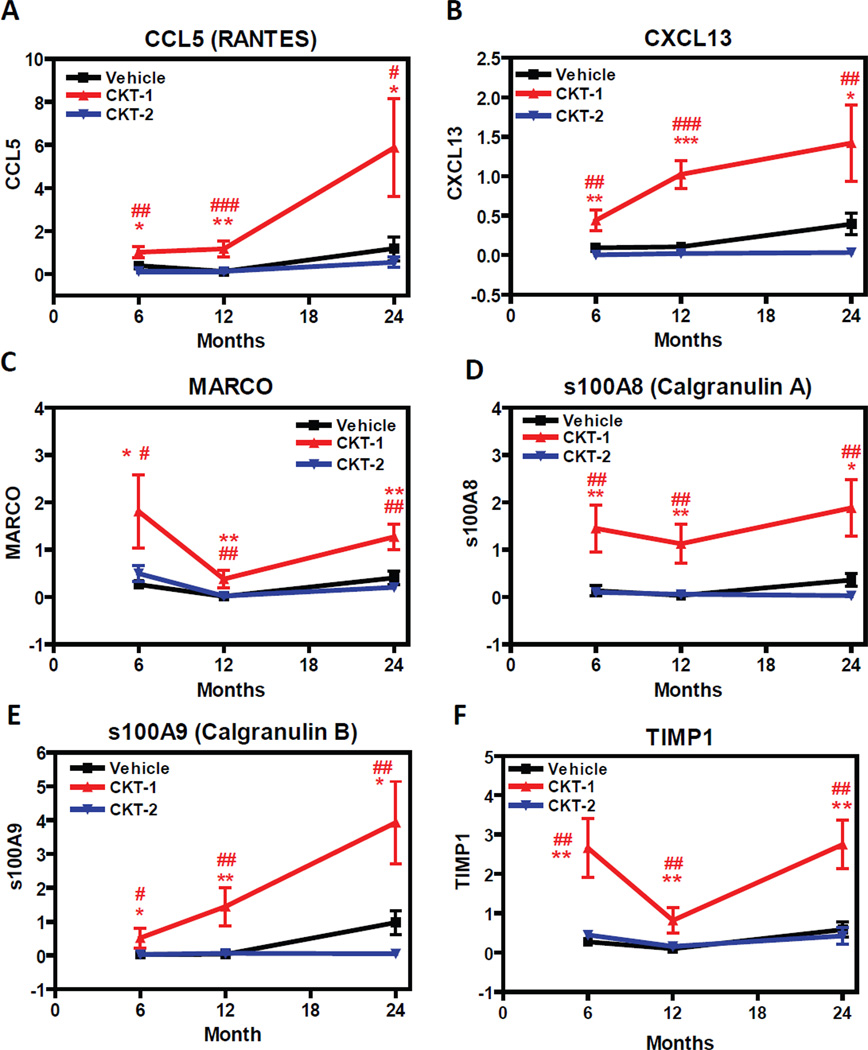
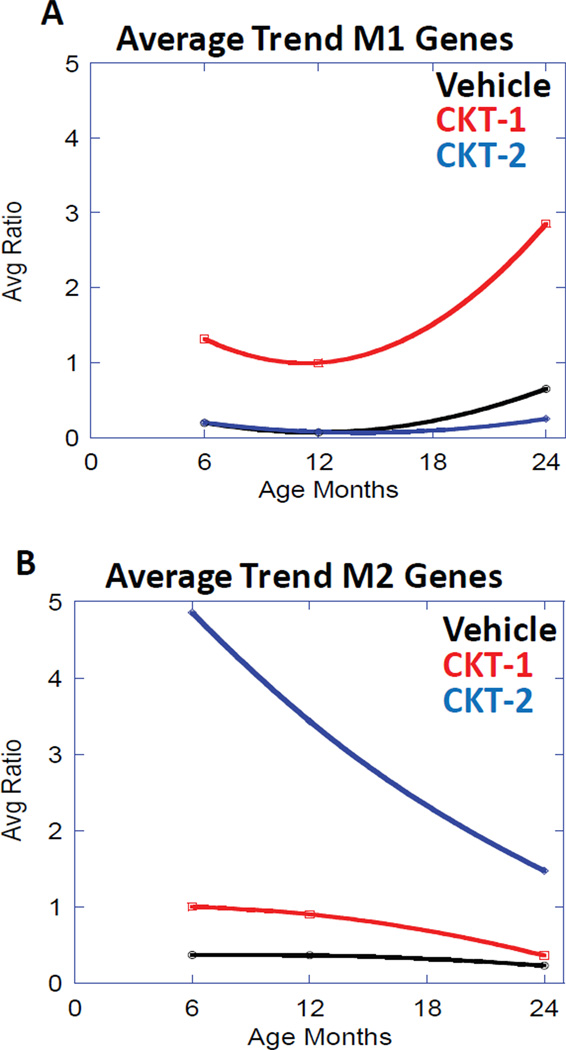
From ingenuity pathway analysis and cluster analysis, we focused on several transcripts that changed between CKT-1 and CKT-2 consistently at all mouse ages. As array studies were not designed for comparisons across age, and the pooling of samples reduced statistical power, we performed quantitative rt-PCR on specific transcripts of each sample at the three ages. We chose six transcripts that were selectively induced by CKT-1 for the age analysis. We found that CCL5 (RANTES) (Fig. 4A), CXCL13 (Fig. 4B), and s100A9 (calgranulin B) (Fig. 4E) were significantly induced at all ages compared to vehicle or CKT-2 treated mice. However, the induction was significantly greater in the 24-month old mice than the 6-months old mice. Several other gene products that were significantly increased at all ages by CKT-1 included MARCO (Fig. 4C), s100A8 (calgranulin A) (Fig. 4D), and TIMP1 (tissue inhibitor of metalloproteases-1) (Fig. 4F) compared to vehicle and CKT-2 treated mice. Although induction of these transcripts was similar in young and old mice, the induction was impaired at the 12 months age point. CKT-2 injections failed to induce any of the aforementioned gene transcripts, suggesting that these genes exclusively respond to the CKT-1 cocktail. Overall, using data for all six transcripts the best-fit line (Fig 6A) indicates an age-related increase between 12 and 24 months in response to CKT-1 injections.
Figure 4.
Quantitative RT-PCR Experiments of Selective/ biased Gene Transcripts Induced by the CKT-1. Mice aged 6, 12, and 24 months old were treated intracranially with vehicle (PBS), CKT-1 (IL-1β, IL-12, TNF-α), or CKT-2 (IL-4, IL-13). Three days post injection, brains were harvested and mRNA levels were determined by qRT-PCR. Differences between samples were calculated using a standard curve method and normalized to house keeping gene (ratio to GAPDH). Gene transcripts including CCL5 (A), CXCL13 (B), MARCO (C), s100A8/ calgranulin A (D), s100A9/ calgranulin B (E), and TIMP1 (F) showed selective/ biased induction by the CKT-1 cocktail (red) compared to vehicle (black) or CKT-2 (blue). Values are expressed as mean ± SEM. Statistical analysis was performed using One-Way ANOVA and Fisher’s PLSD multiple comparison test (*p<0.05, **p<0.01, ***p<0.001 vehicle compared to CKT-1; #p<0.05, ##p<0.01, ###p<0.001 CKT-1 compared to CKT-2) n=6/ group.
Figure 6.
Represents the average trend for induction of all six M1 biased gene transcripts including [A] CCL5, CXCL13, MARCO, s100A8/ calgranulin A, s100A9/ calgranulin B, and TIMP1). There was an overall increase in mRNA induction in aged mice that received the CKT-1. [B] Represents the average trend for induction of all six M2 biased gene transcripts (ARG1, CHI3L3, EAR11, ERDR1, IGF-1, and RETNLA). There was an overall decrease in mRNA induction in aged mice that received the CKT-2.
3.4 Age-related Analysis of Genes Induced by CKT-2 Compared to CKT-1
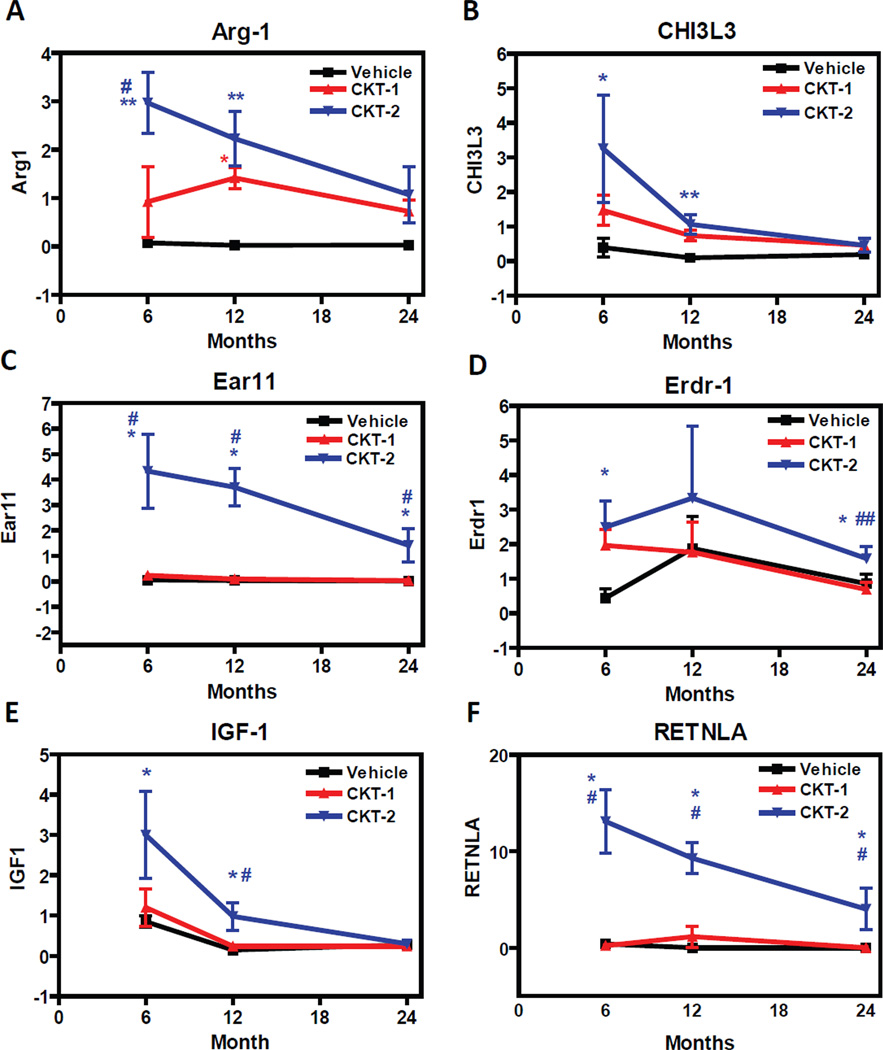
We performed qRT-PCR on six gene products either increased by CKT-2 from the microarray data or otherwise associated with the alternative activation state of peripheral macrophages. The two gene products that were induced to the greatest extent by CKT-2 injection were RETNLA (Fizz1) (Fig. 5F) and eosinophil associated ribonuclease member 11 (EAR11) (Fig 5C). The inductions of these transcripts were highly selective, with significantly increases at all ages compared to vehicle- treated mice and mice that received CKT-1; however mean induction ratios were significantly decreased at 24 month compared to the 6- and 12- month- old groups, implying an age-associated impairment of induction by the CKT-2 cocktail. Several other gene products that increased after CKT-2 injections included: Chi3l3 (YM1) (Fig. 5B), Arg1 (Fig. 5A), and insulin-like growth factor 1 (IGF-1) (Fig. 5E). Compared to vehicle treated mice, CKT-2 significantly increased Arg1, YM1 and IGF1 (Fig.5 A, B and E) at 6-and 12- month- old mice. However, aged mice (24 months old) failed to induce Arg1, YM1, and IGF-1 transcripts after CKT-2 injections compared to vehicle-treated mice or mice that received CKT-1. These data indicate that the ability to mount an alternative activation response through IL-4/ IL-13 stimulation is reduced with age. It also implies a prolonged resolution response or exaggerated proinflammatory response following cytokines biased towards classical activation responses. Another gene transcript that was significantly increased by CKT-2 included erythroid differentiation regulator-1 (Erdr1) (Fig. 5D), which has been associated with hemoglobin synthesis, cell survival and growth control (Dormer, 2004, Jung, et al., 2011). It should be noted that YM1 and Arg1 were also elevated in mice treated with CKT-1 compared to vehicle treated mice. This confirms the data obtained in the array studies in Fig 2. This suggests that either CKT-1 is not completely selective for induction of the M1 phenotype, or that the regulation of these “alternative activation” transcripts in the CNS is different than in the periphery. Combining the data from all transcripts, the best-fit line shows a progressive age-related decline in gene induction by CKT-2 (Fig. 6B).
Figure 5.
Quantitative RT-PCR Experiments of Selective/ biased Gene Transcripts Induced by the CKT-2. Mice aged 6, 12, and 24 months old were treated intracranially with vehicle (PBS), CKT-1 (IL-1β, IL-12, TNF-α), or CKT-2 (IL-4, IL-13). Three days post injection, brains were harvested and mRNA levels were determined by qRT-PCR. Differences between samples were calculated using a standard curve method and normalized to house keeping gene (ratio to GAPDH). Gene transcripts including ARG1 (A), CH3L3 (YM1)(B), EAR11 (C), ERDR1 (D), IGF-1 (E), and RETNLA (FIZZ1) (F) showed selective/ biased induction by the CKT-2 cocktail (blue) compared to vehicle (black) or CKT-1 (red). Values are expressed as mean ± SEM. Statistical analysis was performed using One-Way ANOVA and Fisher’s PLSD multiple comparison test (*p<0.05, **p<0.01, ***p<0.001 vehicle compared to CKT-1; #p<0.05, ##p<0.01, ###p<0.001 CKT-1 compared to CKT-2) n=6/ group.
3.5 Double labeling of MARCO and Calgranulin B versus Arginase-1 and YM1
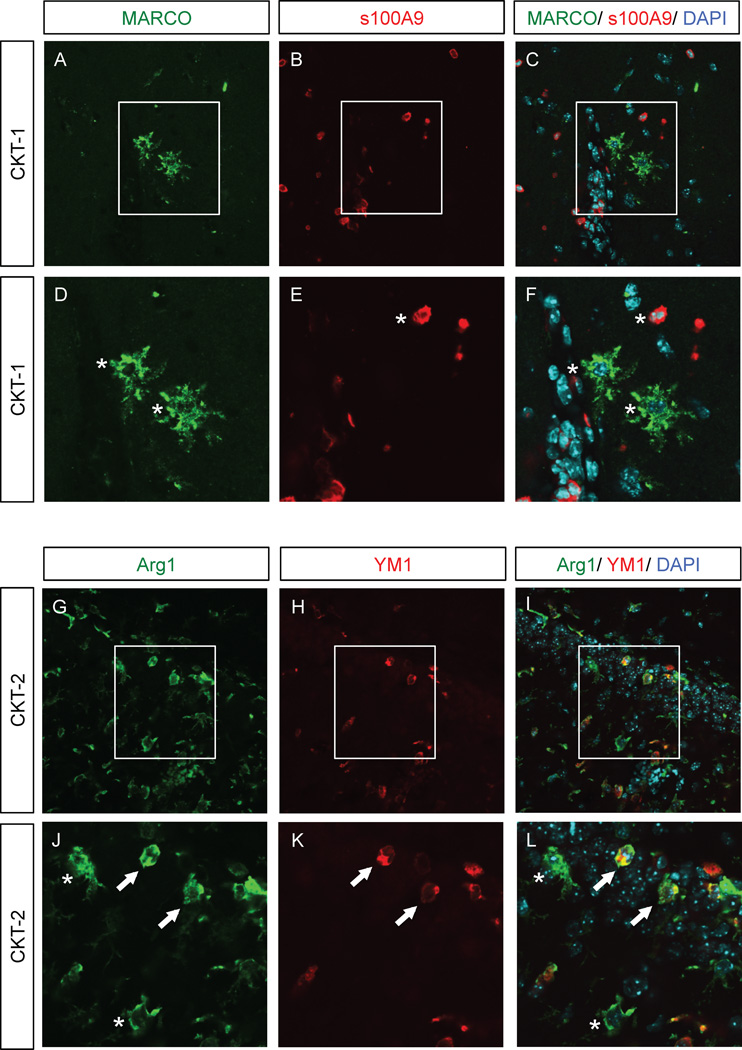
To further investigate the complexity of activation phenotypes following each cytokine cocktail, we doubled two highly selective M1 markers (MARCO and s100A9; Calgranulin B) for CKT-1 and two putative M2 markers (Arginase-1 and YM1) for CKT-2 to identify co-expression in the same cells (Fig. 7A–F). MARCO positive cells displayed highly branched morphology (Fig. 7A, D), whereas s100A9 positive cells represented amoeboid/ round/ macrophage-like cells (Fig. 7B, E). Cells representing each marker were distributed throughout the parenchyma of the hippocampus but failed to co-label the same cells, suggesting either completely different cell types of the myeloid lineage, different functional or expression profiles during cytokines associated with CKT-1. Conversely, Arginase-1 and YM1 (both markers stimulated by CKT-1 and CKT-2) displayed mixed double-labeling expression profiles following CKT-2 (Fig. 7G–L). Arg1 (Fig. 7G, J) and YM1 (Fig. 7H, K) positive cells were indeed expressed in the same cells (Fig. 7I, L Arrows), yet some cells also expressed Arg-1 but not YM1 (Fig. 7G–L, asterisk). Overall, more cells were positive for Arg1 and represented various morphologies including highly thin-branched to thickly branched and amoeboid-like cells, whereas YM1 represented amoeboid with some branching. This signifies a more complex phenotype even within the IL-4/ IL-13 pathway. Both Arg-1 and YM1 were also increased with CKT-1 at the RNA level, which may indicate a transition from M1 to M2 or simply functional activation of various cells. These data offers even more complexity for different phenotypes or expression profiles among the same stimuli.
Figure 7.
Immunofluorescence of MARCO and calgranulin B versus Arginase-1 and YM1. Mice were injected intracranially with CKT-1 (IL-1β, IL-12, TNF-α) (Panels A–F), and CKT-2 (IL-4, IL-13) (Panels G–L). MARCO (A, D, green) and s100A9 (calgranulin B) (B, E, red) were increased following CKT-1 but failed to co-label the same cells (C, F). Arginase-1 (Arg1) (G, J, green) and YM1 (H, K, red) were both increased following CKT-2. Some cells were double positive for both markers however (arrows), whereas some cells were individually labeled with either Arg1 or YM1 (asterisks). Photomicrographs were imaged using scanning confocal microscope (60× magnification). Panels (A–C, G–I) indicate 60x magnification; Panels (D–F, J–L) represent respective insets. Arrows indicate double labeling of markers, whereas asterisks represent individually labeled cells.
4. Discussion
The three goals of these studies were to 1) determine if microglia express unique phenotypes in response to cytokines associated with M1 versus M2 activation states in the same manner as peripheral macrophages do; 2) identify useful immunological markers to distinguish these phenotypes; and 3) determine if age modifies the responsiveness of microglia to these cytokines.
The microarray studies and the confirmation by qRT-PCR indicate that there are distinct activation states of microglia that can be induced by these cytokines. The response to the CKT-1 cocktail is consistent with the M1 or classical activation phenotype associated with peripheral macrophages, with a large number of transcripts elevated many fold over baseline. These included CCL2, CXCL10, IL-1β, and CXCL-13 (Mantovani, et al., 2004). Similarly, there were several genes associated with the response to CKT-2 that are consistent with the peripheral macrophage alternative activation state, including Fizz1, YM1 and Arg1. However, these supposed alternative activation markers were not exclusively induced by the CKT-2 cocktail, as the CKT-1 cocktail also resulted in some elevations (albeit less than observed with CKT-2). This observation suggests that either 1) the 3 days of stimulation by M-1 is enough to begin the transition to the M-2 phenotype (Duffield, 2003a), 2) the cocktail chosen is not exclusively inducing an M1 state due to absence of IFN-gamma or 3) the brain microglial M1 activation state is different than that of peripheral macrophages, 4) the presence of other cell types in the CNS influence the complexity of responses (i.e. endothelial, astrocytes and neurons), which may respond to cytokine stimulation.
With respect to the second goal of identifying antibody markers that could have benefit in phenotyping the activation state of microglia in tissue sections, we feel that some success has been achieved. There are clearly some antibodies that exclusively label classically activated microglia (although it cannot be excluded that they are peripherally derived cells). These include MARCO, and calgranulins A and B (note: these are not equivalent or related to progranulins, associated with human tauopathies). Conversely, for labeling alternatively activated microglia, we have used antibodies against Fizz1, YM1 and Arg1. Only Fizz1 is entirely selective for the CKT-2 cocktail, and based on our experience, stains a very limited number of microglia under most circumstances. YM1 and Arg1 stain more cells when activated by the CKT-2 cocktail, but there is some apparent activation by the M1 cocktail as well. Of relevance is our observation that when stimulated with LPS, MARCO and YM1 stain non-overlapping cell populations (manuscript in preparation). Thus, we rate this goal as being partially met and will endeavor to identify antibodies for other markers selectively induced by CKT-2 at the mRNA level, such as Pappa2, FBx16 and EAR11.
Perhaps most intriguing is the observation related to the third goal: the impact of age on these microglial phenotypes. For the response to the CKT-1 injections, there were two apparent patterns; one set of genes increased induction throughout the lifespan, while a second series appeared to have impaired induction restricted to middle age. It is not certain if these really are two distinct patterns, or possibly normal variance. We are planning double labeling experiments with antibodies to ascertain if these two sets of genes stain independent or overlapping cell populations (or both). It needs to be considered that some of these responses may be derived from astrocytes, endothelial cells or neurons as well as microglia, and immunostaining will be required to resolve this possibility. MARCO, however, stains only cells with distinct microglial morphology. Nonetheless, the trend line for M1 responses with age in the brain is increased responsiveness.
Conversely, the trend line for the activation of the M2 phenotype with the CKT-2 cocktail is clearly diminished with age. For all 6 markers, the fold induction was reduced at 24 months, and for 3 of the markers characterized, there was no induction detectable. It is uncertain if this reflects a decrease in receptors or signaling components for these cytokines, or a shift in microglial populations. An alternative is that the response is considerably delayed in the aged mice, which can be tested by performing time course experiments. Assuming this trend characterizes other components of the M2 phenotype, this implies that in the aged brain there is an increased propensity of microglia to respond with a larger classical activation response, and one that may be prolonged compared to younger animals. This is reminiscent of the astrocytic GFAP responses with aging (Gordon, et al., 1997), where the response is exaggerated and prolonged after denervating lesions. It is conceivable that this impaired response to M2 cytokines results in failure of the transition from classical to alternative activation that characterizes a typical macrophage response to injury (Duffield, 2003b). Other reports demonstrated clear evidence for IL-4 receptors on granule cells of the dentate gyrus and an aged-related decrease in IL-4 signaling, which led to long-term potentiation (LTP) impairments in aged rats (Maher, et al., 2005,Nolan, et al., 2005). Furthermore, the authors showed aged-related increase in IL-β, which mitigated LTP. This further links memory impairment and activation responses that modulate the M1/ M2 balance. Our data supports that of others implicating regulation of M2 cytokines on M1 activation profiles in the CNS and provides potential markers that may indicate the inflammatory microenvironment of the CNS. The majority of selective M1 and M2 markers chosen in our study for qRT-PCR derive from a myeloid lineage with the exception of some chemokines. However, additional cell types and paracrine effects likely contribute to the overall phenotypes following these activation responses.
In conclusion, the brain microglia do appear to express qualitatively different markers in response to cytokines associated with an M1 response and an M2 response. Antibodies to some of these selectively induced markers may have utility in defining the activation state of brain microglia in response to perturbations (such as amyloid, tau, synuclein pathology). However, it appears that age dramatically impacts the capacity of the brain to elicit polarized microglial responses, with a bias towards M1 and away from M2 activation states.
Footnotes
Publisher's Disclaimer: This is a PDF file of an unedited manuscript that has been accepted for publication. As a service to our customers we are providing this early version of the manuscript. The manuscript will undergo copyediting, typesetting, and review of the resulting proof before it is published in its final citable form. Please note that during the production process errors may be discovered which could affect the content, and all legal disclaimers that apply to the journal pertain.
Reference
- Aisen PS, Davis KL, Berg JD, Schafer K, Campbell K, Thomas RG, Weiner MF, Farlow MR, Sano M, Grundman M, Thal LJ. A randomized controlled trial of prednisone in Alzheimer's disease Alzheimer's Disease Cooperative Study. Neurology. 2000;54(3):588–593. doi: 10.1212/wnl.54.3.588. [DOI] [PubMed] [Google Scholar]
- Aisen PS, Schafer KA, Grundman M, Pfeiffer E, Sano M, Davis KL, Farlow MR, Jin S, Thomas RG, Thal LJ, Study AasDC. Effects of rofecoxib or naproxen vs placebo on Alzheimer disease progression: a randomized controlled trial. JAMA : the journal of the American Medical Association. 2003;289(21):2819–2826. doi: 10.1001/jama.289.21.2819. [DOI] [PubMed] [Google Scholar]
- Akiyama H, Barger S, Barnum S. Inflammation and Alzheimer’s disease. Neurobiology of Aging. 2000:1–39. doi: 10.1016/s0197-4580(00)00124-x. [DOI] [PMC free article] [PubMed] [Google Scholar]
- Arnett HA, Mason J, Marino M, Suzuki K, Matsushima GK, Ting JP. TNF alpha promotes proliferation of oligodendrocyte progenitors and remyelination. Nature Neuroscience. 2001;4(11):1116–1122. doi: 10.1038/nn738. [DOI] [PubMed] [Google Scholar]
- Breitner JC, Welsh KA, Helms MJ, Gaskell PC, Gau BA, Roses AD, Pericak-Vance MA, Saunders AM. Delayed onset of Alzheimer's disease with nonsteroidal anti-inflammatory and histamine H2 blocking drugs. Neurobiology of Aging. 1995;16(4):523–530. doi: 10.1016/0197-4580(95)00049-k. [DOI] [PubMed] [Google Scholar]
- Chan WY, Kohsaka S, Rezaie P. The origin and cell lineage of microglia—New concepts. Brain Research Reviews. 2007;53(2):344–354. doi: 10.1016/j.brainresrev.2006.11.002. [DOI] [PubMed] [Google Scholar]
- DiCarlo G, Wilcock D, Henderson D, Gordon M, Morgan D. Intrahippocampal LPS injections reduce Abeta load in APP+PS1 transgenic mice. Neurobiology of Aging. 2001;22(6):1007–1012. doi: 10.1016/s0197-4580(01)00292-5. [DOI] [PubMed] [Google Scholar]
- Dormer P. EDR is a stress-related survival factor from stroma and other tissues acting on early haematopoietic progenitors (E-Mix) Cytokine. 2004;27(2–3):47–57. doi: 10.1016/j.cyto.2004.03.014. [DOI] [PubMed] [Google Scholar]
- Duffield JS. The inflammatory macrophage : a story of Jekyll and Hyde. Clinical Science. 2003a;104:27–38. doi: 10.1042/. [DOI] [PubMed] [Google Scholar]
- Duffield JS. The inflammatory macrophage : a story of Jekyll and Hyde. Clinical science (London, England : 1979) 2003b;104(1):27–38. doi: 10.1042/. [DOI] [PubMed] [Google Scholar]
- Ginhoux F, Greter M, Leboeuf M, Nandi S, See P, Gokhan S, Mehler MF, Conway SJ, Ng LG, Stanley ER, Samokhvalov IM, Merad M. Fate Mapping Analysis Reveals That Adult Microglia Derive from Primitive Macrophages. Science. 2010;330(6005):841–845. doi: 10.1126/science.1194637. [DOI] [PMC free article] [PubMed] [Google Scholar]
- Gordon MN, Holcomb LA, Jantzen PT, DiCarlo G, Wilcock D, Boyett KW, Connor K, Melachrino J, O'Callaghan JP, Morgan D. Time course of the development of Alzheimer-like pathology in the doubly transgenic PS1+APP mouse. Exp Neurol. 2002;173(2):183–195. doi: 10.1006/exnr.2001.7754. [DOI] [PubMed] [Google Scholar]
- Gordon MN, Schreier WA, Ou X, Holcomb LA, Morgan DG. Exaggerated astrocyte reactivity after nigrostriatal deafferentation in the aged rat. The Journal of Comparative Neurology. 1997;388(1):106–119. [PubMed] [Google Scholar]
- Gordon S. Alternative activation of macrophages. Nature Reviews Immunology. 2003;3(1):23–35. doi: 10.1038/nri978. [DOI] [PubMed] [Google Scholar]
- Gordon S, Martinez FO. Alternative Activation of Macrophages: Mechanism and Functions. Immunity. 2010;32(5):593–604. doi: 10.1016/j.immuni.2010.05.007. [DOI] [PubMed] [Google Scholar]
- Graeber MB. Changing Face of Microglia. Science. 2010;330(6005):783–788. doi: 10.1126/science.1190929. [DOI] [PubMed] [Google Scholar]
- Jung MK, Park Y, Song SB, Cheon SY, Park S, Houh Y, Ha S, Kim HJ, Park JM, Kim TS, Lee WJ, Cho BJ, Bang SI, Park H, Cho D. Erythroid Differentiation Regulator 1, an Interleukin 18-Regulated Gene, Acts as a Metastasis Suppressor in Melanoma. Journal of Investigative Dermatology. 2011;131(10):2096–2104. doi: 10.1038/jid.2011.170. [DOI] [PubMed] [Google Scholar]
- Lee S, Varvel NH, Konerth ME, Xu G, Cardona AE, Ransohoff RM, Lamb BT. CX3CR1 deficiency alters microglial activation and reduces beta-amyloid deposition in two Alzheimer's disease mouse models. The American Journal of Pathology. 2010;177(5):2549–2562. doi: 10.2353/ajpath.2010.100265. [DOI] [PMC free article] [PubMed] [Google Scholar]
- Liu Z, Condello C, Schain A, Harb R, Grutzendler J. CX3CR1 in microglia regulates brain amyloid deposition through selective protofibrillar amyloid-β phagocytosis. Journal of Neuroscience. 2010;30(50):17091–17101. doi: 10.1523/JNEUROSCI.4403-10.2010. [DOI] [PMC free article] [PubMed] [Google Scholar]
- Maher FO, Nolan Y, Lynch MA. Downregulation of IL-4-induced signalling in hippocampus contributes to deficits in LTP in the aged rat. Neurobiology of Aging. 2005;26(5):717–728. doi: 10.1016/j.neurobiolaging.2004.07.002. [DOI] [PubMed] [Google Scholar]
- Mantovani A, Sica A, Sozzani S, Allavena P, Vecchi A, Locati M. The chemokine system in diverse forms of macrophage activation and polarization. Trends in Immunology. 2004;25(12):677–686. doi: 10.1016/j.it.2004.09.015. [DOI] [PubMed] [Google Scholar]
- Martinez FO, Helming L, Gordon S. Alternative activation of macrophages: an immunologic functional perspective. Annual Review of Immunology. 2009;27:451–483. doi: 10.1146/annurev.immunol.021908.132532. [DOI] [PubMed] [Google Scholar]
- Martinez-Pomares L. Analysis of mannose receptor regulation by IL-4, IL-10, and proteolytic processing using novel monoclonal antibodies. Journal of Leukocyte Biology. 2003;73(5):604–613. doi: 10.1189/jlb.0902450. [DOI] [PubMed] [Google Scholar]
- Morgan D, Gordon MN, Tan J, Wilcock D, Rojiani AM. Dynamic complexity of the microglial activation response in transgenic models of amyloid deposition: implications for Alzheimer therapeutics. Journal of neuropathology and experimental neurology. 2005;64(9):743–753. doi: 10.1097/01.jnen.0000178444.33972.e0. [DOI] [PubMed] [Google Scholar]
- Nolan T, Hands RE, Bustin SA. Quantification of mRNA using real-time RT-PCR. Nat Protoc. 2006;1(3):1559–1582. doi: 10.1038/nprot.2006.236. [DOI] [PubMed] [Google Scholar]
- Nolan Y, Maher FO, Martin DS, Clarke RM, Brady MT, Bolton AE, Mills KH, Lynch MA. Role of interleukin-4 in regulation of age-related inflammatory changes in the hippocampus. The Journal of biological chemistry. 2005;280(10):9354–9362. doi: 10.1074/jbc.M412170200. [DOI] [PubMed] [Google Scholar]
- Park KM, Bowers WJ. Tumor necrosis factor-alpha mediated signaling in neuronal homeostasis and dysfunction. Cellular signalling. 2010;22(7):977–983. doi: 10.1016/j.cellsig.2010.01.010. [DOI] [PMC free article] [PubMed] [Google Scholar]
- Prinz M, Priller J, Sisodia SS, Ransohoff RM. Heterogeneity of CNS myeloid cells and their roles in neurodegeneration. Nature Publishing Group. 2011;13(10):1227–1235. doi: 10.1038/nn.2923. [DOI] [PubMed] [Google Scholar]
- Ransohoff RM, Cardona AE. The myeloid cells of the central nervous system parenchyma. Nature. 2010;468(7321):253–262. doi: 10.1038/nature09615. [DOI] [PubMed] [Google Scholar]
- Rivest S. Regulation of innate immune responses in the brain. Nature Publishing Group. 2009;9(6):429–439. doi: 10.1038/nri2565. [DOI] [PubMed] [Google Scholar]
- Shaftel SS, Kyrkanides S, Olschowka JA, Miller J-n.H, Johnson RE, Banion MK. Sustained hippocampal IL-1 beta overexpression mediates chronic neuroinflammation and ameliorates Alzheimer plaque pathology. Journal of Clinical Investigation. 2007;117(6):1595–1604. doi: 10.1172/JCI31450. [DOI] [PMC free article] [PubMed] [Google Scholar]
- Taylor PR, Martinez-Pomares L, Stacey M, Lin H-H, Brown GD, Gordon S. Macrophage Receptors and Immune Recognition. Annual Review of Immunology. 2005;23(1):901–944. doi: 10.1146/annurev.immunol.23.021704.115816. [DOI] [PubMed] [Google Scholar]
- Tierney JB, Kharkrang M, La Flamme AC. Type II-activated macrophages suppress the development of experimental autoimmune encephalomyelitis. Immunology and Cell Biology. 2008;87(3):235–240. doi: 10.1038/icb.2008.99. [DOI] [PubMed] [Google Scholar]


