Abstract
Incidence estimates for pituitary adenomas vary widely, suggesting the effects of numerous risk factors or varying levels of tumor surveillance. We studied the epidemiology of pituitary adenomas using 2004–2007 data collected by 17 Surveillance, Epidemiology, and End Results (SEER) Programs in the United States (N = 8,276). We observed that incidence rates generally increased with age and were higher in females in early life and higher in males in later life. Males are diagnosed with larger tumors on average than females. Diagnosis may be delayed for males, giving tumors a chance to grow larger before clinical detection. We also observed that American Blacks have higher incidence rates for pituitary adenomas compared with other ethnic groups. There are several potential explanations for this finding with some evidence that at least part of the effect may be due to differential diagnosis between races.
Keywords: pituitary, adenoma, incidence, race, sex
Pituitary adenomas are usually benign and indolent. While some lead to hormone hypersecretion, hypopituitarism, and neurologic dysfunction, many do not cause symptoms and remain undetected. Indeed, autopsy and radiographic data indicate that these tumors are actually relatively common with overall prevalence rates varying from 10 to 22% [1,2] (although such studies are certainly subject to selective factors). The wide range of incidence rates across individual studies [3], suggests that numerous risk factors may be responsible or that varying levels of tumor surveillance are operative. It is well established that pituitary adenomas arise from clonal expansion of mutated somatic cells but the causative mechanism involved in tumorigenesis remains to be established. Some specific genes appear to predispose to pituitary tumor formation while oncogenes do not play a role in pituitary tumor formation [4].
Hemminki, Försti, and Ji [5] found an interaction between sex and age for incidence of pituitary adenoma. Female incidence rates were higher than males up to about 30 years of age when the pattern was reversed. This has been attributed to earlier and more noticeable symptoms of associated hyperprolactinemia in females [6] (e.g., amenorrhea and galactorrhea). The most prominent symptom of hyperprolactinemia in males is decreased libido, which is not as easily diagnosed [7].
Interesting findings with regard to race have also been reported. Heshmat et al. [8], found that pituitary adenoma incidence rates for black women were about three times as high as they were for white women (age-adjusted incidence rates of .76 and .22 per 100,000, respectively); incidence rates for black men were about four times as high as they were for white men (age-adjusted incidence rates of 1.02 and 0.23 per 100,000, respectively). This was based on histologically-confirmed tumor data collected on residents of the Washington, D.C., metropolitan area from 1960 to 1969. Fan et al. [9] obtained corresponding results with a set of cases that were diagnosed with CNS tumors by the Armed Forces Institute of Pathology between 1958 and 1970. For Blacks, 19% of these tumors were pituitary adenomas compared to only 8% for Whites.
There has been only one population-based study of pituitary adenomas in the United States, and that was published over 30 years ago [8]. The current study examines demographic differences in pituitary adenomas using data collected by the Surveillance Epidemiology and End Results (SEER) Program across the United States. The 17 SEER registries that currently compose this program cover approximately 26% of the U.S. population [10] and reflect the geographical distribution of cancer across the country. The SEER programs collect a wide range of data on demographic, diagnostic, and clinical variables, and they began monitoring for benign brain tumors with 2004 diagnoses. With four years of data now available, this resource now provides an excellent opportunity to study demographic differences in incidence for benign pituitary adenoma.
Methods
This study used data from the November, 2009, submissions from all 17 SEER registries that were incorporated into the SEER*Stat database, Version 6.6.2 [11]. This includes benign brain tumor diagnoses made from 2004 to 2007. In this study, anatomic sites were restricted to the pituitary gland (ICD-O-3 Code C75.1) [12] and histology was restricted to benign adenomas (M8140 to M8384; see Table 1). A total of 8,276 cases met these inclusion criteria, and 8,118 of these cases had known sex and race values. Of these 8,118 cases, almost 99% (8,004) were isolated tumors; no other reportable tumors were present.
Table 1.
Counts of pituitary adenoma cases by year of diagnosis and histology, 17 SEER registries, 2004–2007.
| Histology | 2004 | 2005 | 2006 | 2007 | 2004 – 2007 |
|---|---|---|---|---|---|
| 8140/0: Adenoma, NOS | 174 | 182 | 151 | 153 | 660 |
| 8202/0: Microcystic adenoma | 0 | 0 | 2 | 0 | 2 |
| 8260/0: Papillary adenoma, NOS | 1 | 1 | 1 | 1 | 4 |
| 8270/0: Chromophobe adenoma | 23 | 27 | 37 | 26 | 113 |
| 8271/0: Prolactinoma | 77 | 59 | 60 | 54 | 250 |
| 8272/0: Pituitary adenoma, NOS | 1,676 | 1,793 | 1,851 | 1,891 | 7,211 |
| 8280/0: Acidophil adenoma | 7 | 4 | 8 | 5 | 24 |
| 8281/0: Mixed acidophil-basophil adenoma | 0 | 0 | 0 | 1 | 1 |
| 8290/0: Oxyphilic adenoma | 0 | 1 | 0 | 4 | 5 |
| 8300/0: Basophil adenoma | 2 | 1 | 3 | 0 | 6 |
| Total | 1,960 | 2,068 | 2,113 | 2,135 | 8,276 |
Exploratory analyses were also performed on cases of benign cerebral meningiomas that were diagnosed during the same time period. The purpose was to contrast the occurrence rates with those for pituitary tumors to possibly gain some insight into diagnostic practices. The SEER*Stat database yielded 15,529 cases with ICD-O-3 Code C70.0 and histology restricted to benign cases coded M9530 to M9539.
Frequencies and incidence rates (with confidence intervals) for all tumors were computed using the SEER*Stat application. Incidence rates were age-adjusted to the 2000 United States Census. Confidence intervals were calculated using the modification described by Tiwari, Clegg, and Zou [13]. Other descriptive values and inferential tests were computed using SAS 9.2 [14].
Poisson regression was performed on frequency data using age, race, and sex as categorical predictors. Population data from the 2000 U.S. census was used as an offset.
The SEER*Stat database documents several different methods of cancer diagnosis. For pituitary adenomas, 98% of cases were diagnosed either microscopically or through radiography, so analyses on methods of diagnosis were restricted to cases diagnosed with only those two methods.
Linear regression was performed on case-level tumor size data using age, race, and sex as categorical predictors. Because tumor size data are skewed, the regression was performed on log-transformed data, and medians and inter-quartile ranges (IQR) were used as summary statistics.
The SEER*Stat database includes information on whether primary site surgery was performed as part of the first course of therapy. If no surgery was performed, the reason for that is also recorded. We examined racial differences across this variable by collapsing surgery status into four categories: surgery performed, surgery not recommended, surgery recommended but not performed, and unknown if surgery was performed. (A fifth category, “patient died prior to recommended surgery”, was coded for only two cases and was not included in the analyses.)
Because these data come from a de-identified, publically-available dataset, IRB approval was not required.
Results
Incidence Rates by Age, Race, and Sex
Of the 8,276 benign cases diagnosed in the study interval, the vast majority (95%) were coded as either Pituitary Adenoma, NOS (M8272; N = 7,211) or Adenoma, NOS (M8140; N = 660). See Table 1 for counts of all histological subtypes.
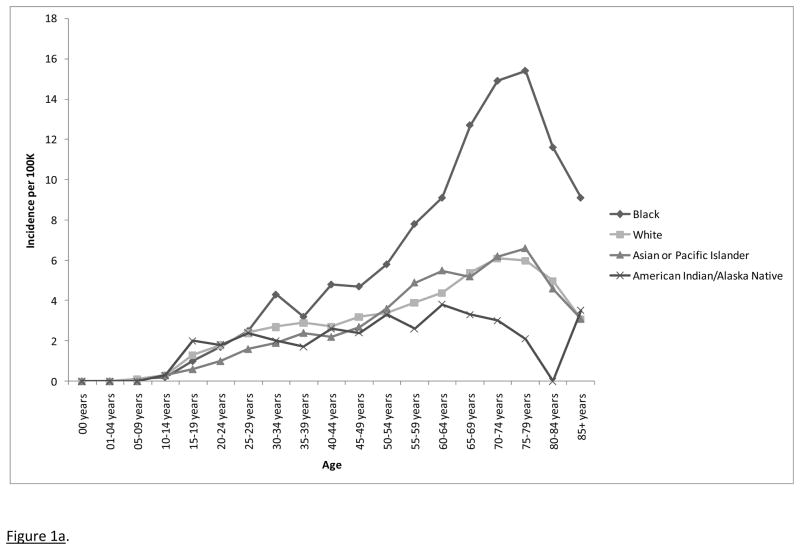
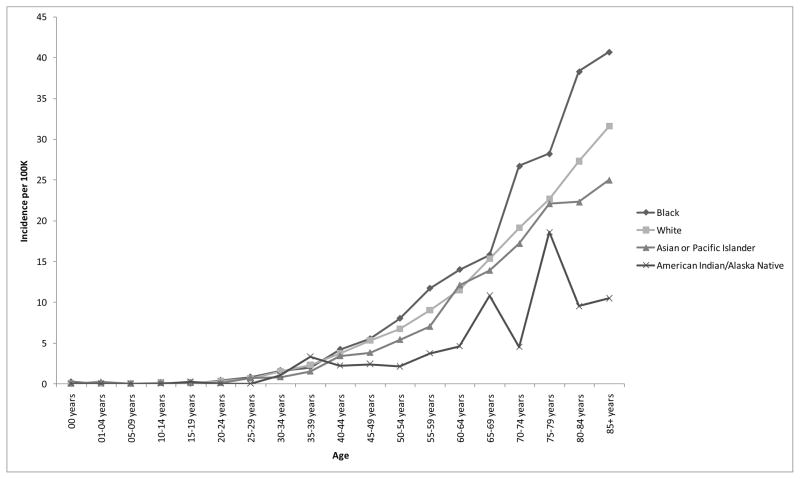
Age-adjusted incidence rates (and 95% confidence intervals) for 2004, 2005, 2006, and 2007 were 2.6 (2.5 – 2.7), 2.8 (2.7 – 2.9), 2.7 (2.6 – 2.9), and 2.7 (2.6 – 2.8) cases per 100,000, respectively. The overall incidence rates across all four years was 2.7 (2.7 – 2.8) cases per 100,000. Incidence data are presented by age and race in Figure 1a. Main effects were observed for age (incidence rates increasing with age with a possible decline in later life) and race, both p < .0001. Age-adjusted incidence rates (with 95% confidence intervals) for American Indians/Alaskan Natives, Asians/Pacific Islanders, Blacks, and Whites were 1.9 (1.5 – 2.4), 2.3 (2.1 – 2.5), 4.4 (4.2 – 4.7), and 2.5 (2.5 – 2.6) per 100,000, respectively.
Figure 1.
Figure 1a. Incidence rates for pituitary adenomas by age and race, 17 SEER registries, 2004–2007.
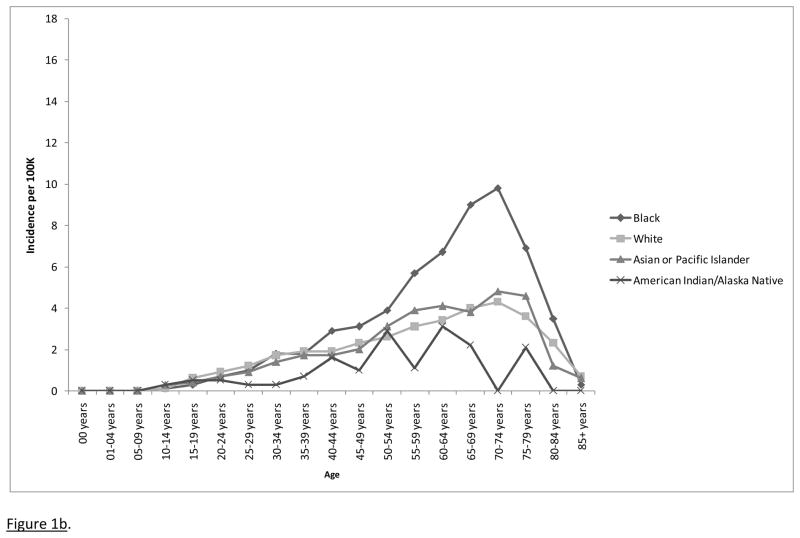
Figure 1b. Incidence rates for microscopically confirmed pituitary adenomas by age and race, 17 SEER registries, 2004–2007.
Pairwise comparisons were performed on the racial groups: Blacks had significantly higher incidence rates than Asians/Pacific Islanders, American Indians/Alaska Natives, and Whites, all p < .0001. There were no significant differences between American Indians/Alaska Natives and Asians/Pacific Islanders, p = .628, between Whites and American Indians/Alaska Natives, p = .268, or between Whites and Asians/Pacific Islanders, p = .098.
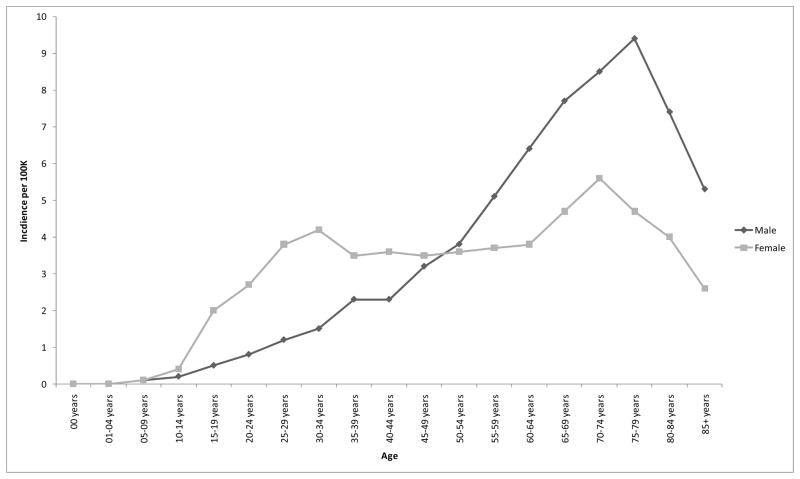
There was no significant main effect for sex, p = .154, but the age by sex interaction was significant, p < .0001; incidence rates were higher in females during early life and higher in males in later life (Figure 2).
Figure 2.
Age by sex interaction for incidence rates of benign pituitary tumors, 17 SEER registries, 2004–2007.
Method of Tumor Diagnosis
A chi-square test for independence revealed a significant relationship between race and method of diagnosis, p < .0001. Proportion of cases that were microscopically confirmed (with 95% CI) for Asians/Pacific Islanders, Whites, Blacks, and American Indians/Alaskan Natives were 74% (71–77%), 67% (66–69%), 59% (56–62%), 45% (34–57%), respectively.
To ensure that differences in method of diagnosis were not completely responsible for the observed ethnic effects for incidence, Poisson regression was performed again on the frequency data only for cases that were microscopically confirmed (Figure 1b). As before, significant main effects were observed for age and race, both p < .0001, but not for sex, p = .517, and the age by sex interaction was significant, p < .0001.
Tumor Size
Of the 8,118 cases, 2,476 (31%) were discarded for analyses of tumor size. Of these, 2,430 had no size measurement recorded, 26 did not have precise measurements recorded, and 20 were clearly miscoded. Across the racial groups, 64% of American Indians/Alaskan Natives, 72% of Asian/Pacific Islanders, 65% of the Blacks, and 70% of the Whites in this database had valid tumor size data.
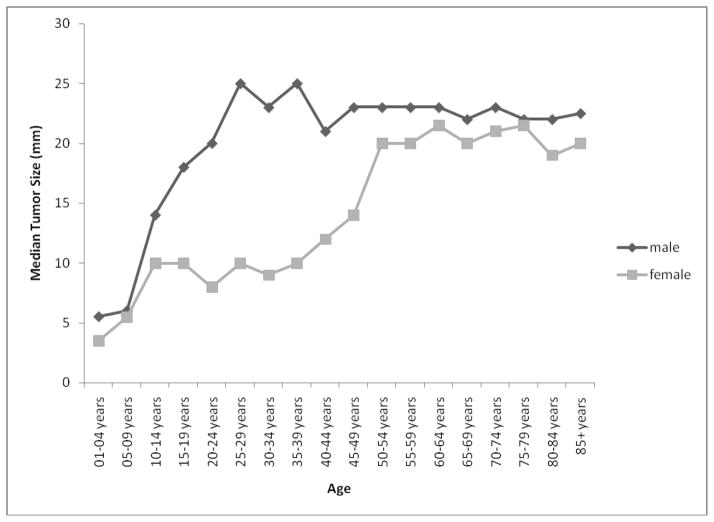
The median tumor sizes for males and females were 23mm (IQR = 15) and 15mm (IQR = 18), respectively, p < .0001. The main effect for age was significant, p < .0001, and the age by sex interaction was also significant, p < .0001: Tumor size increased with age at diagnosis with a larger sex difference in early life (Figure 3). The main effect for race was significant (p < .0001), and the median sizes for American Indians/Alaskan Natives, Asian/Pacific Islanders, Blacks and Whites were 6mm (IQR = 14.5), 20mm (IQR = 20), 20mm (IQR = 19), and 19mm (IQR = 17), respectively. All pairwise comparisons were significant (all p < .003) except for Asian/Pacific Islanders vs. Blacks (p = .549) and Asian/Pacific Islanders vs. Whites (p = .093).
Figure 3.
Median tumor size by age and sex; 17 SEER registries, 2004–2007.
Primary Site Surgery
A race effect was also observed for receipt of surgery (Table 2). Asians/Pacific Islanders were most likely to have surgery, followed in order by Whites, Blacks, and American Indians/Alaskan Natives.
Table 2.
Surgery status organized by race, 17 SEER registries, 2004–2007.
| Surgery Status | % (95% CI, N) | |||
|---|---|---|---|---|
| American Indian/ Alaska Native | Asian/Pacific Islander | Black | White | |
| Surgery Performed | 40% (32–48%, 30) | 69% (67–71%, 462) | 52% (50–54%, 668) | 62% (61–63%, 3,755) |
| Surgery Not Performed | ||||
| Surgery Not Recommended | 47% (39–55%, 35) | 27% (25–29%, 182) | 40% (38–42%, 517) | 34% (33–35%, 2,069) |
| Surgery Recommended, Not Performed | 12% (7–17%, 9) | 3% (2–4%, 18) | 5% (4–6%, 60) | 3% (3–3%, 175) |
| Unknown If Surgery Performed | 1% (0–3%, 1) | 1% (0–2%, 10) | 3% (2–4%, 37) | 1% (1–1%, 88) |
| Total Count | 75 | 672 | 1,282 | 6,087 |
Benign Cerebral Meningiomas: Exploratory Analyses for Comparison
In order to explore the possibility that the higher rates of pituitary adenomas seen in Blacks is potentially related to incidental imaging procedures, we examined rates for benign cerebral meningiomas. Poisson regression indicated a main effect on incidence rates for race, p < .0001 (Figure 4). All six pairwise comparisons for the four racial groups were significantly different, all p <.0001. As with pituitary adenomas, Blacks had the highest incidence rates followed in order by Whites, Asian/Pacific Islanders, and Native American/Alaskan Natives. There were also main effects for age (incidence rates increasing with age), p < .0001. In contrast, there was a main effect for sex, p < .0001, with higher incidence rates for females. The age by sex interaction was also significant, p < .0001. In this case, however, the interaction took the form of a greater sex difference as age increased; there was not a cross-over interaction as for pituitary tumors.
Figure 4.
Incidence rates for benign cerebral meningiomas by age and race, 17 SEER registries, 2004–2007.
Discussion
We used a comprehensive, population-based resource to examine demographic differences in incidence rates for pituitary adenomas. To our knowledge, this is the first time that the SEER database has been used to examine the demography of pituitary adenomas in the United States.
Differences by Age and Sex
We observed that pituitary adenoma incidence rates generally increased with age, at least until 80 years of age. However, female rates were higher among younger persons and male rates were higher among older persons. Similar findings were reported by Hemminki et al. using data from the Swedish Cancer Registry [5]. We also showed that males are diagnosed with larger tumors on average than females. This corresponds to findings from Nabarro who found that males were more likely to present with large pituitary tumors and women were more likely to present with small tumors [15]. This is consistent with the observation that diagnosis of pituitary tumors (prolactinomas in particular) may be delayed for males [7], giving the tumors a chance to grow larger before clinical detection. Furthermore, we demonstrated that the sex difference in tumor size is magnified in early life. This is probably because the more clinically severe cases (with larger tumor size) in males are likely to be the ones that are detected. Indeed, Nabarro observed that men were more likely to present with symptoms like visual disturbances, seizures, and other neurological symptoms; women were more likely to present with disturbances in sexual functioning.
Racial Differences
We observed that American Blacks have higher incidence rates for pituitary adenomas compared with other ethnic groups. The higher incidence rates for Blacks suggest that similar findings from data collected from the late 1950s through 1970 [8,9] do not necessarily reflect a mere cohort effect. This is a robust finding that has lasted across decades and geography. What is causing these higher incidence rates, however, is not clear.
One possible explanation is that the racial differences in incidence rates are naturally occurring. The study of Heshmat et al. [8] supports this possibility with the finding that African Blacks have higher relative proportions of pituitary adenomas compared to American Whites (although still not as high as American Blacks). A second possibility is that Blacks have a different clinical presentation of pituitary adenomas and this draws attention to the condition. For example, pituitary adenomas may somehow lead to increased visual or endocrine disturbances in Blacks. Unfortunately, the SEER*Stat database does not contain information on presenting symptoms or clinical progression.
A third possibility is that the higher incidence rates can be explained as incidental findings. For example, Blacks have higher stroke rates than other racial groups [16], and discovery of pituitary adenomas could be incidental to a corresponding higher rate of head imaging procedures. Given the much higher prevalence of pituitary adenomas identified in autopsy and radiography studies of non-clinical samples compared to the incidence rates seen in this study, one could hypothesize that imaging for other reasons could identify clinically non-significant tumors. If this is the case, we might expect to find higher incidence rates in Blacks for other benign brain tumors. Benign cerebral meningiomas appear to provide a good comparison because, like pituitary adenomas, they tend to be slow-growing, are associated with nonspecific symptoms, and are often incidentally diagnosed [17]. Indeed, we did find higher meningioma incidence rates for Blacks using the data from the SEER programs. The similar pattern of results between two distinct kinds of benign brain tumors supports the idea that there may be a common factor correlated with race that leads to incidental detection of both tumors.
Also consistent with the possibility of incidental diagnosis is the finding that Blacks were more likely to have their adenomas diagnosed through radiography alone (i.e., without microscopic confirmation). The SEER*Stat database does not indicate the reason that radiography was performed, and it could have been performed for reasons other than for a cancer diagnosis. However, it was also observed that the majority of the tumors in Blacks were large enough to be confirmed microscopically, and the racial/ethnic differences in incidence rates remained even when analyses were restricted to those cases that were microscopically confirmed.
If tumors were more likely to be incidentally diagnosed among Blacks, we might expect to see smaller tumors for Blacks. This, however, was not the case; tumor sizes for Blacks were actually slightly larger than those in Whites. With this in mind, it is especially interesting to note that Blacks had lower rates of surgical treatment than other racial groups. If lower treatment rates for tumors leads to adverse outcomes, this may represent yet another racial/ethnic treatment disparity [18–21].
The SEER programs have provided a rich source of data that has allowed us to document robust phenomena and explore several potential explanations. Nonetheless, these data are limited in several ways. For example, the SEER programs mainly collect information from patient medical records. Variables that are not reliably reported in medical records, therefore, will not be useful from an analytic perspective. For this study, almost a third of the cases did not have tumor size data recorded, and that data should therefore be carefully interpreted; it is very possible that the size data for smaller tumors were not available and the values presented here primarily represent a larger subset of tumors.
Similarly, to thoroughly examine some of the hypotheses for the racial effects, it would help to have data on clinical presentation, complete treatment prescription, diagnostic pathway, classification (e.g., functional status), and co-morbidity. Although this information is not collected by SEER abstractors, it may be present in the linked SEER-Medicare database. In fact, the SEER-Medicare database might prove to be exceptionally useful in clarifying these effects since it provides rich data on co-morbidities and treatments. Since the SEER-Medicare resource primarily contains information for those 65 years of age and older and the racial differences in incidence of pituitary adenoma are especially pronounced in later life, it seems uniquely suited to clarify some of the issues raised in this paper.
Acknowledgments
The authors would like to thank Brian J. Smith for statistical advice, Michele West for assistance with SEER*Stat, and two anonymous reviewers for helpful feedback on an earlier draft of this manuscript. This project was supported in part by the National Institutes of Health (project numbers 5 P20 CA103672-05 and 5 P30 CA086862-10). Additional funding was provided by cooperative agreement number 5 U18 HSO16094 from the Agency for Healthcare Research and Quality. The content is solely the responsibility of the authors and does not necessarily represent the official views of the Agency for Healthcare Research and Quality.
References
- 1.Buurman H, Saeger W. Subclinical adenomas in postmortem pituitaries: Classification and correlations to clinical data. Eur J Endocrinol. 2006;154:753–758. doi: 10.1530/eje.1.02107. [DOI] [PubMed] [Google Scholar]
- 2.Costello RT. Subclinical adenoma of the pituitary gland. Am J Pathol. 1936;12:205–216. [PMC free article] [PubMed] [Google Scholar]
- 3.Yamada S. Epidemiology of pituitary tumors. In: Thapar K, Kovacs K, Scheithauer BW, Lloyd RV, editors. Diagnosis and management of pituitary tumors. Humana Press, Inc; Totowa, NJ: 2001. [Google Scholar]
- 4.Melmed S. Mechanisms for pituitary tumorigenesis: The plastic pituitary. J Clin Invest. 2003;112 (11):1603–1618. doi: 10.1172/JCI20401. [DOI] [PMC free article] [PubMed] [Google Scholar]
- 5.Hemminki K, Försti A, Ji J. Incidence and familial risks in pituitary adenoma and associated tumors. Endocr Relat Cancer. 2007;14:103–109. doi: 10.1677/ERC-06-0008. [DOI] [PubMed] [Google Scholar]
- 6.Franks S, Nabarro JDN. Prevalence and presentation of hyperprolactinæmia in patients with “functionless” pituitary tumors. Lancet. 1977;1 (8015):778–780. doi: 10.1016/s0140-6736(77)92959-2. [DOI] [PubMed] [Google Scholar]
- 7.Ciccarelli A, Daly AF, Beckers A. The epidemiology of prolactinomas. Pituitary. 2005;8:3–6. doi: 10.1007/s11102-005-5079-0. [DOI] [PubMed] [Google Scholar]
- 8.Heshmat MY, Kovi J, Simpson C, Kennedy J, Fan KJ. Neoplasms of the central nervous system. Cancer. 1976;38:2135–2142. doi: 10.1002/1097-0142(197611)38:5<2135::aid-cncr2820380543>3.0.co;2-t. [DOI] [PubMed] [Google Scholar]
- 9.Fan KJ, Kovi J, Earle KM. The ethnic distribution of primary central nervous system tumors: AFIP, 1958 to 1970. J Neuropathol Exp Neurol. 1977;36:41–49. doi: 10.1097/00005072-197701000-00005. [DOI] [PubMed] [Google Scholar]
- 10.Surveillance Research Program, National Cancer Institute. [Accessed 9 July 2010];About the SEER program. 2010 http://seer.cancer.gov/about/
- 11.Surveillance Epidemiology and End Results Program. SEER*Stat database: Incidence - SEER 17 regs limited-use + Hurricaine Katrina impacted Louisiana cases, Nov 2009 sub (2000–2007) - linked to county attributes - total US, 1969–2007 counties. National Cancer Institute, DCCPS, Surveillance Research Program, Cancer Statistics Branch; 2010. April edn. [Google Scholar]
- 12.Fritz A, Percy C, Jack A, Shanmugaratnam K, Sobin L, Parkin DM, Whelan S, editors. International classification of diseases for oncology (ICD-O) 3. World Health Organization; Geneva: 2000. [Google Scholar]
- 13.Tiwari RC, Clegg LX, Zou Z. Efficient interval estimation for age-adjusted cancer rates. Stat Methods Med Res. 2006;15 (6):547–569. doi: 10.1177/0962280206070621. [DOI] [PubMed] [Google Scholar]
- 14.The SAS Institute. SAS. 9.2. The SAS Institute, Inc; Cary, NC: 2008. [Google Scholar]
- 15.Nabarro JDN. Pituitary prolactinomas. Clin Endocrinol (Oxf) 1982;17:129–155. doi: 10.1111/j.1365-2265.1982.tb01573.x. [DOI] [PubMed] [Google Scholar]
- 16.Thom T, Haase N, Rosamond W, et al. Heart disease and stroke statistics - 2006 update: A report from the American Heart Association Statistics Committee and Stroke Statistics Subcommittee. Circulation. 2006;113 (6):e85–151. doi: 10.1161/CIRCULATIONAHA.105.171600. [DOI] [PubMed] [Google Scholar]
- 17.Radhakrishnan K, Bahram M, Parisi JE, O’Fallon WM, Sunku J, Kurland LT. The trends in incidence of primary brain tumors in the population of Rochester, Minnesota. Ann Neurol. 1995;37:67–73. doi: 10.1002/ana.410370113. [DOI] [PubMed] [Google Scholar]
- 18.Curtis E, Quale C, Haggstrom D, Smith-Bindman R. Racial and ethnic differences in breast cancer survival: How much is explained by screening, tumor severity, biology, treatment, comorbidities, and demographics? Cancer. 2008;112:171–180. doi: 10.1002/cncr.23131. [DOI] [PMC free article] [PubMed] [Google Scholar]
- 19.Bach PB, Cramer LD, Warren JL, Begg CB. Racial differences in the treatment of early-stage lung cancer. N Engl J Med. 1999;341:1198–1205. doi: 10.1056/NEJM199910143411606. [DOI] [PubMed] [Google Scholar]
- 20.Morris AM, Billingsley KG, Hayanga AJ, Matthews B, Baldwin L-M, Birkmeyer JD. Residual treatment disparities after oncology referral for rectal cancer. J Natl Cancer Inst. 2008;100:738–744. doi: 10.1093/jnci/djn396. [DOI] [PMC free article] [PubMed] [Google Scholar]
- 21.Fenton JJ, Tancredi DJ, Green P, Franks P, Baldwin L-M. Persistent racial and ethnic disparities in up-to-date colorectal cancer testing in medicare enrollees. J Am Geriatr Soc. 2009;57:412–418. doi: 10.1111/j.1532-5415.2008.02143.x. [DOI] [PubMed] [Google Scholar]


