

Abstract
Bacteria and archaea have evolved an adaptive, heritable immune system that recognizes and protects against viruses or plasmids. This system, known as the CRISPR-Cas system, allows the host to recognize and incorporate short foreign DNA or RNA sequences, called ‘spacers’ into its CRISPR system. Spacers in the CRISPR system provide a record of the history of bacteria and phage coevolution. We use a physical model to study the dynamics of this coevolution as it evolves stochastically over time. We focus on the impact of mutation and recombination on bacteria and phage evolution and evasion. We discuss the effect of different spacer deletion mechanisms on the coevolutionary dynamics. We make predictions about bacteria and phage population growth, spacer diversity within the CRISPR locus, and spacer protection against the phage population.
1 Introduction to CRISPR
1.1 CRISPR
The newly discovered CRISPR system in bacteria and archaea is a fascinating system for experimentalists and theorists. CRISPR was initially discovered in the gene sequence of Escherichia coli [1]. Ishino et al. found an unusual structure in the 3′-end flanking region of the iap gene, namely repeats of the same 29 nucleotides, each separated by spacers of 32 non-repeatable nucleotides. Inside each repeat there are two short sequences of DNA that are nearly reverse complements of each other, i.e. nearly palindromic sequence. These two palindromic DNA sequences, e.g. TTGTAC and GTACAA in Fig. 1a, are transcribed into RNA sequences e.g. UUGUAC and GUACAA in Fig. 1b, that can base pair to form a stable hair pin loop, as in Fig. 1c. The discovery of these repeat sequences in E. coli spawned an extensive search for similar interspersed and repetitive DNA sequences in other bacteria and archaea. To date these structures have been identified in 40% of bacteria and 90% of archaea [2–5]. They are now termed clustered regularly interspaced short palindromic repeats (CRISPR) [6].
Figure 1.

a) Typical repeat in S. thermophilus CRISPR1, data taken from [7]. b) RNA repeat. c) Left: secondary structure (hairpin) of RNA repeat. right: pre crRNA. d) Targeting and protecting during CRISPR immunity.
Bacteria or archaea can encode one or more CRISPR systems in their genome. Although the CRISPR gene structure varies greatly between different species, it has a few common features. It always has a leader-repeat-spacer-repeat-spacer… organization. Repeats are the regions with the same nucleotide sequences with nearly palindromic symmetry. The length of the repeat ranges from 23 bp to 47 bp in different organisms. Spacers are the nucleotide regions between the repeats. The length of the spacer ranges from 21 bp to 72 bp in different organisms [3]. Leaders are AT rich sequences located at the 5′ end of the CRISPR system. Leaders serve as an indicator of the beginning of the CRISPR system and give it a polarity. Leader sequences of different CRISPR systems in the same species are the same [6, 7]. Leaders serve as the recognition site for the addition of new spacers, and new spacers are always added to the leader proximal end of the CRISPR [8,9].
1.2 CRISPR is an immune system
CRISPR is part of the immune system of bacterial and archaea. This functionality was discovered while studying phage resistance in Streptococcus thermophilus, a lactic acid bacterium used in the production of yogurt from milk [10–12]. Like other types of bacteria, milk lactic acid bacteria can be infected by viruses known as bacteriophage, and phage infection is the major cause of milk fermentation failure. It was observed that not all of the milk lactic acid bacteria cease to grow upon challenge with bacteriophage [9,13]. Some of the bacteria were phage resistant. Extensive genome sequencing of lactic acid bacteria and virulent phage led to a better understanding of the difference between phage resistant bacteria and phage sensitive bacteria. Bacteria with phage resistance have CRISPR systems in their genome with spacer sequences that match the specific phage to which they are resistant. Upon challenge with a new type of phage, vulnerable bacteria strains have the ability to acquire sequences, termed protospacers, from the phage genome that are inserted into their CRISPR next to the leader sequence. This newly acquired spacer contains genetic information from the population of currently infecting phage. Descendants of these bacteria inherit their ancestor’s genome with the inserted spacers and are phage resistant. The connection between the CRISPR related immune system, and phage resistance was confirmed in several laboratory experiments [8]. A phage-resistant strain of bacteria remained phage resistant upon removal of all spacers except the one derived from the phage of interest. A phage resistant strain became phage sensitive upon removal of the specific spacer derived from the phage of interest even when all the other non-relevant spacers were present. When the matching spacer was added back into the CRISPR, the previously phage-sensitive bacteria became resistant to that specific phage, but were susceptible to new phages with different genomes. Bacteria can be immune to more than one type of phage if different CRISPR spacers match different phage genomes. To sum up, a CRISPR spacer matching a protospacer sequence in a phage genome provides resistance against that specific phage.
1.3 Mechanism of CRISPR action
The CRISPR system as well as the CRISPR associated (Cas) genes located in the vicinity of CRISPR are essential components of a functional CRISPR-associated complex of antiviral defense (Cascade) system. The components of the Cascade system can be isolated from bacteria and reconstituted for study in vitro, and the mechanism of Cascade action has been investigated in both E. coli and S. thermophilus [8,14–16]. The Cascade defense process starts with spacer acquisition, proceeds with CRISPR expression, and finishes with CRISPR interference. During spacer acquisition, Cascade recognizes a foreign nucleic acid sequence, i.e. a protospacer. In the case of S. thermophilus, short conserved regions within a few bases of the protospacer sequence are identified as CRISPR motifs. These CRISPR motifs serve as signal for the bacteria’s Cascade system to recognize the protospacer. Upon recognition, a new sequence of nucleic acid identical to the protospacer is generated and integrated into the CRISPR system as a newly acquired spacer. During CRISPR expression, the spacer is transcribed into pre-crRNA. With the participation of the Cas protein, pre-crRNA matures into small crRNAs [14]. Within each crRNA, the transcript of a single palindromic repeat folds into a stable hairpin shape termed a handle with several stable base pairs, which may serve as a platform for RNA-binding Cas proteins [7]. The CRISPR spacer is connected to one end of the hairpin structure in each crRNA transcript. The crRNA is transported to the target phage DNA [17–19] or RNA [20]. During CRISPR expression, the crRNA guide the Cas complex to foreign nucleic acids. The expressed spacer sequence provided by the crRNA is thought to recognize and guide the complex to bind the specific protospacer target sequence. Cas proteins with nuclease activity then cleave the invading nucleic acids in order to inhibit phage infection. If there is no match between the CRISPR spacer and the phage DNA, the phage is not neutralized by the spacer transcript. In this case, the phage can reproduce inside the bacteria and lead to bacteria lysis and death. This process is illustrated in Fig. 1d.
1.4 CRISPR maintenance
CRISPR can acquire new spacers from protospacer sequences within a phage genome. This process is shown in Fig 2. Although the addition of a single new spacer is a low probability event, it can occur in at least some cells within a population of bacteria upon the phage challenge. Newly acquired spacers are inserted at the leader-proximal end [7, 16]. The number of repeat-spacer units per CRISPR ranges from a few to hundreds [19, 21], with a typical length of 30–100 spacers. For example, one strain of S. thermophilus has 32 spacers [9]. Since the CRISPR cannot grow to infinite length, deletion of older spacers is required, and deletion has been documented concomitantly with spacer addition. The mechanism of spacer deletion is unclear, especially the location of deletion. One hypothesis is that the oldest spacer is the least needed in the current viral environment and should be deleted. Under this hypothesis, the deletion always happens at the leader distal end of the CRISPR. Another hypothesis is that the deletions can happen in the middle of CRISPR locus at random locations, or at locations following a certain distribution, such as linear distribution within the cluster, perhaps by recombination. Deletion at the leader-distal end and internal deletion are found in bacteria [22]. Moreover, deletion of greater than one spacer at a time is also observed in S. thermophilus [9]. Taken altogether, these experiments indicate that maintenance of CRISPR system by spacer addition and deletion occurs.
Figure 2.
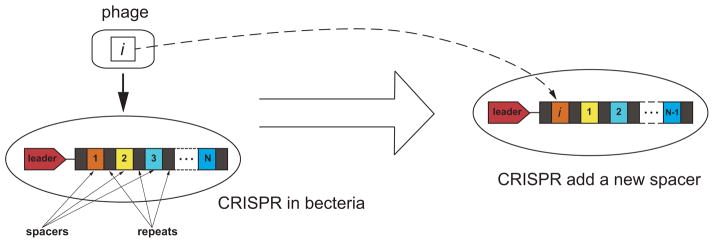
Addition of a new spacer to the CRISPR locus at the leader-proximal end. The protospacer in virus i added to CRISPR. Spacers 1– (N −1) are shifted to the right. Spacer N is deleted. Other deletion mechanisms will be discussed later.
1.5 Bacteria/phage co-evolution
The CRISPR immune system imposes a selection pressure on the phages. Conversely, the phages also impose a selection pressure on the bacteria. The efficiency of the CRISPR immune system has a direct impact on the fitness of the bacteria. Since bacteria are surrounded by multiple strains of phages, bacteria with CRISPR-containing spacers matching many phages are more likely to survive and reproduce. Due to evolution of the phages, the CRISPR spacers must be continually updated to protect against new phage sequences. The phage fitness depends on its ability to avoid recognition by CRISPR. There are several mechanisms of phage evolution. Phages can overcome CRISPR recognition by acquiring a single mutation [8, 9]. This will cause a mismatch between the spacer transcript of cr-RNA and the invading phage protospacer, leading to failure of the CRISPR interference. Another CRISPR-evading strategy is recombination between phages during coinfection in bacteria. Recombination is an inherent feature of phage evolution. Metagenomic studies of different phage population document large scale recombination in phage [23]. Recombination can lead to a more rapid rate of phage evolution away from CRISPR recognition than does point mutation. First, recombination of previously established mutations incorporates mutations that have already been selected for increased fitness, i.e. mutations at less risk of altering essential protein function. Second, recombination can integrate multiple beneficial point mutations in one step, and it may be the case that l > 1 mismatches between the crRNA and protospacer are required for the phage to escape CRISPR recognition. Thus, we expect recombination will allow phage to evade CRISPR more effectively than point mutation alone.
1.6 Motivation
The role of recombination has been under-studied, even though it is a significant driver of evolution [19]. Recombination and other mechanisms for generating genomic diversity are especially important in coevolving systems with large population density. Here, we study the effect of recombination on bacteria-phage coevolution. We use a physical model that incorporates selection pressure, and we allow both recombination and mutation to occur. The theory and model provide time-resolved ‘snapshots’ of this coexistence. We focus on the case where bacteria and phage coexist, i.e. neither bacteria nor phage are driven extinct. That is, we choose parameters of the system to establish a robust coexistance so that bacteria and phage both have stable populations without species extinction. We study the effect of different spacer deletion mechanisms, which is important for understanding how CRISPR functions and interpreting patterns of CRISPR variation in natural populations of bacteria.
In this paper we establish a physical model of bacteria-phage convolution and study the impact of recombination, spacer deletion, and non-linear growth dynamics in this system. In the Methods section, we introduce mean field population dynamics equations and a stochastic simulation to sample the underlying Markov process. In the Results section, we discuss the effect of a non-linear density-independent growth rate on the population dynamics. We demonstrate heterogeneity of spacer diversity in different spacer locations within CRISPR. We predict the spacer usage with respect to spacer location. We investigate three different deletion mechanisms: deletion of the oldest spacer, deletion of older spacers with increased probability, and deletion of a random spacer. We study the impact of recombination and mutation on the evolutionary dynamics. In the Discussion session, we relate observations from our physical model to experimental and natural coevolution of bacteria and phage. We conclude in the last section.
2 Methods
2.1 Co-evolution model
We consider a coexisting system composed of bacteria and phages. Each bacterium can have a different CRISPR system and there are multiple strains of phages. The evolution of the bacteria and phages is interrelated and changes dynamically. Bacteria with higher fitness have more descendants, and the number of bacteria with that CRISPR system increases. At the same time, phages with unsuccessful CRISPR evading strategies cease to reproduce, and the number of those strains decreases. Since there are different sequences of bacteria and strains of phages, the total population of both the bacteria and phages can reach a steady state even though the population of each bacterial sequence or phage strain may be changing with time. This steady state is what we are interested in. The total number of bacteria and the total number of phages reach the maximum steady-state values, after an initial exponential growth phase.
2.2 Events
We describe the bacteria-phage community dynamics using a population dynamics model [24]. The population structure of the bacteria and phages changes based on several events. The bacteria can reproduce at a certain rate until they reach the maximum capacity, defined by the available resources. This rate can be constant or dependent on the phage population. The phages reproduce at another rate, which can also be constant or dependent on the total number of bacteria, until the maximum carrying capacity of the phages is reached. Upon exposure to phage, a bacterium has the opportunity to acquire a protospacer from that phage, which will be inserted into the leader-proximal end of CRISPR in that bacterium. We assume that phages can mutate at some defined rate or they can recombine with other phages, also at a certain rate. Either process leads to avoidance of CRISPR recognition by the evolved phages. Recombination has the additional advantage that it can combine the benefits of multiple mutations, which can provide the recombined phage with a higher fitness.
2.3 CRISPR details
The number of spacers that a CRISPR contains varies between types of bacteria. Most CRISPR contain fewer than 50 spacer repeats. We here set the maximum number of spacers in CRISPR to be 30. Upon phage attack, a new spacer can be acquired and inserted at the leader-proximal end of CRISPR. We label the leader-proximal position of the spacer to be position 1, and the leader-distal position of spacer to be position 30. In general, positions with smaller index host “younger” spacers. When a new spacer is added to a CRISPR that already has 30 spacers, spacer deletion occurs to maintain a maximum length of CRISPR. We investigate three different types of spacer deletion: delete the “oldest” spacer; delete a spacer with a possibility proportional to its distance to the leader end, and delete spacer at a random position.
2.4 Phage details
Each phage genome is assumed to contain only a single protospacer. This protospacer is what our dynamics depend on, so we track only the protospacer part of the phage genome. It is known that a single phage may contain multiple protospacers [8], often localized in the early expressed, coding region of the phage genome [9]. We here simplify the biology, assuming only a single protospacer per phage. The protospacer in the genome of each phage is expressed as a bit string. Each bit of the string can be either “0” or “1”. The length of the phage bit strings is n, and there are 2n types of phage genomes. In our simulation, we set n = 10. Therefore, we have 210 genome types available for phage. Initially, the population distribution of phage follows a logarithmic distribution p(i) = log(150) − log(i), i = 1, …, 150, where p(i) is proportional to the percentage of ith phage strain. This distribution has been used to fit experimental data [25]. We start with 149 strains of phage with this distribution, and they evolve over time.
When phage replicate, there is a chance for phage to mutate with a rate μ per genome per replication. This is part of the CRISPR-evading strategy of phage. We choose a random location in the phage genome to be the location of the point mutation. As this location, we alter the phage sequence from “1” to “0” or from “0” to “1”. The probability for n mutations in one sequence is μne−μ/n!.
2.5 Mean field approximation and Monte Carlo method
We used two methods to study this system: a standard numerical fourth-order Runge-Kutta method to solve the mean-field differential equations and a stochastic simulation using the Lebowitz-Gillespie algorithm [26] to sample the Markov process. Both methods converge to the same result in the limit of a large population.
In the mean-field or infinite-population, spatially homogeneous limit the system can be described by the differential equations [24]
| (1) |
| (2) |
We have set the number of spacers in CRISPR to 2 initially. We also initially do not consider virus evolution. The population of bacteria with spacer i in position 1 and spacer j in position 2 is xi,j, where the maximum bacteria population is xmax. The phage population is vk, where the maximum phage population is vmax. Here Θ (xmax − Σi,j xi,j) is a step function. When xmax > Σi,j xi,j, Θ has a value of 1, otherwise it is 0. Each population grows until it reaches its maximum value. Maximum population sizes are given from ecology and are due to maximal carrying capacities in the case of bacteria or number of available hosts in the case of viruses. The dynamics of the population depends on the events described earlier. Bacteria grows at a rate c until they reach the maximum population. Phage grow at a rate r, which could be dependent or independent of bacteria population Σi,j xi,j. Bacteria have an exposure rate β to the phage. Upon phage attack, bacteria have a probability γ of acquiring a new spacer from the protospacer in the phage genome, independent of the current spacers within the CRISPR. The rate of spacer addition is βγ Σk vk. Conversely, when the bacterial CRISPR system is unable to recognize the invading foreign genetic material, lysis of the bacteria occurs after infection. The rate of bacteria killed by phage is β Σk≠i,j vk. The term βγ Σm xj,mvi represents the process of converting other types of bacteria into type i, j. The term βγ Σk xi,jvk represents the process of converting type i, j into other types of bacteria. When the CRISPR locus contains spacers matching the viral genetic profile, the phage is disarmed and eliminated. The rate of phage killed by bacteria is β Σi,j xi,j(δi,k + δj,k).
We also use the Lebowitz-Gillespie algorithm to sample the stochastic process of bacteria phage coevolution. In this stochastic process we include the mutation and recombination events described in Section 2.4. The Lebowitz-Gillespie algorithm computes trajectories for a Markov process in which the rate φi of the every event i is known. The algorithm works as follows: at time t = 0 a list of all possible rates φi in the system is formed. One event is randomly chosen to happen from the list with a probability proportional to its rate. There are five categories of events in the list. 1) A bacteria can be randomly chosen to reproduce at a rate c. Overall, bacteria reproduce at a rate of φ1 = cx, where x = Σi,j xi,j is the total bacteria population and xi,j is the population of bacteria strain with spacers i and j. 2) A bacteria can be killed by phage with a rate of β Σk≠i,j vk, where vk is the population of phage strain with protospacer k. Overall, bacteria are killed by phage at a rate of φ2 =Σi,j β Σk≠i,j vkxi,j. 3) A new spacer can be added to a randomly chosen bacteria with a rate of βγv, where v = Σk vk is the total phage population. This new spacer is chosen from the protospacers among all the phage according to the rate βγvk. Overall, new spacers can be added to bacteria with the rate φ3 = βγvx. 4) A phage can be randomly chosen to reproduce at a rate of r0. Overall, phage reproduce at a rate of φ4 = rv. 5) A phage can be killed by bacteria at a rate of β Σi,j xi,j(δi,k + δj,k). Overall, phage are killed by bacteria at a rate of φ5 = Σk β Σi,j vkxi,j(δi,k + δj,k). Time is incremented by − ln(u)/Σ φi, where u is a uniform random number ∈ (0, 1]. The rates of all possible events are then updated, if they have changed. We iterate this process until time reaches the specified final time. See Fig. 3. When the maximum population size is reached and a growth move is attempted, a random member of the population is deleted during replication.
Figure 3.

In the Markov process, five categories of transition events change the state of the system. The rates of all of these events are denoted by φi. Processes 2, 3, and 5 all result from phages infecting the bacteria. Processes 4 results from phage infecting some bacteria, which could be the population under study, or a different host population of bacteria. There is an additional category of events, not shown in this figure, which is evolution of the virus due to mutation or recombination.
Initially, we start with 149 types of phage with a logarithmic-decay population structure, p(i) = log(150) − log(i), i = 1, …, 150, where p(i) is proportional to the percentage of ith phage strain. Every new bacteria has a CRISPR with 30 empty spacers, i.e. all value of spacers are null. The initial population of phage is 1000, the initial population of bacteria is 4000.
2.6 Density dependence of growth rate
The model of the previous section applies when the phage grow not only in the bacteria we study, but also in another set of background bacteria. These background bacteria are the hosts providing the approximately constant growth rate of the phage, r0. The populations of bacteria and phage are dynamically changing with time. At short times, starting from an initially small population, the bacteria grow exponentially until stabilizing at the maximum population size. This is shown by the magenta curve overlaid on top of the red curve in Fig. 6. We now set the maximum number of spacers to be 30. Similarly, the phage population grows exponentially for a short period of time until stabilizing at the maximum phage population size. If the background bacteria are quite numerous, then the phage can have a growth rate independent of the bacteria under study, labeled by x.
Figure 6.

Population of bacteria and phages with time. We show results for constant and density-dependent phage growth rates. The parameters are c = 0.15, r = 0.05, β = 2 × 10⁻⁵, and γ = 0.1. The mutation rate per sequence per replication is μ = 0.01. The maximum population of phage is vmax = 6000, and the maximum population of bacteria is xmax = 12000. The maximum number of spacers in a CRISPR is 30. When the number of spacers in the CRISPR array is over 30, the oldest spacer is deleted from the leader-distal end. There are 149 phage strains with a logarithmic initial population distribution.
If there is no such set of background bacterial hosts, the phage growth rate may depend directly on the bacteria we study, labeled by x. In this case, the reproduction rate of phage k is a time dependent function of the bacteria population, i.e. rk = r0 Σi≠k,j≠k xi,j/xmax, where xmax is the maximum population of bacteria. The average replication rate is 〈rk〉 = Σk Σi≠k,j≠k xi,jvk/(xmax Σl vl). A simplified form if most of the bacteria population is available to any given phage is r = r0 Σi,j xi,j/xmax for all phages. At short times, the immunity has not built up yet, and the condition i ≠ k, j ≠ k is irrelevant. The only difference between the non-linear and constant growth rates at short time is a slightly slower increase of the phage population in the non-linear case. The blue and black curves in Fig. 6 show phage populations with constant and density-dependent growth rates differ only at short times.
In general, we are interested in the case where the phage and bacteria populations reach steady-state. In this case, there will be an effective growth rate of the phage. This effective growth rate is r0 in the linear model. Because the bacteria reach the maximum population size quickly, and because the non-linear growth model is different from the linear model only when the bacteria are below the maximum population size, the growth dynamics of the non-linear and linear model differ only at short times. At long times, most of the bacteria population will still be available to any given phage for growth, and so 〈rk〉 ≈ r ≈ r0. In particular, we find 〈rk〉/r is unity for t < 200, and rises only to 0.97 at t = 2000 for the parameters we use in section 3.2. Even for the parameters corresponding to a more effective immune system in section 3.4, this quantity is unity for t < 200, 0.93 for t = 600, and 0.82 for t = 2000. These results justify the assumption that most of the bacteria population is available to growth of any given phage. Thus, the non-linear and linear growth models only differ at very short times when the bacterial population is not yet the maximum size, or at rather long times if the diversity of the phage population is driven to low values. The non-linear and linear growth models would also differ if the bacterial population were driven extinct, a situation we do not consider in the present work.
2.7 Method validation
To validate the stochastic method, we compare it to the solution of the differential equation. Both results converge to the same result in the limit of large population. This convergence is evident in the population versus time curve, Fig. 4.
Figure 4.

The solution of the differential equation and the result of the stochastic method. Parameters are c = 0.15, r = 0.045, β = 2 × 10⁻⁵, γ = 0.1, vmax = 17500, and xmax = 4500. There are 2 spacers in a CRISPR. The error bars are one standard error. The bacterial growth rate sets the explicit time scale in this model.
2.8 Diversity measurements
The Shannon entropy of spacers at a specific location is a measure of the diversity of the spacers at that location. A larger Shannon entropy indicates more diversity of spacers. We, thus, measure the diversity of spacers by the Shannon entropy: The diversity for the ith spacer is defined as
| (3) |
where pi(k) is the observed probability to have sequence k at position i.
Because new spacers are always added to the leader-proximal end, the spacer with smaller index is “younger” than the spacer with larger index. If the phage do not impose selection pressure on the bacteria, all spacers are randomly selected and inserted into the leader-proximal end of the CRISPR, and we will observe homogeneous diversity at all positions of CRISPR. With selection pressure, the diversity of CRISPR may decline toward the leader-distal end of the CRISPR if the distribution of phage genotypes is biased, as has been observed in experiments [7, 8, 23, 25, 27]. Gaps and insertions in the CRISPR array may result in different bacteria having nearly the same spacer content, but at slightly shifted spacer positions. This dephasing will be observed as a reduction of Di values relative to what could be observed with multiply aligned sequences.
We also define a diversity that averages out the effect of spacer position. The definition is
| (4) |
where N is the number of spacers within the CRISPR.
In addition, we define the diversity of the phage. This is simply Eq. (3), but applied to the single protospacer in each phage, rather than spacer i of each bacteria.
2.9 Spacer effectiveness
We count the number of matches between the spacer at position i of the CRISPR and the current phage strains. We use this count as a measure of protection offered by spacer. The bigger this count is, the more frequently the spacer can be used, and the more effective the spacer is at protecting the bacteria from the phages. A higher frequency of usage indicates a strong protection. Since the spacers at the leader-proximal end are recently acquired and reflect the current viral environment, these spacers should be highly used and offer the strongest protection against current phages. Within one CRISPR, we expect a decline of the protection with respect to position from the leader-proximal.
2.10 Recombination in the Phages
Another CRISPR-evading strategy of phage is recombination. Recombination can recombine multiple existing point mutations or even different strains. When two phages infecting the same cell recombine, they swap a portion of their genetic materials. This swapping is a random process. For a given sequence, recombination happens with a randomly chosen other sequence at a given probability ν per sequence per replication. In this way, mutation rates and recombination rates have the same units. Also with this definition, equal recombination and mutation rates imply an equal probability of changing a given sequence by an evolution event, except for the relatively rare occurrence of recombination between two identical sequences. We simulate this random process as follows: To assemble the recombined phage from two existing parental strains, we first pick randomly which sequence to start copying, then a polymerase continues on that sequence with probability 1 − pc or switches to the other with probability pc until an entire offspring sequence is created. See Fig. 5.
Figure 5.

When multiple phages infect the same bacteria, two parents may produce a descendant by the polymerase copying along one strand with probability 1−pc and switching to another strand with probability pc. This process leads to recombination between the phage genomes.
3 Results
We are interested in the coexistence of bacteria and phage at long times. In these models, both the total phage and bacteria population grow to their maximum carrying capacity at long times. Density-dependent and constant growth rates produce the same results.
3.1 Diversity versus position
The diversity of spacers in the CRISPR system is measured using Shannon entropy, Eq. 3. We keep track of spacer diversity with respect to the position of the spacer. This is shown in Fig. 7. The diversity of the spacers at the leader-proximal end is higher than the diversity of the spacer at the leader-distal end.
Figure 7.

Diversity of spacers at CRISPR position i at different times. The parameters are the same as in Fig. 6.
3.2 Protection versus position
We define protection as a measure of spacer effectiveness, i.e. match of CRISPR spacers to phages. We calculate the ability of spacers at position i to protect against the current viral population. This is shown in Fig. 8. Since bacteria have the ability to acquire new protospacers from the phage population, and the insertion of new spacers happens at the leader-proximal end of the CRISPR, it is expected that the spacers at the leader-proximal end have the highest frequency of usage. The protection of the spacer falls off rapidly with distance from leader. Nonetheless, due to the random loss of spacers, some infection memory can be lost as time elapses.
Figure 8.

Protection afforded by spacers at different positions of CRISPR at different times. Protection is defined as the number matches between the spacer and the protospacers in the current phage population. The parameters are the same as in Fig. 6.
3.3 Deletion mechanism
The diversity of spacers with respect to the location of spacers for three different deletion mechanisms is shown in Figs. 7 and 9. There is a small but significant difference in the dynamics of these three models. Diversity versus time shows the same trend for all three methods: the leader-proximal end is more diverse, and leader-distal end is less diverse. Although the diversity decreases toward the leader-distal end of the CRISPR, it decreases the least when the oldest spacer is deleted. In random deletion, every spacer in CRISPR has the same possibility to be deleted. Even the newer spacer, closer to the leader-proximal end, can be deleted. As a result, the decrease of the diversity at the leader-distal end from the leader-proximal end is the largest among the three for random deletion. The decrease of diversity for the linear deletion mechanism is midway between that for the other two deletion mechanisms because leader-distal spacers with less diversity have more possibility to be deleted.
Figure 9.
Spacer diversity versus location when the probability of deleting spacer i is proportional to i. a) When the number of spacers in the CRISPR array is over 30, one spacer is selected to be deleted with a possibility proportional to its distance to the leader proximal end. b) When the number of spacers in the CRISPR array is over 30, one spacer at a random location is deleted. The parameters are the same as in Fig. 6.
3.4 Recombination versus mutation
We compare the impact of mutation and recombination on phage evolution. We define the minimum number of mismatches between the CRISPR and phage required for the phage to escape recognition as l. The bigger the value of l, the harder it is for the phage to escape from the targeting spacer. A value of l = 1 means if there is one or greater mismatch between the spacer and the phage genome, the spacer provides no protection against the phage. A value of l = 2 means that CRISPR recognizes the phage even if there is one mismatch between the spacer and the phage genome. For l = 2, if the spacer and the phage differ at one position, the phage is still recognized and neutralized by the targeting spacer, i.e. the CRISPR is more effective. This internal error tolerance makes it harder for phage to escape by mutating one bit of their protospacer for l = 2. If the number of mismatches is greater than one, the spacer provides no protection against the phage for l = 2. We show that there is little difference in the results for point mutation and recombination when l = 1. However, when l = 2, the difference in results between the point mutation and recombination becomes apparent. It is widely assumed that l = 1 describes phage recognition [8]. It seems likely, however, that a protospacer with a single mismatch would also be recognized, i.e. l = 2 should apply in at least some cases, and some evidence for single-mismatch recognition has been observed [9,18].
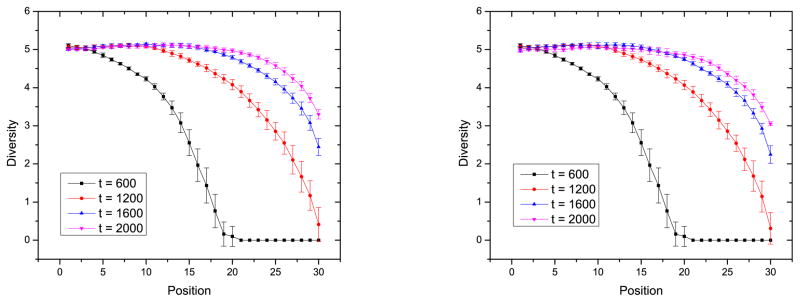
The different CRISPR-evading strategies of recombination and mutation have minimal impact on the spacer diversity with respect to position, as shown by Fig. 10 in comparison to Fig. 7. For l = 2, the spacers are slightly more diverse when phage recombine than they when mutate. Although recombination allows phage to make a more diverse set of descendants than does point mutation, the observed effect in the diversity of CRISPR is small. Thus, spacer diversity is not a sensitive measure to distinguish different CRISPR-evading strategies.
Figure 10.

Diversity at different positions of CRISPR at different times for l = 2 with a) mutation only and b) recombination only. In this case, CRISPR recognize phage with zero or one mismatch between the spacer in the bacterium and protospacer in the phage. The recombination rate per sequence per replication is ν = 0.01, and pc = 0.5. The other parameters are the same as in Fig. 6. Spacer diversity is not particularly sensitive to whether the phage evolve by mutation or recombination.
At long times, the diversity of the leader-proximal spacers decreases. This is because the diversity of the phage population itself decreases for large time. This diversity profile is shown in Fig. 11.
Figure 11.

Diversity of the phage for l = 2 with mutation only. The parameters are the same as in Fig. 10.
We define “immunity” as a measure of the possibility that CRISPR will kill phage: β Σk Σi,j xi,jvk(δi,k + δj,k). The higher the immunity is, the higher protection the spacer provides. Figure 13 shows that recombination gives phage more chance to survive and the CRISPR immunity is lower. When l = 1, immunity is similar whether pages escape by mutation or recombination, because the effectiveness of spacer is equal in regard to escape by point mutation or recombination. When l = 2, the immunity is higher against escape by mutation than it is against escape by recombination. Immunity decays more quickly with recombination rate than with mutation rate, Fig. 13.
Figure 13.
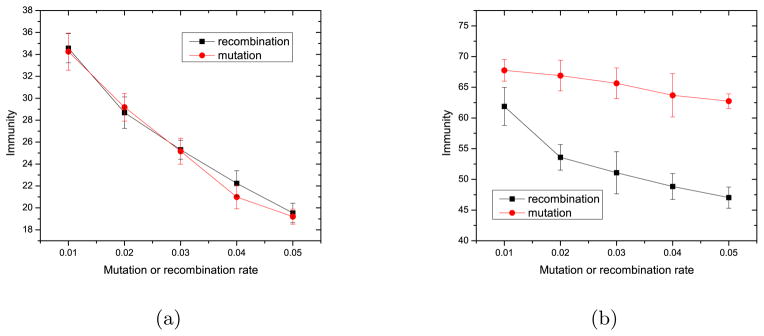
Immunity, β Σk Σi,j xi,jvk(δi,k + δj,k), at different mutation rate and recombination rate when l = 1 (a) and l = 2 (b). The other parameters are as in Fig 6. The immunity is averaged over the time range t = 100 to t = 300.
4 Discussion
We have addressed whether or not bacteria population dependence should be included in the phage growth rate, r. We have shown that a natural form of nonlinear growth dynamics makes no difference at long time in the regime where phage and bacteria coexist, although there is a slight difference at short time. Since we enforce co-existence, this detail is inessential under the conditions of our study. There are multiple strains of phage and bacteria, and most strains of the phage can grow in nearly all strains of the bacteria in our simulations.
The diversity of the spacers at the leader-proximal end shown in Fig. 7 is higher than the diversity of the spacer at the leader-distal end. This result is consistent with experimental observations on different bacteria [7,8,23,25,27]. The difference in diversity between these two ends decreases as time elapses as the spacers fill in the CRISPR and the phage strains randomize due to mutation. This result shows the diversity of the spacers increases as the diversity of phage increases. This result is also observed in a more complex microbial community experimentally [28].
It has often been assumed that when the CRISPR is “full” and spacers are to be deleted, the oldest spacer is deleted, or the oldest spacer is more likely to be deleted. Not all mechanisms for spacer deletion are capable of such a biased removal [29]. An equal deletion probability for all spacers is a simpler and perhaps more biologically motivated assumption. We have shown that such a uniform deletion probability does give a spacer diversity which decreases with distance from leader sequence, in accord with observation. A uniform deletion rate may be a simple, yet representative model for spacer deletion.
We have quantified the impact of mutation and recombination on phage escape from CRISPR recognition. Mutation and recombination both allow phage to escape. So far, most theories have assumed that phages evolve only by point mutation. Here we have examined the effects of recombination on the coevolution process, complimenting previous theoretical studies [30–35]. Data suggest that recombination is a significant driver of evolution [23]. To quantify the effectiveness of mutation versus recombination in phage escape, we defined a new quantity, “immunity,” the rate at which bacteria kill phages. This immunity is a good measure of the effectiveness of phage escape. By computing immunity, we quantified and compared the relative efficiencies of mutation and recombination for phage escape. There may be selective constraints on what mutations can occur in the viral protospacer. Consequently, phage need to find “viable” mutations. Recombination in the phages can combine beneficial or viable mutations. Furthermore, one mutation may not necessarily be enough to escape the host CRISPR immunity system, and it is possible that greater than one mutations is needed in order for a phage to escape. For both of these reasons, recombination allows phage to escape CRISPR recognition more effectively than does mutation alone.
Differing immune pressures become distinguishable in the diversity measurements at long times. At short times, the diversity results for l = 1 in Figure 7 and for l = 2 in Figure 10 are similar. The results differ at longer times, t ≥ 1200, in these two figures.
Interestingly, the leader-proximal spacers are less diverse in Fig. 10 for l = 2 than they are for l = 1. A lower diversity of these spacers is also observed for smaller mutation or recombination rates. When the phage is less able to escape the CRISPR, the diversity of the phage population decreases at long times. For this reason, the diversity of the spacers incorporated at later times, i.e. the leader-proximal spacers, is lower than that of spacers incorporated earlier, i.e. the spacers a bit farther from the leader.
If the bacteria are killed less by the phage, for example by having a more effective immune system, they are able to add a greater number of spacers and to fill up their CRISPR array more quickly. As the spacers fill in the leader-distal CRISPR positions, the diversity rises above the initial value of zero. It is for this reason that leader-distal diversity as a function of position for smaller mutation rate, smaller recombination rate, or larger l are above those for higher mutation rate, higher recombination rate, or smaller l. The interplay between the decrease of phage population diversity at long times and the filling in of the CRISPR array leads to the non-monotonic diversity of spacers with position in Fig. 10. The protection as a function of position can also be non-monotonic, as is Fig. 12, due to a decreasing diversity of phage with time and the diversity of leader-distal spacers being greater than that of intermediate spacers.
Figure 12.
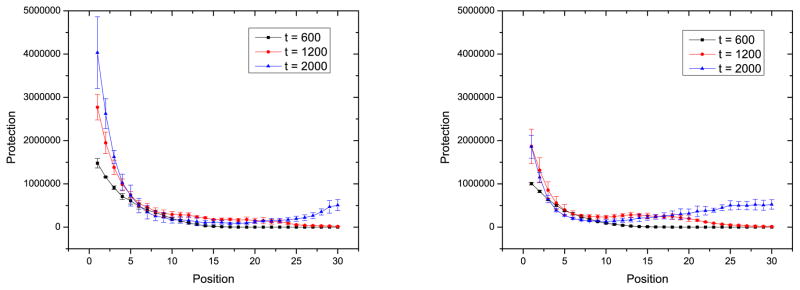
Protection at different positions of CRISPR at different times for l = 2 with a) mutation only and b) recombination only. The parameters are as in Fig. 10.
Protection of CRISPR is a better measure to differentiate the two CRISPR-evading strategies of mutation or recombination. From the figures of protection versus position, we can see that when l = 2, the protection of CRISPR is lower when the phage recombine, Fig. 12b, than mutate, Fig. 12a. That is, recombination allows the phage to escape the CRISPR system more easily. This result illustrates that recombination is a more efficient CRISPR evading strategy for phage.
5 Conclusion
The CRISPR/Cas system plays a crucial role in bacteria and phage coevolution. By adding and deleting spacers, bacteria are evolving dynamically under the selection pressure imposed by phage undergoing point mutation and recombination. The stochastic model used in this work captures the essential features of the CRISPR/Cas system, giving rise to the fascinating characteristics coexisting bacteria and phage system. The rich variety of spacers within the CRISPR locus captures the history of bacteria and phage coevolution.
As the “ancient” winner with better fitness, the leader distal spacers are more homogeneous than the leader proximal spacers. This result has previously been observed under a wide range of model parameters [24]. Bacteria with more effective immune systems, or bacteria attacked by phage that mutate more slowly, have higher fitness and are able to more quickly fill their CRISPR array with spacers. This result is rather intuitive and expected to hold under rather general conditions [30–34].
Spacer diversity is not particularly sensitive to whether the phage evolve by mutation or recombination. This result may be a bit surprising. It is understood to be a result of recombination between two random phage strains almost always leading to a new phage strain, and, therefore, identical in effect to mutation.
Different mechanisms of spacer deletion subtly affect the distribution of spacers in CRISPR. Random deletion of spacers [7,9] leads to a modestly slower rate of filling in the CRISPR array than does a mechanism of deleting only the leader-distal spacer. This result is because random deletion removes non-terminal spacers, which inhibits growth.
The protection or immunity that CRISPR confers upon bacteria is sensitive to the effectiveness of CRISPR-phage recognition, distinguishing between whether l = 1 and l = 2 mismatches are required for phage to escape recognition. Protection and immunity are also sensitive to the mechanism of phage escape, easily distinguishing different rates of phage evolution. Recombination is seen [23] to be more effective in allowing phage to escape CRISPR recognition when greater numbers of mutations are required for escape, l = 2. This result is simply because recombination is most often with a quite different strain, and so the produced recombinant has more contained variation than mutation would provide. It is likely that phage recombination is a significant generator of phage diversity in the wild.
A Table of parameters
| Parameter | Meaning |
|---|---|
| xi,j | The population of bacteria containing spacers i and j |
| xmax | The maximum bacteria population |
| vk | The phage population containing protospacer k |
| vmax | The maximum phage population |
| c | The bacteria growth rate |
| r | The phage growth rate |
| β | The bacteria exposure rate |
| γ | The probability of acquiring a new spacer |
| μ | The mutation rate |
| ν | The recombination rate |
Acknowledgments
This research was partially supported by the US National Institutes of Health under grant number 1 R01 GM 100468–01.
References
- 1.Ishino Y, Shinagawa H, Marino K, Amemura M, Nakata A. Nucleotide sequence of the iap gene, responsible for alkaline phosphatase isozyme conversion in Escherichia coli, and identification of the gene product. J Bacteriol. 1987;169:5429–5433. doi: 10.1128/jb.169.12.5429-5433.1987. [DOI] [PMC free article] [PubMed] [Google Scholar]
- 2.Grissa I, Vergnaud G, Pourcel C. CRISPRFinder: A web tool to identify clistered regularly interspaced short palindromic repeats. Nucleic Acids Research. 2007;35:W52–W57. doi: 10.1093/nar/gkm360. [DOI] [PMC free article] [PubMed] [Google Scholar]
- 3.Horvath P, Barrangou R. CRISPR/Cas, the immune system of bacteria and archaea. Science. 2010;327:167. doi: 10.1126/science.1179555. [DOI] [PubMed] [Google Scholar]
- 4.Sorek R, Victor K, Hugenholtz P. CRISPR a widespread system that provides acquired resistance against phages in bacteria and archaea. Nat Rev Micro. 2008;6:181–186. doi: 10.1038/nrmicro1793. [DOI] [PubMed] [Google Scholar]
- 5.Oost J, Jore MM, Westra ER, Lundgren M, Brouns SJJ. CRISPR-based adaptive and heritable immunity in prokaryotes. Trends in Biochemical Sciences. 2009;34:401– 407. doi: 10.1016/j.tibs.2009.05.002. [DOI] [PubMed] [Google Scholar]
- 6.Jansen R, van Embden JDA, Gaastra W, Schouls LM. Identification of genes that are associated with DNA repeats in prokaryotes. Molecular Microbiology. 2002;43:1565–1575. doi: 10.1046/j.1365-2958.2002.02839.x. [DOI] [PubMed] [Google Scholar]
- 7.Horvath P, Romero DA, Monvoisin A, Richards M, Deveau H, Moineau S, Boyaval P, Fremaux C, Barrangou R. Diversity, activity, and evolution of CRISPR loci in Streptococcus thermophilus. J Bacteriol. 2008;90:1401–1412. doi: 10.1128/JB.01415-07. [DOI] [PMC free article] [PubMed] [Google Scholar]
- 8.Barrangou R, Fremaux C, Deveau H, Richards M, Boyaval P, Moineau S, Romero DA, Horvath P. CRISPR provides acquired resistance against viruses in prokaryotes. Science. 2007;315:1709–1712. doi: 10.1126/science.1138140. [DOI] [PubMed] [Google Scholar]
- 9.Deveau H, Barrangou R, Garneau JE, Labonté J, Fremaux C, Boyaval P, Romero DA, Horvath P, Moineau S. Phage response to CRISPR-Encoded resistance in Streptococcus thermophilus. J Bacteriol. 2008;190:1390–1400. doi: 10.1128/JB.01412-07. [DOI] [PMC free article] [PubMed] [Google Scholar]
- 10.Sturino J, Klaenhammer T. Engineered bacteriophage-defence systems in bio-processing. Nat Rev Micro. 2006;4:395–404. doi: 10.1038/nrmicro1393. [DOI] [PubMed] [Google Scholar]
- 11.Brüssow H. Phages of dairy bacteria. Annu Rev Microbiol. 2001;55:283–303. doi: 10.1146/annurev.micro.55.1.283. [DOI] [PubMed] [Google Scholar]
- 12.Desiere F, Lucchini S, Canchaya C, Ventura M, Brüssow H. Comparative genomics of phages and prophages in lactic acid bacteria. Antonie van Leeuwenhoek. 2002;82:73–91. [PubMed] [Google Scholar]
- 13.Horvath P, Monvoisin A, Romero DA, Boyaval P, Fremaux C, Barrangou R. Comparative analysis of CRISPR loci in lactic acid bacteria genomes. International Journal of Food Microbiology. 2009;131:62– 70. doi: 10.1016/j.ijfoodmicro.2008.05.030. [DOI] [PubMed] [Google Scholar]
- 14.Brouns SJJ, Jore MM, Lundgren M, Westra ER, Slijkhuis RJH, Snijders APL, Dickman MJ, Makarova KS, Koonin EV, van der Oost J. Small CRISPR RNAs guide antiviral defense in Prokaryotes. Science. 2008;321:960–964. doi: 10.1126/science.1159689. [DOI] [PMC free article] [PubMed] [Google Scholar]
- 15.Jore M, Lundgren M, van Duijn E, Bultema J, Westra ER, Waghmare SP, Wiedenheft B, Pul U, Wurm R, Wagner R, Beijer MR, Barendregt A, Zhou K, Snijders A, Dickman MJ, Doudna JA, Boekema EJ, Heck AJ, van der Oost J, Brouns SJ. Structural basis for CRISPR RNA-guided DNA recognition by Cascade. Nat Struct Mol Biol. 2011;18:529–536. doi: 10.1038/nsmb.2019. [DOI] [PubMed] [Google Scholar]
- 16.Garneau JE, Dupuis M, Villion M, Romero DA, Barrangou R, Boyaval P, Fremaux C, Horvath P, Magadań AH, Moineau S. The CRISPR/Cas bacterial immune system cleaves bacteriophage and plasmid DNA. Nature. 2007;468:67–71. doi: 10.1038/nature09523. [DOI] [PubMed] [Google Scholar]
- 17.Shah SA, Hansen NR, Garrett RA. Distribution of CRISPR spacer matches in viruses and plasmids of crenarchaeal acidothermophiles and implications for their inhibitory mechanism. Biochemical Society Transactions. 2009;37:23–28. doi: 10.1042/BST0370023. [DOI] [PubMed] [Google Scholar]
- 18.Marraffini LA, Sontheimer EJ. CRISPR interference limits horizontal gene transfer in Staphylococci by targeting DNA. Science. 2008;322:1843–1845. doi: 10.1126/science.1165771. [DOI] [PMC free article] [PubMed] [Google Scholar]
- 19.Marraffini LA, Sontheimer EJ. CRISPR interference: RNA-directed adaptive immunity in bacteria and archaea. Nat Rev Genet. 2010;11:181–190. doi: 10.1038/nrg2749. [DOI] [PMC free article] [PubMed] [Google Scholar]
- 20.Hale CR, Zhao P, Olson S, Duff MO, Graveley BR, Wells L, Terns RM, Terns MP. RNA-guided RNA cleavage by a CRISPR RNA-Cas protein complex. Cell. 2009;139:945–956. doi: 10.1016/j.cell.2009.07.040. [DOI] [PMC free article] [PubMed] [Google Scholar]
- 21.Deveau H, Garneau JE, Moineau S. CRISPR/Cas system and its role in phage-bacteria interactions. Annu Rev Microbiol. 2010;64:475–493. doi: 10.1146/annurev.micro.112408.134123. [DOI] [PubMed] [Google Scholar]
- 22.Gudbergsdottir S, Deng L, Chen Z, Jensen JVK, Jensen LR, She Q, Garrett RA. Dynamic properties of the Sulfolobus CRISPR/Cas and CRISPR/Cmr systems when challenged with vector-borne viral and plasmid genes and protospacers. Mol Microbiol. 2011;79:35–49. doi: 10.1111/j.1365-2958.2010.07452.x. [DOI] [PMC free article] [PubMed] [Google Scholar]
- 23.Andersson AF, Banfield JF. Virus population dynamics and acquired virus resistance in natural microbial communities. Science. 2008;320:1047–1050. doi: 10.1126/science.1157358. [DOI] [PubMed] [Google Scholar]
- 24.He J, Deem MW. Heterogeneous diversity of spacers within CRISPR (clustered regularly interspaced short palindromic repeats) Physical Review Letters. 2010;105:128102. doi: 10.1103/PhysRevLett.105.128102. [DOI] [PubMed] [Google Scholar]
- 25.Tyson GW, Banfield JF. Rapidly evolving CRISPRs implicated in acquired resistance of microorganisms to viruses. Environmental Microbiology. 2008;10:200–207. doi: 10.1111/j.1462-2920.2007.01444.x. [DOI] [PubMed] [Google Scholar]
- 26.Gillespie DT. Exact stochastic simulation of coupled chemical reactions. The Journal of Physical Chemistry. 1977;81:2340–2361. [Google Scholar]
- 27.Held NL, Herrera A, Cadillo-Quiroz H, Whitaker RJ. CRISPR associated diversity within a population of Sulfolobus islandicus. PLoS ONE. 2010;5:e12988. doi: 10.1371/journal.pone.0012988. [DOI] [PMC free article] [PubMed] [Google Scholar]
- 28.Heidelberg JF, Nelson WC, Schoenfeld T, Bhays D. Germ warfare in a microbial mat community: CRISPRs provide insighs into the co-evolutoin of host and viral genomes. PLoS ONE. 2009;4:e4169. doi: 10.1371/journal.pone.0004169. [DOI] [PMC free article] [PubMed] [Google Scholar]
- 29.Bhaya D, Davison M, Barrangou R. CRISPR-Cas system in bacteria and archaea: Versatile small RNAs for adaptive defense and regulation. Annu Rev Genet. 2011;45:273–297. doi: 10.1146/annurev-genet-110410-132430. [DOI] [PubMed] [Google Scholar]
- 30.Childs LM, Held NL, Young Mark J, Whitaker RJ, Weitz JS. Multiscale model of CRISPR-induced coevolutoinary dynamics: Diversification at the interface of Lamarck and Darwin. Evolution. 2012:2015–2029. doi: 10.1111/j.1558-5646.2012.01595.x. [DOI] [PMC free article] [PubMed] [Google Scholar]
- 31.Haerter JO, Trusina A, Sneppen K. Targeted bacterial immunity buffers phage diversity. J Virol. 2011;85:10554. doi: 10.1128/JVI.05222-11. [DOI] [PMC free article] [PubMed] [Google Scholar]
- 32.Haerter JO, Sneppen K. Spatial structure and Lamarchian adaptatioin explain extreme gentic diversity at CRISPR locus. mBio. 2012;3:e00126–12. doi: 10.1128/mBio.00126-12. [DOI] [PMC free article] [PubMed] [Google Scholar]
- 33.Heilmann S, Sneppen K, Krishna S. Coexistence of phage and bacteria on the boundary of self-organized refuges. PNAS. 2012;109:12828–12833. doi: 10.1073/pnas.1200771109. [DOI] [PMC free article] [PubMed] [Google Scholar]
- 34.Weinberger AD, Sun CL, Pluciński MM, Denef VJ, Thomas BC, Horvath P, Barrangou R, Gilmor MS, Getz WM, Banfield JF. Persisting viral sequences shape microbial CRISPR-based immunity. PLoS Comput Biol. 2012;8:e1002475. doi: 10.1371/journal.pcbi.1002475. [DOI] [PMC free article] [PubMed] [Google Scholar]
- 35.Levin BR. Nasty viruses, and costly plasmids, population dynamics, and the conditioins for establishing and maintaining CRISPR-mediated adaptive immuity in bacteria. PLoS Genetic. 2010;6:e1001171. doi: 10.1371/journal.pgen.1001171. [DOI] [PMC free article] [PubMed] [Google Scholar]