Abstract
Molecular dynamics simulations of the A2A adenosine receptor totaling 1.4 μsec show clear evidence for specific sites mediating interactions between adenosinebound A2A and cholesterol. The strongest evidence is for three binding sites. Two are in the extracellular leaflet, with one site interacting with helices VII and I, and the other with helices II and III. One site is located in the intracellular leaflet, interacting with helices III and IV. One of our three predicted binding sites is confirmed by a just-published high resolution structure of A2A cocrystallized with an antagonist.
As our understanding of the complexity of the cell membrane grows, so too does the recognition that the membrane plays an active role in regulating integral membrane proteins (IMPs).1 Cholesterol—present in fractions of up to 30 mol % in mammalian cell membranes—is a central figure in the regulation of IMPs. Cholesterol modulates the miscibility of membrane components2 and the material properties of bilayers. 3 There is also crystallographic evidence in several cases for specific interactions between cholesterol and IMPs.4-8 Generally, identification of such interactions is very challenging, but is essential in order to link such interactions with their biochemical consequences.
The G-protein-coupled receptors (GPCR) are IMPs, and are the largest superfamily of proteins in the human genome, including roughly 800 members that transduce signals in every imaginable physiological context. GPCRs represent roughly half of all drug targets.9,10 As integral membrane proteins, GPCR function is sensitive to the local environment of proteins and lipids. Cholesterol in particular is an indispensable component of cell membranes,11 and is known to play an important role in GPCR structure and function.12-16 Direct interactions between cholesterol and GPCRs have been observed by X-ray crystallography of the β2-adrenergic receptor (β2AR)5,6 and A2A,8 and by electron microscopy4 and molecular dynamics simulation of rhodopsin.17 Specific sequences of amino acids that thought to mediate cholesterol interaction have also been identified.6,18
Functional consequences dependent on cholesterol have also been reported. Bulk cholesterol has been shown to improve the stability of β2AR6,19 and to mediate receptorreceptor interaction as a necessary component for crystallization. 5 Ligand binding has been shown to be cholesterol dependent in intact cells for the oxytocin and cholecystokinin receptors.20 Several recently published reports have focused on A2A-Cholesterol interactions. Based on the β2AR crystal structure,6 Lyman, et al. proposed that specific binding in the cleft between helices I and III stabilizes helix II in the apo state.21 Nearly simultaneously, functional studies on micellesolubilized A2A showed that a precise titration of sterol derivatives is essential in order to recover native-like ligand binding. 12,13 Several publications have reported X-ray crystal structures of A2A with8 and without cholesterol,22-26 providing a unique opportunity to test the predictive validity of molecular dynamics in the context of GPCR-lipid interactions.
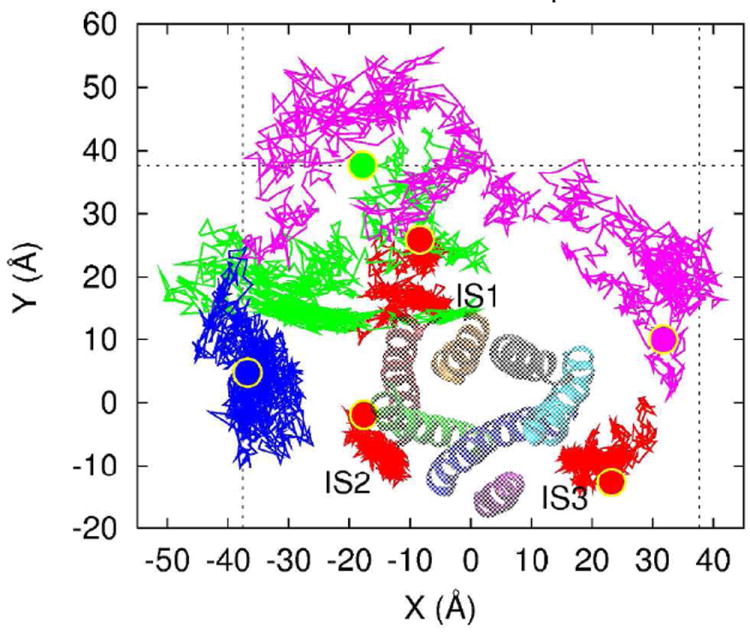
We present blind predictions of preferred cholesterol interaction sites on A2A by molecular dynamics simulations, one of which coincides with an interaction site identified by a very recently published X-ray structure.8 The protein was simulated in a palmitoyloleyol phosphatidylcholine (POPC) bilayer with 30 mol % cholesterol, with the initial positions of the cholesterols chosen at random. The cholesterols, by virtue of their diffusive wandering, identify the interaction sites, in an unbiased and blind way. We report three specific interactions (shown in Figure 1) that are identified in both independent, 800 nsec trajectories. The data indicate that even cholesterols in well-defined interaction sites are quite mobile when associated with the protein, for this reason we use the terminology “interaction site” rather than binding site.
Figure 1. Trajectories of representative cholesterols projected onto the membrane plane.

The trajectories connect the center of mass positions of six cholesterols in each simulation snapshot. The trajectories of 3 cholesterols at IS1, IS2, and IS3 (as marked) are shown in red. The trajectories of 3 other cholesterols are shown in green, blue, and magenta. In each trajectory, the initial position is shown in large ball with the same color as the trajectory. A2A is also shown, viewed from the extracellular side, with H1 (red), H2 (green), H3 (blue), H4 (purple), H5 (cyan), H6 (gray), and H7 (orange).
We simulated the adenosine bound structure (PDB code 2YDO),24 with four thermostabilizing mutations replaced by the native sequence, and residues not resolved in the crystal structure built as described in a recent publication.27 The POPC+30 mol % Chol membrane was generated with the CharmmGUI.28 The simulation protocol is identical to our recently published work,27 simulations were performed with Desmond v. 3011029 under conditions of semi-isotropic constant pressure and constant temperature by the Martynya-Tobias-Klein method.30 Two independent trajectories of 800 nsec of each were obtained, requiring roughly 50 days of computation on 150 cores of our local cluster.
Figure 1 shows the trajectories of six cholesterols (out of a total of 110) over the course of the two independent simulations. Three cholesterols that interact most strongly are shown in red, the others are selected to represent the range of observed cholesterol mean squared displacements (MSD). Two of the selected cholesterols form no contacts with A2A for entire simulation time. A range of MSDs are observed for such noninteracting cholesterols, from relatively compact trajectories (blue) to wide-ranging (magenta). Transient interactions are also observed—the cholesterol shown in green makes contact with A2A for some time, but on the basis of the MSD we conclude that it does not form a specific interaction. (Taken in total, the trajectories of all cholesterols over both trajectories provide exhaustive sampling of the membranefacing surface of the receptor, as shown in Supplemental Figure 1.) On the other hand, three traces (shown in red) both have very compact trajectories and interact with the protein. These two criteria are our basis for the identification of specific interaction sites.
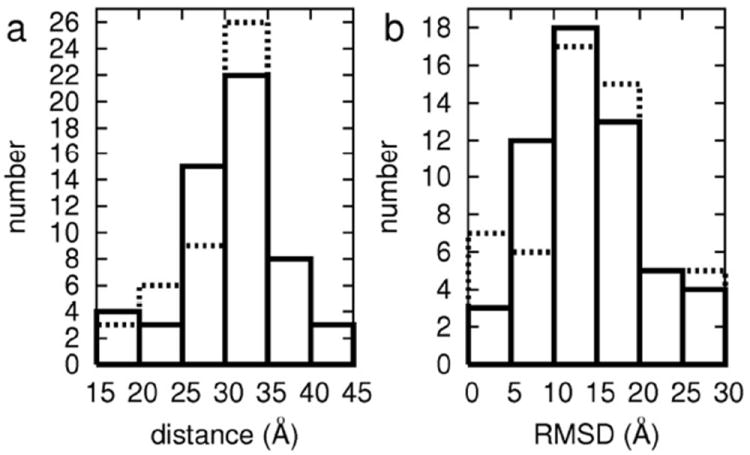
Figure 2 presents histograms of the averaged in-plane distances and RMSD of the positions for all cholesterols from A2A. Cholesterols with both small distances and small RMSDs form contacts with A2A and those contacts remain stable for the duration of the simulation. In the first trajectory (solid line in Figure 2), there are seven cholesterols in the distance range of 15 to 25 Å (distance measured from the center of mass of A2A); of those seven, five have RMSDs range of 0 to 10 Å. In the second trajectory (dashed line in Figure 2), seven of the nine cholesterols with average distances of 15 to 25 Å also have RMSDs between 0 and 5 Å. In other words, we find five and seven cholesterols that have both small RMSD and interaction with the protein in the first and second trajectories, respectively. Among these, three interactions are with the same location on the protein. These reproducible, tight interactions we identify as cholesterol-A2A interaction sites.
Figure 2. Distribution of distance and RMSD.

Histograms of (a) the averaged distance of cholesterol center of mass from A2A and (b) the RMSD of the cholesterol centers of mass in the membrane plane. Solid (dashed) line corresponds to the first (second) trajectory.
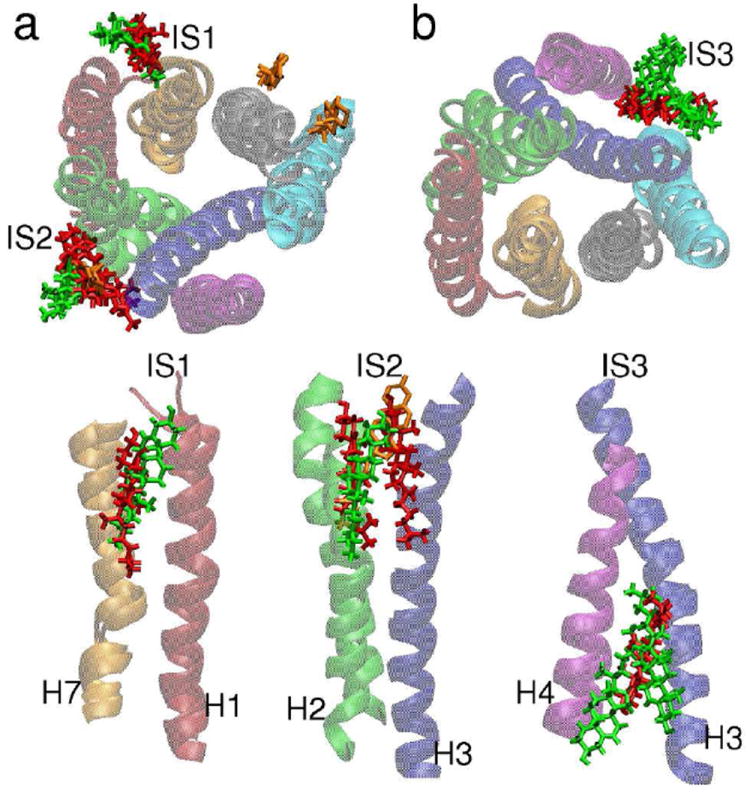
Figure 3 shows the interaction sites common to both the trajectories, labeled IS1, IS2, and IS3, as well as three cholesterols resolved in a very recently published high-resolution structure of A2A.8 IS1 is between H1 and H7 in the extracellular leaflet, exactly one cholesterol is found in each trajectory. IS2 is between H2 and H3, also in the extracellular leaflet, and coincides with the location of a cholesterol observed by X-ray crystallography.8 This site is occupied by two cholesterols in the first trajectory, and is occupied by a single cholesterol in the second trajectory. IS3 is between H3 and H4 in the intracellular leaflet. One cholesterol occupies this site in the first trajectory; two occupy it in the second trajectory. Our data also allow us to rank the interactions in terms of stability, by considering the RMSD and fraction of time each is in contact with the protein. The 2 cholesterols at IS1 have RMSDs of 4.5 and 5.5 Å, the 3 cholesterols at IS2 have RMSDs of 3.0, 4.5, and 5.4 Å, and the 3 cholesterols at IS3 have RMSDs of 2.4, 3.7, and 3.8 Å. (Below we compare the sites more quantitatively, on the basis of upconcentration relative to the average cholesterol concentration.) It is also straightforward to compute the fraction of time that each cholesterol interacts with the protein. [(time with at least one contact with A2A)/(whole simulation time)] Contact formation is defined by a distance between A2A and cholesterol of less than 4 Å. From this analysis, the 2 at IS1 are found to be in contact 70 and 79 % of the time, the 3 at IS2 have 72, 83, and 99 %, and the 3 at IS3 have 85, 96, and 100 %. The interaction sites with smaller RMSD values naturally have longer interaction times, indicating that IS3 is the most stable, while IS2 and IS1 have similar stabilities.
Figure 3. Predicted cholesterol interaction sites.

(a) Top view, cholesterols in the extracellular leaflet and (b) bottom view, cholesterols the intracellular leaflet. The images are structures at 250 nsec, when all the cholesterols form contacts with A2A. The coloring of the helices is the same as in Figure 1. The instantaneous cholesterol positions are shown by red (green) sticks for the first (second) trajectory. The cholesterols resolved in the recently published high resolution structure of Liu et al.8 are shown as orange sticks. Side views showing the positions of the cholesterols for each interaction site are shown in the bottom three panels.
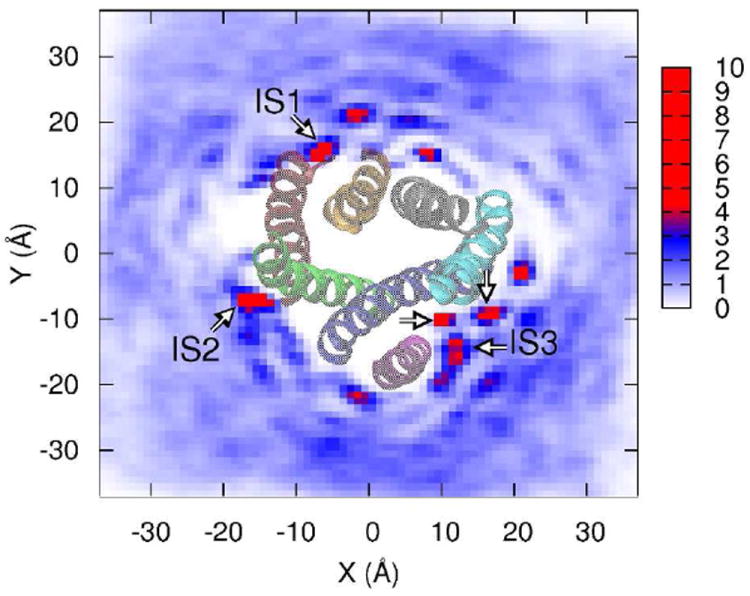
A different view of A2A-cholesterol interactions is obtained by mapping the density of cholesterol around the protein. As shown in Figure 4, there are clearly identifiable cholesterol “hotspots,” several of which coincide with IS1, IS2, and IS3. IS1 and IS2 both correspond to a single localized density of cholesterol. The site we identify as IS3 appears to instead consist of three distinct but very tightly grouped interaction sites. Nonetheless, on the basis of the stability of the IS3 interaction, we identify it as a single interaction site. Several other hotspots are clearly visible in Figure 4, but are not identified as interaction sites by our criteria. Some fail the reproducibility test, being present in only one trajectory. Others are not the result of a single cholesterol, but rather two or more cholesterols that transiently visit the same interaction site. These cases fail the test of a combined low average distance and low RMSD of Figure 2. We also considered the convergence of the observed cholesterol data, by computing the density map for nonoverlapping 100 nsec trajectory segments, shown in Supplemental Figure 2. Figure S2 demonstrates that the pattern of enhanced density at the interaction sites is fluctuating but stable by the second half of the trajectories, an indication that the simulations are sampling an equilibrium distribution of local cholesterol concentration.
Figure 4. Density map of cholesterols on the membrane plane.

The image is obtained by projecting the center of mass positions for all cholesterols onto the membrane midplane, and mapping the density by histogramming the center of mass positions on a fine mesh. The data are normalized by the value that would be obtained for a uniform distribution of cholesterols, corresponding to a value of 1 on the scale bar at right. Thus, at the extreme of the scale the density of cholesterol is ten times the density expected for a uniform, random distribution at 30 mol %. IS1, IS2, and IS3 are marked by arrows, A2A is shown from the extracellular side.
A simple analysis of the observed cholesterol density at the interaction sites provides a means to estimate the free energy of association at each site, relative to the averaged cholesterol concentration in the bulk:
Here, i labels the interaction site, R is the gas constant, T is the temperature in Kelvins, ρi is the density of cholesterol at interaction site i averaged over the last 400 nsec of the simulations, and ρ0 is the averaged bulk density of cholesterol. For the three sites we obtain (in units of RT) -1.4 (IS1), -1.2 (IS2), and -1.8 (IS3). These values are consistent with the RMSDs that typify each site, and with the observation that these are relatively weak and dynamic interactions.
Our data predict interactions between particular residues on A2A and cholesterol. Taking into consideration both trajectories, we examine interactions between the two cholesterols at IS1 and the three cholesterols at IS2 and IS3 which are shown in Figure 3. We calculated the fraction of time that individual residues make contact with cholesterol, averaged over both trajectories. (A value of 1.0 means a residue has contact all the time, i.e. for the full 1.4 μsec of trajectories 1 and 2.) The two cholesterols at IS1 form contacts with the residues Val-8, Tyr-9, and Val-12 on H1 and Leu-272 on H7, with values ranging from 0.3 to 0.4. For the three cholesterols at IS2, the residues Val-57, Leu-58, Pro-61, Phe-62, and Thr-65 on H2 form contacts with values of 0.5 to 0.6, the residue Phe-70 on the extracellular loop 1 has a value of 0.5, and the residues on H3 (Phe-79, Ile-80, Phe-83) all have values less than 0.3. For the three cholesterols at IS3, the residues Phe-93, Ile-100, and Ile-104 on H3 and Ile-124 on H4 have ratios 0.6 to 0.7, while another group consisting of Leu-96, Ala-97, Tyr-103, and Arg-107 on H3, Cys-128 and Leu-131 on H4, Leu-192 on H5, and Leu-115 on intracellular loop 2 have values from 0.3 to 0.4. As the most stable interaction site as discussed earlier, IS3 forms many contacts that are formed for a significant fraction of the observation time.
To consider whether the observed sites are specific to cholesterol, we compared “fingerprints” of the cholesterol interactions reported here to interactions with oleoyl and palmitoyl chains in two control simulations totaling more than 2 μsec at low (1 mol %) cholesterol concentration. No reproducible, specific interactions are observed between either lipid chain and the protein at IS1 or IS3. A reproducible interaction between a lipid and the protein that is similar to IS2 is observed in the control simulations. (See Figure S3) While that interaction is rather weak in the first of the two control trajectories, it is nonetheless possible that IS2 may promiscuously bind different components of the lipid matrix depending on the local membrane composition.
Overall, our data indicate that cholesterol interacts with specific locations on the membrane-facing surface of A2A, but that interaction of even the most localized cholesterols is dynamic. The cholesterols do not adopt a rigidly defined orientation and position with respect to the protein, but there is rather some heterogeneity in their interaction with the protein. It is noteworthy that none of our strongest predictions correspond to the hypothesized interaction site between H1 and H3 in the intracellular leaflet, observed in an X-ray crystal structure6 of β2AR, expanded on the basis of evolutionary analysis,31 and studied by molecular dynamics in the context of A2A.21 That interaction site is visited by several cholesterols in our simulations, but they do not linger, having RMSDs of 13 Å and above.
In summary, we observe reproducible, localized interaction sites between A2A and cholesterol by long timescale molecular dynamics simulations. One of our interaction sites is confirmed by a recently published, high-resolution crystal structure of A2A,8 two others beg for experimental confirmation. However, we do not observe significant cholesterol density at a different site, also identified in the recent crystal structure, a contradiction that will be the subject of further investigation. Though a growing body of work demonstrates that GPCR function is modulated by the membrane microenvironment, direct observations of GPCR cholesterol interactions are few. Identification of specifically interacting sites is essential in order to understand the thermodynamic forces that drive such associations and to rationalize their functional mechanism. Our data and previous work17 demonstrate that molecular dynamics offers a straightforward way to identify specific lipid-protein interactions for GPCRs. Together with bioinformatic analysis,31 MD offers a way to narrow the experimental focus to key areas on integral membrane proteins. Continued characterization of such interactions by experiment and simulation will deepen our understanding of the interplay of GPCRs and the lipid matrix. If our predictions are validated by further experimental work, molecular dynamics offers a valuable approach to studying specific lipid-GPCR interactions.
Supplementary Material
Acknowledgments
The authors thank Anne Robinson and the members of her lab for their thoughts and discussions. This work was supported by grants from the National Center for Research Resources (5P30RR031160-03) and the National Institute of General Medical Sciences (8 P30 GM103519-03) from the National Institutes of Health. This work used the Extreme Science and Engineering Discovery Environment (XSEDE), which is supported by National Science Foundation grant number OCI-1053575.
Footnotes
The authors declare no competing financial interests.
References
- 1.van Meer G, Voelker DR, Feigenson GW. Nature Rev Mol Cell Biol. 2008;9:112–124. doi: 10.1038/nrm2330. [DOI] [PMC free article] [PubMed] [Google Scholar]
- 2.Lingwood D, Simons K. Science. 2010;327:46–50. doi: 10.1126/science.1174621. [DOI] [PubMed] [Google Scholar]
- 3.Pan J, Mills T, Tristram-Nagle S, Nagle J. Phys Rev Lett. 2008;100:198103. doi: 10.1103/PhysRevLett.100.198103. [DOI] [PMC free article] [PubMed] [Google Scholar]
- 4.Ruprecht JJ, Mielke T, Vogel R, Villa C, Schertler GFX. EMBO J. 2004;23:3609–3620. doi: 10.1038/sj.emboj.7600374. [DOI] [PMC free article] [PubMed] [Google Scholar]
- 5.Cherezov V, Rosenbaum DM, Hanson MA, Rasmussen SGF, Thian FS, Kobilka TS, Choi H-J, Kuhn P, Weis WI, Kobilka BK, Stevens RC. Science. 2007;318:1258–1265. doi: 10.1126/science.1150577. [DOI] [PMC free article] [PubMed] [Google Scholar]
- 6.Hanson MA, Cherezov V, Griffith MT, Roth CB, Jaakola V-P, Chien EYT, Velasquez J, Kuhn P, Stevens RC. Structure. 2008;16:897–905. doi: 10.1016/j.str.2008.05.001. [DOI] [PMC free article] [PubMed] [Google Scholar]
- 7.Shinoda T, Ogawa H, Cornelius F, Toyoshima C. Nature. 2009;459:446–450. doi: 10.1038/nature07939. [DOI] [PubMed] [Google Scholar]
- 8.Liu W, Chun E, Thompson AA, Chubukov P, Xu F, Katritch V, Han GW, Roth CB, Heitman LH, IJzerman AP, Cherezov V, Stevens RC. Science. 2012;337:232–236. doi: 10.1126/science.1219218. [DOI] [PMC free article] [PubMed] [Google Scholar]
- 9.Gilchrist A. GPCR molecular pharmacology and drug targeting. John Wiley & Sons; Hoboken, NJ: 2010. [Google Scholar]
- 10.Fredholm BB, Ijzerman AP, Jacobson KA, Linden J, Mu CE. Pharmacol Rev. 2011;63:1–34. doi: 10.1124/pr.110.003285. [DOI] [PMC free article] [PubMed] [Google Scholar]
- 11.Simons K. Science. 2000;290:1721–1726. doi: 10.1126/science.290.5497.1721. [DOI] [PubMed] [Google Scholar]
- 12.O’Malley MA, Helgeson ME, Wagner NJ, Robinson AS. Biophys J. 2011;101:1938–1948. doi: 10.1016/j.bpj.2011.09.018. [DOI] [PMC free article] [PubMed] [Google Scholar]
- 13.O’Malley MA, Helgeson ME, Wagner NJ, Robinson AS. Biophys J. 2011;100:L11–13. doi: 10.1016/j.bpj.2010.12.3698. [DOI] [PMC free article] [PubMed] [Google Scholar]
- 14.Chini B, Parenti M. J Mol Endocrinol. 2009;42:371–379. doi: 10.1677/JME-08-0114. [DOI] [PubMed] [Google Scholar]
- 15.Pucadyil TJ, Chattopadhyay A. Prog Lipid Res. 2006;45:295–333. doi: 10.1016/j.plipres.2006.02.002. [DOI] [PubMed] [Google Scholar]
- 16.Paila YD, Tiwari S, Chattopadhyay A. Biochim Biophys Acta. 2009;1788:295–302. doi: 10.1016/j.bbamem.2008.11.020. [DOI] [PubMed] [Google Scholar]
- 17.Khelashvili G, Grossfield A, Feller SE, Pitman MC, Weinstein H. Proteins. 2009;76:403–417. doi: 10.1002/prot.22355. [DOI] [PMC free article] [PubMed] [Google Scholar]
- 18.Jafurulla M, Tiwari S, Chattopadhyay A. Biochem Biophys Res Commun. 2011;404:569–573. doi: 10.1016/j.bbrc.2010.12.031. [DOI] [PubMed] [Google Scholar]
- 19.Yao Z, Kobilka B. Anal Biochem. 2005;343:344–346. doi: 10.1016/j.ab.2005.05.002. [DOI] [PubMed] [Google Scholar]
- 20.Gimpl G, Burger K, Fahrenholz F. Biochemistry. 1997;36:10959–10974. doi: 10.1021/bi963138w. [DOI] [PubMed] [Google Scholar]
- 21.Lyman E, Higgs C, Kim B, Lupyan D, Shelley JC, Farid R, Voth GA. Structure. 2009;17:1660–1668. doi: 10.1016/j.str.2009.10.010. [DOI] [PMC free article] [PubMed] [Google Scholar]
- 22.Doré AS, Robertson N, Errey JC, Ng I, Hollenstein K, Tehan B, Hurrell E, Bennett K, Congreve M, Magnani F, Tate CG, Weir M, Marshall FH. Structure. 2011;19:1283–1293. doi: 10.1016/j.str.2011.06.014. [DOI] [PMC free article] [PubMed] [Google Scholar]
- 23.Xu F, Wu H, Katritch V, Han GW, Jacobson KA, Gao Z-G, Cherezov V, Stevens RC. Science. 2011;332:322–327. doi: 10.1126/science.1202793. [DOI] [PMC free article] [PubMed] [Google Scholar]
- 24.Lebon G, Warne T, Edwards PC, Bennett K, Langmead CJ, Leslie AGW, Tate CG. Nature. 2011;474:521–525. doi: 10.1038/nature10136. [DOI] [PMC free article] [PubMed] [Google Scholar]
- 25.Hino T, Arakawa T, Iwanari H, Yurugi-Kobayashi T, Ikeda-Suno C, Nakada-Nakura Y, Kusano-Arai O, Weyand S, Shimamura T, Nomura N, Cameron AD, Kobayashi T, Hamakubo T, Iwata S, Murata T. Nature. 2012;482:237–240. doi: 10.1038/nature10750. [DOI] [PMC free article] [PubMed] [Google Scholar]
- 26.Jaakola V-P, Griffith MT, Hanson MA, Cherezov V, Chien EYT, Lane JR, Ijzerman AP, Stevens RC. Science. 2008;322:1211–1217. doi: 10.1126/science.1164772. [DOI] [PMC free article] [PubMed] [Google Scholar]
- 27.Lee JY, Lyman E. Biophys J. 2012;102:2114–2120. doi: 10.1016/j.bpj.2012.03.061. [DOI] [PMC free article] [PubMed] [Google Scholar]
- 28.Jo S, Kim T, Iyer VG, Im W. J Comput Chem. 2008;29:1859–1865. doi: 10.1002/jcc.20945. [DOI] [PubMed] [Google Scholar]
- 29.Bowers KJ, Chow E, Xu H, Dror RO, Eastwood MP, Gregersen BA, Klepeis JL, Kolossvary I, Moraes MA, Sacerdoti FD, Salmon JK, Shan Y, Shaw DE. ACM/IEEE conference on Supercomputing; New York: ACM press; 2006. [Google Scholar]
- 30.Martyna GJ, Tobias DJ, Klein ML. J Chem Phys. 1994;101:4177–4189. [Google Scholar]
- 31.Adamian L, Naveed H, Liang J. Biochim Biophys Acta. 2011;1808:1092–1102. doi: 10.1016/j.bbamem.2010.12.008. [DOI] [PMC free article] [PubMed] [Google Scholar]
Associated Data
This section collects any data citations, data availability statements, or supplementary materials included in this article.


