

Abstract
Evidence supports a role for epigenetic mechanisms in the pathogenesis of late-onset Alzheimer’s disease (LOAD), but little has been done on a genome-wide scale to identify potential sites involved in disease. This study investigates human postmortem frontal cortex genome-wide DNA methylation profiles between 12 LOAD and 12 cognitively normal age- and gender-matched subjects. Quantitative DNA methylation is determined at 27,578 CpG sites spanning 14,475 genes via the Illumina Infinium HumanMethylation27 BeadArray. Data are analyzed using parallel linear models adjusting for age and gender with empirical Bayes standard error methods. Gene-specific technical and functional validation is performed on an additional 13 matched pair samples, encompassing a wider age range. Analysis reveals 948 CpG sites representing 918 unique genes as potentially associated with LOAD disease status pending confirmation in additional study populations. Across these 948 sites the subtle mean methylation difference between cases and controls is 2.9%. The CpG site with a minimum false discovery rate located in the promoter of the gene Transmembrane Protein 59 (TMEM59) is 7.3% hypomethylated in cases. Methylation at this site is functionally associated with tissue RNA and protein levels of the TMEM59 gene product. The TMEM59 gene identified from our discovery approach was recently implicated in amyloid-β protein precursor post-translational processing, supporting a role for epigenetic change in LOAD pathology. This study demonstrates widespread, modest discordant DNA methylation in LOAD-diseased tissue independent from DNA methylation changes with age. Identification of epigenetic biomarkers of LOAD risk may allow for the development of novel diagnostic and therapeutic targets.
Keywords: DNA methylation, epigenetics, late onset Alzheimer’s disease, prefrontal cortex
INTRODUCTION
Dementia and Alzheimer’s disease
Worldwide changes in demography are leading to a rapid increase in the numbers of older adults at risk for dementia. Accordingly, the global prevalence of dementia is expected to quadruple from an estimated 35.6 million cases in 2010 to 115.4 million cases in 2050 [1]. The global financial burden of dementia in 2010 was $604 billion (US dollars) including direct medical bills, formal social care, and informal care provided by unpaid caregivers [1].
Alzheimer’s disease (AD), a progressive, fatal neurodegenerative disease, is the most prevalent form of dementia. Less than 2% of AD cases represent early-onset AD (EOAD) [2] defined by disease onset prior to age 60 and genetic mutations in amyloid-β protein precursor (AβPP), presenilin-1 (PSEN-1), or presenilin-2 (PSEN-2) genes [3, 4]. Mutations in these genes dysregulate the AβPP pathway and directly lead to amyloid-β (Aβ) plaque accumulation, a major pathological hallmark of AD.
The remaining vast majority of cases are sporadic, termed Late-Onset Alzheimer’s Disease (LOAD) because they manifest symptoms after age 60. Approximately 60% of LOAD cases carry at least one apolipoprotein ε4 allele (APOE-ε4), while the global population prevalence of the allele is only approximately 22% [5, 6]. Pooled data on LOAD from recent, collaborative, large genome-wide association studies (GWAS) reported the population attributable risk for APOE variants was between 19% and 35% [7]. GWAS also identified additional LOAD risk alleles (CLU,PICALM, BIN1, CR1, ABCA7, MS4A, EPHA1, CD33, CD2AP) that contribute added risk in population subsets [8–11]. These risk factor genotypes are neither necessary nor sufficient for LOAD development. Twin studies revealed incomplete concordance [12, 13] and variable age at onset [14] even among monozygotic pairs, highlighting the complex etiology of LOAD. These observations underscore the likely importance of non-genetic factors in LOAD etiology and spurred recent investigations of the epigenetics of AD.
Epigenetics and Alzheimer’s disease
Epigenetics is the study of heritable changes in gene expression that occur without changes to the underlying DNA sequence. Methylation [15] and hydroxymethylation [16] at the 5′ site on cytosines in cytosine-guanine (CpG) dinucleotides are important epigenetic modifications associated with gene expression in the human brain. Specific marks distinguish brain regions [17, 18] and epigenetic differences in human brain tissues have been associated with such neurological diseases as schizophrenia and bipolar disorder [19]. Epigenetics is also a mechanism by which environmental exposures can translate to human disease [20, 21].
In AD cases lacking highly penetrant genetic susceptibility, the etiology of amyloid dysregulation is not well understood. Altered epigenetic regulation of tau and amyloid processing genes has been observed across multiple brain regions and is a potential mechanism for disease [22–24]. Human postmortem case-control studies observed global hypomethylation in the entorhinal cortex of AD subjects [25] and in the temporal neocortex neuronal nuclei of an AD monozygotic twin relative to their cognitively normal twin [26]. Evidence for epigenetic involvement in AD pathogenesis spans human studies in various tissues, animal models, and cell culture, and was recently reviewed [27–29].
Significant transcriptome-wide gene expression differences have been observed between brain tissues of LOAD cases and controls [30, 31]. However, previous AD research on DNA methylation as a regulator of gene expression evaluated DNA methylation at 5′ promoter regions of a few candidate genes selected based on a priori hypotheses about AD molecular mechanisms. The current research provides a semi-unbiased, quantitative, genome-wide discovery of locations of DNA epigenetic differences in human frontal cortex brain tissue between LOAD cases and controls, which allows for identification of novel disease-associated genes. The gene identified in this study that best distinguished cases and controls was technically validated using an additional sensitive and quantitative method of DNA detection. This mark was also validated using a second population of samples. The functional significance of this DNA methylation mark was further confirmed by gene expression and protein quantification assays.
MATERIALS AND METHODS
Sample acquisition
The NIA funded Michigan Alzheimer’s Disease Center (MADC) (P50AG008671; PI: Sid Gilman) maintains a well-clinically characterized cohort of AD and cognitively normal control subjects, many of which agreed to participate in autopsy and donated to the MADC Brain Bank. Upon autopsy, each left hemisphere was fixed in 10% neutral formalin for neuropathological diagnosis. The right hemisphere was sectioned coronally, flash frozen, and archived in MADC freezers at −80°C. Frozen tissue blocks 0.5 cm3 (50–90 mg) in size were dissected at −20°C from the mid-frontal gyrus of the frontal lobe and provided for this study. MADC frozen tissues were previously used in high quality expression [32] and proteomic studies [33].
Twelve age- and gender-matched pairs of LOAD cases (clinical diagnosis and Braak score ≥4) and controls (clinically confirmed and Braak score ≤2) were used for the genome-wide discovery phase of the project and for gene-specific technical validation. An additional thirteen matched pairs were included in the population validation phase, which included gene-specific DNA methylation, gene expression, and protein quantification studies. The demographic characteristics of all 50 brains included in this study are described in Table 1. Postmortem intervals (PMI) in hours for AD cases used in the Discovery Set were as follows: 3, 4, 7, 7, 7.75, 8, 8.75, 9, 11, 12, 14, 24. PMI in hours for controls used in the Discovery Set were as follows: 6, 6, 13.5, 14, 17, 18, 18, 18, 19.3, 20.5, 21.25, 24.5. Gray matter for DNA methylation, expression, and protein analysis was excised from the tissue sample and used in this study and vascular lesions were avoided.
Table 1.
Study population mean demographics by case status. Range is provided in parentheses
| Characteristic | LOAD cases
|
Cognitively normal controls
|
||
|---|---|---|---|---|
| Discovery set (n = 12) | Full set (n = 25) | Discovery set (n = 12) | Full set (n = 25) | |
| Neuropathological diagnosis | High likelihood | High lkelihood | Control n = 11 | Control n = 24 |
| AD n = 11 | AD n = 21 | Other n = 1 | Other n = 1 | |
| Intermediate | Intermediate | |||
| Likelihood n = 1 | Likelihood n = 4 | |||
| Braak stage | 4.7 (2–6) | 4.8 (2–6) | 1.3 (1–2) | 1.5 (1–2) |
| Age | 79.6 (69–94) | 78.2 (61–94) | 79.9 (69–95) | 78.3 (61–95) |
| Gender | ||||
| Female | 6 | 9 | 6 | 9 |
| Male | 6 | 16 | 6 | 16 |
| Post mortem interval (h) | 9.6 (3–24) | 9.5 (3–27.5) | 16.3 (6–24.5) | 16.0 (5–28) |
| Years in storage | 10.75 (5–17) | 10.5 (3–18) | 13.2 (3–20) | 13.2 (2–21) |
| Race | Caucasian (n = 12) | Caucasian (n = 25) | Caucasian (n = 12) | Caucasian (n = 25) |
| Age of onset | 69.1 (59–78) | NA | NA | |
| MMSE | 11.7 (0–28) missing = 1 | 12.9 (0–30) missing = 2 | 26.8 (25–28) missing = 10 | 26 (24–28) missing = 16 |
| # Years from diagnosis to death | 5.1 (1–12) | 5.2 (1–12) | NA | NA |
| APOE Genotype | ||||
| 2/2 | 2 | 2 | 3 | 6 |
| 2/3 | 1 | 1 | 0 | 1 |
| 2/4 | 0 | 1 | 0 | 0 |
| 3/3 | 3 | 7 | 6 | 13 |
| 3/4 | 5 | 13 | 1 | 3 |
| 4/4 | 1 | 1 | 1 | 1 |
| Missing | 0 | 0 | 1 | 1 |
DNA isolation and APOE genotyping
DNA was extracted from all 25 matched pair samples using the Promega Maxwell Tissue DNA Kit (Madison, WI) according to manufacturer’s instructions. APOE genotyping was assayed using the Applied Biosystems TaqMan method (Foster City, CA) according to manufacturer’s instructions using the ABI 7900 HT machine [34].
Genome-wide DNA methylation discovery
DNA was bisulfite-treated using the Zymo EZ DNA Methylation Kit (Orange, CA) with a modified thermal cycling protocol (98°C for 10 min, 64°C for 17 h). Genome-wide DNA methylation was assessed with the Infinium HumanMethylation27 BeadArray (Illumina) performed at the University of Michigan DNA Sequencing Core facility in accordance with manufacturer’s instructions and previously published [35]. Six cases and six control samples were randomly applied to each of two 12-sample arrays to avoid biasing case-control differences by batch effect. BeadArrays were imaged using the Illumina BeadArray Reader. Image processing and intensity data extraction are standard components of the BeadScan software that is associated with the BeadArray Reader. The Illumina BeadStudio Software generated percent methylation estimates (beta values) for each probe set based on Cy3 and Cy5 fluorescence intensities. Data was background normalized and exported for further processing.
Statistical methods for bead array
All statistical analysis was performed with the R Statistical Software (version 2.10.1). CpG sites that failed on 10% of samples were not included in subsequent analyses. Linear models adjusting for age and gender were fit across all CpG sites using the limma package (version 3.2.3). As is standard in microarray analyses, empirical Bayesian variance methods were incorporated to site-specific moderated t-tests [36]. The linear model used for each individual CpG site was as follows:
Top hits by case status were identified by p < 0.05 and false discovery rates were calculated. Additional analyses were performed on the top hit. We compared the basic linear model above to a model containing PMI using an F-test. We also compared the R2 goodness of fit of two simple linear regression models containing only either PMI or Case Status as predictors.
Samples were hierarchically clustered by the single linkage method across the top 26 hits by case status. Positional gene set enrichment analysis was performed using Gene Set Enrichment Analysis (GSEA) to determine statistical over-representation of disease specific epigenetic marks within chromosomal cytogenic bands containing at least 15 genes [37]. Enrichment in promoter and 3′ UTR regulatory motifs of disease associated genes was determined by GSEA [38]. Biological processes and molecular functions associated with LOAD gene lists were established using Gene Ontology [39].
Gene-specific DNA methylation validation
Site-specific methylation technical (of the original 12 Discovery Set matched pairs) and population (of an additional 13 matched pairs with an expanded age range) validation of the top CpG hit was determined by bisulfite-pyrosequencing on the Qiagen Pyromark MD instrument (Valencia, CA). Using Pyromark Assay Design Software, a custom pyrosequencing assay was designed to include the two CpG sites present on the Illumina array (Target IDs cg01182697 and cg20793071). This amplicon is located in the promoter of the gene that most statistically distinguished LOAD cases and controls on the Illumina array. Primers were complementary to bisulfite treated DNA in regions without CpG nucleotides (Table 2). The region of interest was amplified by bisulfite-PCR with the following thermal cycling protocol: 15 min activation at 95°C; 50 cycles of 30 s denaturation at 94°C, 30 s annealing at 58°C, 1 min extension at 72°C; followed by a final extension for 10 min at 72°C. Serial dilutions of 100% methylated and unmethylated controls were used to test for any bias in amplification for each assay. Internal bisulfite conversion quality controls were incorporated at original sequence non-CpG cytosines by including C nucleotides in the dispensation order, which should be fully converted to Ts following bisulfite treatment.
Table 2.
Pyrosequencing assay information
| Gene | Sequence 5′–3′ |
|---|---|
| TMEM59 | |
| Forward primer | GGGTAGGTATATAGAATTATATTTGGTATT |
| Reverse primer Biotinylated | AAATTTCTACACACCCCTACTACA |
| Sequencing primer | AATAGATTATATTTTGTAAAAGAA |
| Dispensation order | ATATCGATCGAGGATGTTGATCGAG |
| Sequence to analyze | TAATAAYGAAGGGGATTTGTTTTAYGAGTTAGTATATATGGTGTAAAT |
Incorporation of either a T (for an unmethylated cytosine) or C (for a methylated cytosine) at each CpG provides a quantitative measure for consecutive CpG sites throughout the region sequenced. The level of methylation for each CpG within the target region of analysis was quantified using the Pyro Q-CpG Software. Primers and pyrosequencing assay file information including nucleotide dispensation orders and sequences to analyze are in Table 2.
Gene expression
Functional relevance of top methylation marks distinguishing AD cases and controls was assessed via SYBR green Real Time PCR gene expression assays. RNA was extracted from all 25 matched pair samples using an adjacent portion of the same gray matter sample used for DNA. RNA was extracted using the Qiagen RNeasy Lipid Tissue Kit (Valencia, CA), following homogenization with the Qiagen Tissue Lyser instrument. Assays were designed using Genscript software (Piscataway, NJ). cDNA was generated with the Bio Rad iScript cDNA Synthesis Kit (Hercules, CA) and the primers are listed in Table 3. Quantitative PCR assays were run with the iQ SYBR Green Supermix (Bio Rad) on the CFX96 C1000 Thermal Cycler (Bio Rad). CFX Manager software (Bio Rad) was used to determine the threshold cycle (CT) and perform inter-plate normalizations. CT values relative to β-actin levels were used to compute a fold change between matched pairs. A subset of samples was analyzed on the Affymetrix GeneChip Human Genome U133 Plus 2.0 Array in the University of Michigan Sequencing Core using standard protocols. We determined that β-actin is a suitable control in these samples as gene expression of β-actin did not differ by case control status at any of the 6 probe sets included in the Affymetrix Array (p: 0.13, 0.18, 0.23, 0.43, 0.48, 0.77). Gene expression data were evaluated for normality using R Statistical Software. To determine if higher methylation values were associated with decreased expression of target genes, Spearman correlation coefficients were calculated between CpG methylation (as measured by pyrosequencing) and the expression level data.
Table 3.
Primer sequences for gene expression QPCR assays
| Gene | Sequence 5′–3′ |
|---|---|
| TMEM59 exon 1 | |
| Forward primer | TGACTCGGTCTTGGGTGATA |
| Reverse primer | TCTTCCTTAGGGTAGGTGTGC |
| TMEM59 exons 1–2 | |
| Forward primer | GGGCCTGTCAGTTGACCTAC |
| Reverse primer | CTGCAACCTCTCTGACATGC |
| TMEM59 exons 3–4 | |
| Forward primer | GAACAACTTATGTCCCTGATGC |
| Reverse primer | CGTCATCGGCTTGAAGATAA |
| TMEM59 exons 7–8 | |
| Forward primer | TCCTCTCGGTGATGGTATTG |
| Reverse primer | TCAGCTTCTCAGAGGGAACA |
| B-actin | |
| Forward primer | TGCTATCCAGGCTGTGCTAT |
| Reverse primer | AGTCCATCACGATGCCAGT |
Protein quantification
Adjacent portions of the same 25 matched-pair, gray matter tissue used for DNA were homogenized and protein extracted in Thermo Scientific RIPA buffer (Burlington, Ontario). Protein concentration was quantified using the Thermo Scientific Pierce BSA assay (Burlington, Ontario). Protein (25 μg) was loaded on 10% SDS-polyacrylamide gels for Western blot analysis. Transmembrane protein 59 antibody was purchased from Novus Biologicals (Littleton, CO) and Transmembrane protein 59 control protein was purchased from OriGene (Rockville, MD). The blots were imaged on the VersaDoc 5000MP instrument (Bio Rad) with Quantity One densitometry software (Bio Rad) under a consistent, constrained area. The levels of Transmembrane protein 59 were standardized to the corresponding tubulin band.
RESULTS
Genome-wide descriptive statistics
DNA was extracted from the frontal cortex of 25 age-and gender-matched LOAD case and control human postmortem pairs (Table 1). Sixteen pairs were male and nine pairs were female. LOAD cases and controls did not differ by age (p = 0.68). The mean PMI was 12.8 h, ranging from 3–28 h. Controls had significantly longer PMI than LOAD cases (p = 0.0004). The mean number of years in storage was 11.8, ranging from 2–21 years. Cases and controls did not statistically differ in the number of years in storage (p = 0.07).
In the Discovery Set, a randomly selected subset of 12 matched pairs ranging in age from 69–95 (mean age 79.8) were analyzed for genome-wide DNA methylation using the Illumina Infinium HumanMethylation27 BeadArray. The BeadArray represented 27,578 CpG sites corresponding to 14,475 unique genes. The average number of CpG sites per gene was 1.9, and 92.0% of CpG sites were within 1000 bp of a transcription start site. CpG sites within CpG islands were overrepresented on the array, as 72.5% of sites were within CpG islands. The average number of CpG sites per sample with Illumina detection p > 0.05 (considered failing) was 71.1 (range 11–360 sites). CpG sites that failed on more than 2 samples (>10% samples) were not included for further analyses (n = 171 sites).
The global distribution of 5′-cytosine modifications at all CpG sites measured by the array was bimodal, and the distribution of methylation levels was very similar between cognitively normal controls (Fig. 1A) and AD cases (Fig. 1B). There was a large cluster of sites that had less than 10% methylation (15,735 in controls and 15,619 in AD cases) based on the mean of each group of 12 samples. A second cluster of sites was modified between 75% and 100% (5,226 sites in controls and 5,162 sites in AD cases).
Fig. 1.
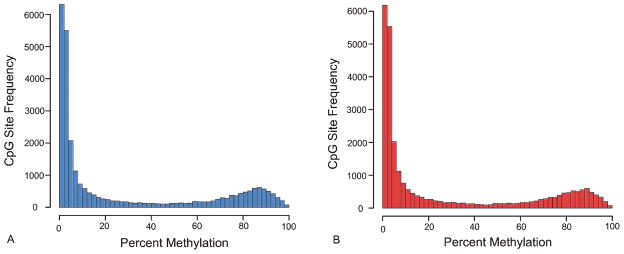
Mean percent methylation frequency distribution of the Discovery Set of 12 cognitively normal control samples (A) and 12 Alzheimer’s disease cases (B) across the 27,578 CpG sites on the Illumina HumanMethylation27 BeadArray.
Of the 27,578 sites on the array, 25,380 sites were located in promoter regions as defined within 1,000 bp of a transcription start site. Only 2,198 sites were outside of known promoters. Promoter CpG sites had a median of 5.1% methylation (IQR = 2.1–5.2) while non-promoter sites had a median of 59.7% methylation (IQR = 11.0–84.0). This observation did not depend on AD case status. On the array, 20,006 sites were located within CpG islands and 7,572 sites were outside of CpG islands. CpG island sites had a median methylation of 3.2% (IQR = 1.7–9.6) and non-CpG island sites had 74.6% median methylation (IQR = 45.5–85.4). This did not depend on AD case status. Our discovery set of 24 samples ranged in age from 69–95 years (Table 1), and age was an important predictor of methylation. There were 2,416 sites and 2,227 unique genes associated with age (based on p = 0.05). Of these sites, 1,294 were hypermethylated with increasing age and 1,122 were hypomethylated with age. The top 25 CpG sites associated with age among controls are listed in Table 4.
Table 4.
CpG sites differentially methylated with age among cognitively normal controls (Discovery Set, Age 69–94). Beta coefficient can be interpreted as the rate of change in methylation per year across the years studied
| Rank | Associated gene | Beta coefficient | p | Distance to transcription start site | CpG island | Chromosome | Biological description |
|---|---|---|---|---|---|---|---|
| 1 | DNAI2 | 0.441 | 1.08E-05 | 714 | FALSE | 17 | Dynein intermediate polypeptide 2; axonemal;. Function in microtubule motor activity |
| 2 | ECM2 | 0.453 | 3.85E-05 | 717 | FALSE | 9 | Extracellular matrix protein 2 precursor. Function in integrin binding and cell-matrix adhesion |
| 3 | UNQ689 | 0.409 | 1.39E-04 | 991 | FALSE | 4 | Hypothetical protein LOC401138 |
| 4 | C3 | 0.262 | 1.52E-04 | 680 | FALSE | 19 | Complement component 3 precursor. Function in acylation-stimulating protein cleavage in innate immune response |
| 5 | OSMR | 0.257 | 2.10E-04 | 404 | TRUE | 5 | Oncostatin M receptor. Role in cell proliferation and cell surface linked signal transduction |
| 6 | MEG3 | −0.456 | 2.15E-04 | NA | TRUE | 14 | Predicted gene from GNOMON |
| 7 | GLO1 | 0.238 | 2.36E-04 | 480 | TRUE | 6 | Glyoxalase I. Role in zinc ion binding, lyase activity in carbohydrate metabolism and antiapoptosis |
| 8 | CRNN | 0.295 | 2.50E-04 | 167 | FALSE | 1 | Hypothetical protein LOC49860. Tumor-related protein |
| 9 | SF3B2 | −0.167 | 2.92E-04 | 484 | TRUE | 11 | Splicing factor 3B subunit 2 |
| 10 | PIK3C2B | 0.221 | 3.22E-04 | 164 | FALSE | 1 | Phosphoinositide-3-kinase; class 2; beta polypeptide. Role in intracellular signaling cascade |
| 11 | RIBC2 | 0.226 | 3.68E-04 | 126 | TRUE | 22 | RIB43A domain with coiled-coils 2. Synonym C22orf11 |
| 12 | CCDC74B | 0.230 | 3.71E-04 | 1015 | FALSE | 2 | Hypothetical protein LOC91409 |
| 13 | C20orf77 | 0.622 | 6.42E-04 | 605 | TRUE | 20 | Hypothetical protein LOC58490 |
| 14 | C9orf112 | 0.530 | 6.84E-04 | 317 | TRUE | 9 | Hypothetical protein LOC92715 |
| 15 | LCE1B | 0.388 | 7.51E-04 | 1310 | FALSE | 1 | Late cornified envelope 1B Role in epidermal differentiation complex 2A |
| 16 | SFRS11 | 0.363 | 7.59E-04 | 1480 | FALSE | 1 | Splicing factor p54. Nucleic acid binding and nuclear mRNA splicing |
| 17 | SLC18A2 | 0.055 | 8.92E-04 | 275 | TRUE | 10 | Solute carrier family 18 (vesicular monoamine); member 2. Vesicle monoamine transporter type 2 |
| 18 | PAPPA | −0.215 | 1.07E-03 | 204 | FALSE | 9 | Pregnancy-associated plasma protein A preproprotein. Insulin-like growth factor dependent IGF binding protein |
| 19 | FIGNL1 | 0.648 | 1.08E-03 | 599 | TRUE | 7 | Fidgetin-like 1 ATP binding nucleoside-triphosphatase activity |
| 20 | NMT1 | −0.088 | 1.10E-03 | 285 | TRUE | 17 | N-myristoyltransferase 1 |
| 21 | VAMP5 | −0.280 | 1.13E-03 | 492 | TRUE | 2 | Vesicle-associated membrane protein 5 (myobrevin). Role in vesicle-mediated transport, myogenesis, and cell differentiation |
| 22 | FLJ33641 | 0.634 | 1.20E-03 | 974 | FALSE | 5 | Hypothetical protein LOC202309 |
| 23 | DVL3 | 0.408 | 1.21E-03 | 580 | TRUE | 3 | Dishevelled 3. Kinase activity. Role in nervous system development |
| 24 | C20orf4 | −0.151 | 1.22E-03 | 250 | TRUE | 20 | Hypothetical protein LOC25980 |
| 25 | IGF2 | 0.534 | 1.25E-03 | NA | TRUE | 11 | Insulin-like growth factor 2 |
Alzheimer’s disease-specific results
Following age and gender adjusted linear fit models with empirical Bayseian standard error adjustments, 948 CpG sites representing 918 unique genes were significantly associated with AD case status (based on p = 0.05). Among these 948 sites, the maximum mean methylation difference between AD cases and controls was 19.5% at a CpG site 249 base pairs from the predicted TSS of C21orf56 on chromosome 21 (cases 34.8% methylated versus controls 15.9% methylated). The mean observed disease specific methylation difference across the 958 sites was 2.9% (IQR = 0.88–4.2).
The top 26 autosomal CpG sites distinguishing cases and controls (as defined by FDR) are depicted in a heatmap (Fig. 2). Samples clustered on case status with the exception of two control samples. One of those controls was the oldest control subject in the study at 94 years of age. The top 25 CpG sites that were significantly different by case status are outlined in Table 5.
Fig. 2.

Hierarchical clustering heatmap of the Discovery Set top 26 autosomal CpG loci associated with late-onset Alzheimer’s disease (LOAD) case/control status after adjusting for sex and age. Green represents hypermethylation in LOAD cases and red represents hypomethylation in cases. Horizontal color bars at the top refer to the age, sex, and case status of the sample. In the Case Status color bar, light green represents control samples and dark green represents LOAD cases. For sex, female is light pink and male is dark blue. In the age panel, black represents ages 91–95, darkest gray 86–90, medium gray 81–85, light gray 76–80, lightest gray 71–75, and white represents ages 66–70. Vertical color bars on the left refer to the CpG island and promoter status of the CpG sites. In the CpG island bar, dark purple represents sites within CpG islands and light purple represents sites outside of CpG islands. In the promoter bar, dark orange represents sites within promoter regions and light orange represents sites outside of promoter regions.
Table 5.
Table of the 25 CpG sites most significantly differentially methylated by AD case status (Discovery Set)
| Rank | Associated gene | % Methylation cases | % Methylation controls | p | Distance to transcription start site | CpG island | Chromosome | Biological description |
|---|---|---|---|---|---|---|---|---|
| 1 | TMEM59 | 63.03 | 70.30 | 1.32E-05 | 1339 | FALSE | 1 | AβPP post-translational glycolytic processing |
| 2 | ATG10 | 8.16 | 5.59 | 1.97E-04 | 197 | TRUE | 5 | Autophagy |
| 3 | C9orf138 | 85.53 | 77.88 | 2.08E-04 | 47 | TRUE | 9 | Hypothetical protein |
| 4 | CPNE9 | 4.76 | 6.33 | 4.43E-04 | 549 | TRUE | 3 | Copine-like protein |
| 5 | RELB | 36.40 | 45.75 | 5.68E-04 | 470 | TRUE | 19 | Reticuloendotheliosis viral oncogene homolog B |
| 6 | C9orf138 | 68.36 | 57.60 | 8.92E-04 | 406 | TRUE | 9 | Hypothetical protein |
| 7 | PLA2G3 | 45.95 | 37.03 | 9.66E-04 | 488 | FALSE | 22 | Phospholipase A2 |
| 8 | DHFRL1 | 6.41 | 4.41 | 1.08E-03 | 511 | TRUE | 3 | Hypothetical protein |
| 9 | MBD3L1 | 16.33 | 11.98 | 1.08E-03 | 141 | FALSE | 19 | Methyl-CpG binding domain protein 3-like |
| 10 | RSN | 2.37 | 2.85 | 1.37E-03 | 698 | TRUE | 12 | Restin isoform a. Intermediate filament associated protein |
| 11 | OTUD5 | 22.39 | 18.53 | 1.53E-03 | 232 | TRUE | × | Hypothetical protein |
| 12 | TUBB2B | 7.58 | 10.50 | 1.53E-03 | 494 | TRUE | 6 | Tubulin, beta polypeptide paralog. Microtubule associated |
| 13 | NTN2L | 7. .63 | 4.97 | 1.59E-03 | 159 | TRUE | 16 | Netrin 2-like. Structural molecule, axon guidance |
| 14 | GPR142 | 90.60 | 88.52 | 1.64E-03 | 237 | FALSE | 17 | Signal transduction |
| 15 | TSCOT | 55.93 | 62.95 | 1.65E-03 | 498 | TRUE | 9 | Thymic stromal co-transporter |
| 16 | IL2RG | 67.12 | 60.80 | 1.70E-03 | 88 | FALSE | × | Interleukin 2 receptor, gamma precursor |
| 17 | BNC1 | 39.63 | 48.20 | 1.86E-03 | NA | TRUE | 15 | Zinc finger protein basonuclin. Metal ion binding |
| 18 | HERC5 | 2.57 | 1.43 | 1.91E-03 | 108 | TRUE | 4 | Cyclin-E binding protein 1 |
| 19 | SLC36A3 | 73.03 | 80.25 | 2.18E-03 | 203 | FALSE | 5 | Proton/amino acid transporter 3 |
| 20 | DYNC2LI1 | 4.44 | 3.05 | 2.21E-03 | 24 | TRUE | 2 | Dynein 2 light intermediate chain |
| 21 | SLC7A3 | 10.20 | 6.88 | 2.32E-03 | 208 | TRUE | × | Cationic amino acid transporter |
| 22 | FGF5 | 4.24 | 5.70 | 2.36E-03 | 544 | TRUE | 4 | Fibroblast growth factor 5 |
| 23 | CAMP | 92.62 | 89.57 | 2.53E-03 | 284 | FALSE | 3 | Cathelicidin antimicrobial peptide |
| 24 | CNN1 | 13.81 | 9.18 | 2.59E-03 | 92 | TRUE | 19 | Caloonin 1. Calmodulin binding |
| 25 | C15orf21 | 87.01 | 88.96 | 2.76E-03 | 7 | FALSE | 15 | Dresden prostate carcinoma 2 |
Gene ontology analysis of the top 958 disease specific sites revealed hypermethylation in several molecular functions and biological processes associated with transcription. The top 10 molecular functions enriched for hypermethylation with AD cases were RNA polymerase II transcription factor activity (Fig. 3A), RNA binding, GTPase regulator activity, cytokine binding, DNA binding, lyase activity, ATPase activity, transcription factor activity, and nucleoside triphosphatase activity. Similarly, the top 10 biological processes associated with hypermethylation were nucleic acid metabolic process, DNA replication, regulation of nucleic acid metabolism, regulation of DNA dependent transcription, regulation of RNA metabolic process, regulation of cell cycle, DNA dependent transcription, positive regulation of RNA metabolic process, DNA metabolic process, RNA biosynthetic process, and nervous system development.
Fig. 3.
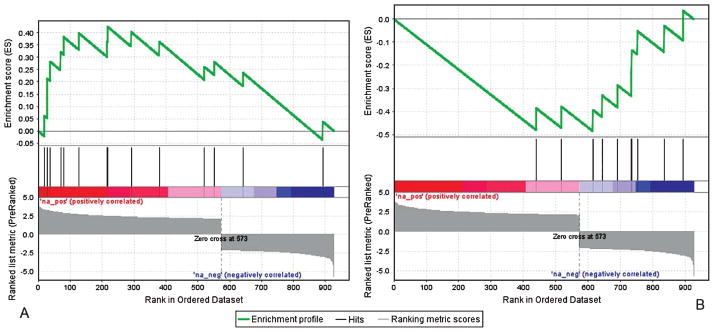
Discovery Set gene set enrichment analysis plots. A) Genes associated with RNA polymerase II transcription factor activity molecular function were hypermethylated in LOAD cases relative to controls (p = 0.013). B) Genes associated with carboxylic acid metabolic biological processes were hypomethylated in LOAD cases relative to controls (p = 0.013).
Hypomethylation was enriched at functions and processes related to membrane transport and protein metabolism. The top 10 molecular functions associated with hypomethylation in AD cases are electron carrier activity, cation transmembrane transporter activity, metal ion transmembrane transporter activity, enzyme binding, rhodopsin-like receptor activity, cation channel activity, integrin binding, phosphoric ester hydrolase activity, G-protein coupled receptor activity, and peptidase activity. The top 10 biological processes associated with hypomethylation in LOAD cases were carboxylic acid metabolic processes (Fig. 3B), organic acid metabolic process, biosynthetic process, cation transport, nitrogen compound metabolic process, amine metabolic process, negative regulation of developmental process, programmed cell death, apoptosis, and anti-apoptosis.
Several promoter and 3′ UTR regulatory binding motifs were enriched in the disease associated gene list. Hypermethylation in LOAD cases was observed in genes containing binding site motifs for transcription factors POU3F2 (p < 0.001) and HOXA4 (p = 0.004), and microRNAs MIR-9 (p = 0.002), MIR-518C (p < 0.001), MIR-1 (p = 0.025), and MIR-326 (p = 0.019). Genes containing MIR-140 (p = 0.04) and NFE2 (p = 0.019) motifs were hypomethylated in LOAD cases.
Positional gene set analysis of the 958 disease associated CpG sites identified enrichment of hypomethylation at the chromosomal location19q13 (Normalized Enrichment Score (NES) = 1.24), in cyto-genetic band region where the APOE gene is located [5]. In addition, hypermethylation in LOAD cases was seen at 19q13 (NES = −0.72), a candidate location for genetic linkage with LOAD [40]. We visually identified broad regions of altered methylation in AD brains compared to control brains (Fig. 4). These include the p-arm of chromosome 14 and distal q-arm of chromosome 3 (hypomethylated in AD brains compared to control brains) and the p-arms of chromosomes 10 and 17 (hypermethylated in AD brains compared to control brains). Chromosome 15 had the highest density of observed disease-specific methylation differences.
Fig. 4.

Human chromosome ideogram in black. Distribution of CpG sites featured on the Illumina HumanMethylation27 BeadArray is below the chromosomes in blue. Distribution of CpG sites that were significantly associated with late-onset Alzheimer’s disease (LOAD) in the Discovery Set are above the ideograms. Green represents hypermethylation with LOAD status. Red represents hypomethylation with LOAD status.
We checked the list of disease specific hits identified with the BeadArray for genes known to be associated with AD. There were two CpG sites on the array corresponding to each of the following genes: ABCA7, APOE, ABPP, BACE1, BDNF, BIN1, CD2AP, CD33, CLU, CR1, EPHA1, MAPT, MS4A6A, PICALM PSEN2, and TOMM40. There was one site representing PSEN1 on the array and this site was associated with AD (Cases mean methylation = 1.6%, Controls mean methylation = 2.6%; p = 0.034; cg11490446). Gene expression of the probe set for PSEN1 at exon 2 differed by case status based on the results of the Affymetrix gene expression array (probe 207782 s at, p = 0.0076, fdr = 0.35). The Spearman correlation coefficient linking expression of this gene expression probe set and methylation measured by the Illumina BeadArray is −0.61 (p value = 0.0014). AD cases were less methylated and had higher expression of this probe. There was no difference gene expression in the other five probe sets for PSEN1. One of the two sites corresponding to EPHA1 was associated with hypermethylation with age (p = 0.029; cg02376703). One of the two sites associated with PSEN2 was associated with hypomethylation with age (p = 0.030; cg25514304). The remaining CpG sites within LOAD candidate genes were not associated with differential methylation by case status or age.
We also assessed known human imprinted genes for their association with AD, focusing on CpG sites located within Differentially Methylated Regions (DMRs) [41]. The Illumina array contains 10 sites in the DMR for DIRAS3, 8 sites each for PLAGL1 and GNAS, 7 sites for ZIM2, 4 sites for PEG10, 3 sites for PEG3, 2 sites for MEST, and 1 site each for the genes GRB10, KCNQ1, and SNURF. One of the sites in the DMR for DIRAS3 was more highly methylated in AD cases (43.4%) than controls (38.5%) (p = 0.024; cg21808053). One of the sites in the DMR for GNAS was hypomethylated with age among controls (p = 0.012; cg21625881) and the site for KCNQ1 was hypermethylated with age (p = 0.023; cg27119222).
Gene-specific results
After adjusting for age and gender, the highest ranking site (FDR = 0.36, p = 0.000013) associated with LOAD was a CpG site upstream of Transmembrane Protein 59 (TMEM59). TMEM59 is responsible for post-translational glycosylation of AβPP and leads to retention of AβPP in the Golgi apparatus [42]. AD cases had 7.3% lower methylation at TMEM59 than controls, and this difference was more profound in older subjects (Fig. 5A). Methylation of TMEM59 was significantly associated with age in cases relative to controls (p = 0.013). In a second TMEM59 model, we added PMI as a predictor and compared the goodness of fit of the two nested models using an F-test. PMI did not improve the model fit and PMI is not a statistically significant predictor of methylation at the TMEM59 site. In a simple linear regression model with Case Status as the only predictor of TMEM59 methylation, the model fit R2 was 0.597. The model fit R2 with PMI as the only predictor was 0.132.
Fig. 5.

Methylation upstream of the TMEM59 gene. A) Percent methylation by age and case status (Late-Onset Alzheimer’s Disease cases in red; Controls in blue). Data from the Illumina HumanMethylation27 BeadArray. B) Age versus percent methylation bisulfite-pyrosequencing technical validation data of original 24 samples run in duplicate in the Discovery Set. C) Age versus percent methylation bisulfite pyrosequencing of Discovery Set 24 samples plus 26 additional population validation samples run in duplicate. D) A representative bisulfite-pyrosequencing assay pyrogram for 2 CpG sites in the promoter of TMEM59.
The methylation findings were technically validated by pyrosequencing a single assay containing both CpG sites from the Illumina array that were associated with TMEM59. The CpG density 1000 bp flanking the top hit on either side is 1.5%. Pyrosequencing the original 24 discovery samples confirmed the difference between cases and controls at TMEM59 was 2.7% (Fig. 5B and D). Methylation was again associated with age in cases relative to controls in the technical validation (p = 0.0084). Pyrosequencing of an additional 26 matched pair samples across an expanded younger age range (61–94) confirmed the age-associated reduction in methylation (p = 0.0022), and the association with AD case status was not statistically significant at an alpha of 0.05 (p = 0.088) (Fig. 5C).
We determined expression levels of TMEM59 at four points along the 8 exon transcript (Fig. 6A) (including the beginning, end, and two middle sites) to functionally validate the DNA methylation results with the TMEM59 gene. At the four locations along the transcript that were assayed by real time PCR, controls had lower RNA expression levels than cases (Fig. 6B). For the first assay on the transcript, AD cases had 24.9% higher expression (fold change 1.33; p = 0.0013). For two assays in the middle of the transcript, AD cases had 20.5% (fold change 1.26; p = 0.0071) and 28.3% (fold change 1.40; p = 0.056) higher expression. The assay at the end of the transcript showed AD cases to have 21.5% (fold change 1.27; p = 0.0036) higher expression than controls. DNA methylation and RNA expression were negatively correlated at TMEM59 (Spearman correlation coefficient = −0.274, p = 0.0083).
Fig. 6.

Functional validation of observed DNA methylation differences for TMEM59, a gene involved in the post-translational modification of AβPP. A) TMEM59 is located on chromosome 1 and is transcribed on the reverse strand. The reference sequence mRNA is yellow. Predicted alternative isoforms are in blue. B) Boxplot of TMEM59 gene expression by Q-PCR in the Discovery Set. Two-sample t-test between cases and controls were all statistically significant (exon 1 p = 0.0013; exons 1–2 p = 0.0071; exons 3–4 p = 0.0036, exons 7–8 p = 0.0083). C) Boxplot of relative protein levels of TMEM59 in the Discovery Set plus an additional 26 validation samples. Paired t-tests did not reflect case specific differences for the full length protein (p = 0.68), while the shorter protein fragment was significantly lower in AD cases (p = 0.040). D) Levels of the shorter TMEM59 protein fragment as a function of age. E) Representative western blot image of TMEM59 protein expression in controls and AD cases 1–3 representing identical exposures of the same gel. No differences were detected between AD and controls for full length TMEM59 protein based on case status, but the levels of the TMEM59 shorter proteins were reduced in AD cases. These shorter proteins were also observed in the TMEM59 control protein lysate.
To further investigate the functional implications of the observed DNA methylation and gene expression differences of TMEM59, we measured the protein levels by Western blot in the full set of 25 case brains and 25 control brains. No differences were observed for the full length 36 kDa protein (p = 0.68) (Fig. 6 C), but AD cases had reduced levels of a shorter protein that was also bound by the antibody specific for the C-terminus of TMEM59 (p = 0.040) (Fig. 6C, E). The quantity of shorter protein was associated with age (Fig. 6D).
DISCUSSION
We performed a genome-wide, semi-unbiased quantitative comparison of frontal cortex DNA methylation from age- and gender-matched LOAD cases and controls. The CpG site most strongly associated with case status was located in the promoter region of TMEM59, a gene recently implicated in AD pathogenesis [42]. This gene is involved in the post-translational modification of AβPP and causes retention of AβPP in the Golgi apparatus [42]. The magnitude of methylation difference at this site between cases and controls was very modest (7.3% difference using the Illumina array), but the direction of association was confirmed using an alternate method of DNA methylation detection (2.7% difference using pyrosequencing). In an expanded population including a higher number of younger cases and controls, an interaction between age and case status was detected. Thus, age modifies the association between disease status and methylation. There was not a primary association between case status and methylation when the younger population was included. In the original sample of LOAD cases and controls, TMEM59 DNA methylation levels corresponded to functional changes in TMEM59 gene expression. LOAD cases had lower methylation and higher expression of TMEM59 than control samples. No differences in the level of the full length TMEM59 protein were observed between cases and controls; however a smaller protein that bound the TMEM59 antibody was significantly higher in controls. This TMEM59 protein size pattern is consistent with the TMEM59 control protein lysate. The shorter protein may represent a proteolytic product of the full length protein. The shorter protein is approximately 17 kDa, which could also be consistent with translation of an alternative RNA transcript beginning at exon 5 of the TMEM59 gene. The observed differences in protein expression levels are consistent with epigenetic regulation. Further molecular research is needed to better understand the gene expression and protein regulation and potential role of DNA methylation at this site.
Well-studied genes known to be involved in AD pathogenesis or identified through GWAS for genetic association with LOAD were largely not associated with disease-specific DNA methylation differences in this study. A notable exception was PSEN1, which was modestly hypomethylated in LOAD cases. Consistent with previous human postmortem tissue studies, PSEN1 showed very low levels of methylation in our population [43]. Here, LOAD cases had reduced DNA methylation that was associated with increased PSEN1 gene expression, suggesting the DNA methylation change may be functional at this site. Studies in mice and neuroblastoma cell lines demonstrate that PSEN1 gene expression is regulated by DNA methylation at specific promoter CpG sites and this regulation depends on B vitamin availability [44]. The correlation between DNA methylation and gene expression in our study support the cell line and mouse model findings. The Illumina HumanMethylation27 BeadArray platform used in this study also allowed for discovery of novel gene associations with AD. For example, methylation change was observed within the DMR for the imprinted gene, DIRAS3. Genomic imprinting in AD is a potential mechanism to explain epidemiological parent-of-origin inheritance observations [45, 46].
Greater than 900 genes (6% of genes featured on the array) were differentially methylated by case status after adjusting for age and gender. Overall, the disease related methylation effect size (2.9%) was relatively modest, and the global methylation distributions of AD cases and controls were similar. Together these findings suggest that DNA methylation may play a role in LOAD and the individual effects at each CpG site may be subtle. The magnitude and absolute number of DNA methylation changes observed in this study are consistent with previous reports in the literature performed on candidate gene subsets. In a case-control study of prefrontal cortex DNA methylation of twelve genes, only two genes were associated with AD status and the differences in methylation were less than 10% [47].
Gene set enrichment analysis revealed key patterns in the identified set of disease associated CpG sites. First, gene ontology analysis showed hypermethylation of genes involved in transcription and DNA replication, while membrane transporters were hypomethylated. Second, hypermethylation was enriched at genes containing POU3F2 binding motifs. POU3F2 is a transcription factor critical in central nervous system development that regulates Nestin gene expression, a protein important for radial axon growth [48]. Third, positional analysis showed hypomethylation with case status at 19q13 and hypermethylation at 19p13, cytogenic band regions genetically linked with AD [5, 40].
LOAD cases and control sample groups were similar with respect length of time in storage, but LOAD cases had shorter PMI then control samples (p = 0.0004). During PMI, samples may be exposed to damaging lower pH conditions and higher temperatures where enzymes may be active. PMI was not a significant confounder at the TMEM59 site, however, PMI may be a factor at other specific locations throughout the DNA methylome.
This study measured genome-wide DNA methylation differences between LOAD case and control subjects aged 69 to 95. Across this relatively short age range, DNA methylation was associated with age at over 2,400 CpG sites, representing more than 8% of the sites on the BeadArray. Both hyper- and hypomethylation was observed. Previous studies have observed global hypomethylation with age in the brain [49], but gene-specific studies of aging and methylation have noted varying patterns [43]. These results further support age as an important covariate to consider in statistical models of DNA methylation in late life.
Age is a major factor in epigenetic change in the brain [17], potentially confounding or modifying disease specific associations. In a study of cerebral cortex DNA from gestation to 104 years of age, eight of fifty loci showed increases in methylation through late life and two sites presented changes suggestive of an acceleration of age-related change in a subset of samples with LOAD [43]. Additional evidence supports increased age-dependent epigenetic drift with disease. In LOAD prefrontal cortex samples representing a 30 year age range, an age-specific epigenetic drift was more prominent among cases compared to controls. The average methylation in promoters of MTHFR and APOE increased by 6.8%, while control samples decreased with age by 10.6% [47].
Cultured cells can potentially have very different epigenetic profiles than primary cells as an artifact of growth in culture [50], and thus use of primary human frontal cortex tissue is a strength of this study. DNA methylation is brain region specific and greater differences have been seen between the cerebellum and cortex regions than by gender, age, PMI, race, or cause of death [18]. This study consistently used frontal cortex tissue because of its role in advanced AD. As with many studies of epigenomic, transcriptomic, or proteomic changes in the human brain, the tissue samples represented populations of mixed cell types, an important limitation, which may have resulted in attenuated effects. Epigenomes are cell type specific [15, 51], and brain cell types have different roles in AD [52]. The AD brain has an active changing cell population including neuronal loss and glial activation [53] that may in part be responsible for the observed results. DNA methylation data, however, was not enriched in inflammatory mediators, which would have supported changes due to gliosis. This study considered brain region specific methylation and as epigenomic platforms require lower input DNA amounts, future research may be able to also consider cell type specific changes.
Results from large DNA methylome and transcriptome maps of the human brain suggest that intragenic CpG sites rather than promoter CpG islands may better correlate with transcription [15]. The genome-wide sites included on the Illumina Infinium HumanMethylation27 BeadArray are more likely to be located within promoter region CpG islands. Important methylation events located elsewhere throughout the genome would be missed using this platform and may be included in future research utilizing alternative technologies.
These results must be interpreted with caution because this study had a small sample size relative to the large number of CpG site comparisons and the magnitude of observed methylation differences between LOAD cases and controls was moderate. The results from the array were technically validated at the top CpG site, but it is not clear whether this observation will be consistent across populations. While a small study, we identified modest DNA methylation differences as a potential event in LOAD.
Acknowledgments
We would like to thank Cheryl Teboe from the Data Core at the Michigan Alzheimer’s Disease Center (MADC) for providing the clinical data on the samples used in this study. Lisa Bain from the MADC Neuropathology Core provided the tissue samples used in this study. Susan Dagenais at the University of Michigan DNA Sequencing Core (PI: Robert Lyons) ran the Illumina BeadArray for this study. This study was supported by an anonymous gift to the MADC, the University of Michigan NIEHS Center (P30ES017885), and the Michigan CTSA (NIH grant number UL1RR024986). This analysis was supported by the NIA T32 Interdisciplinary Studies in Public Health and Aging (T32AG027708).
Footnotes
Authors’ disclosures available online (http://www.j-alz.com/disclosures/view.php?id=1109).
References
- 1.Alzheimer’s Disease International. World Alzheimer Report 2010: The global economic impact of dementia. 2010 http://www.alz.co.uk/research/files/WorldAlzheimer-Report2010.pdf.
- 2.Bird TD. Genetic factors in Alzheimer’s disease. N Engl J Med. 2005;352:862–864. doi: 10.1056/NEJMp058027. [DOI] [PubMed] [Google Scholar]
- 3.Bertram L. Alzheimer’s disease genetics current status and future perspectives. Int Rev Neurobiol. 2009;84:167–184. doi: 10.1016/S0074-7742(09)00409-7. [DOI] [PubMed] [Google Scholar]
- 4.Hardy J. Amyloid, the presenilins and Alzheimer’s disease. Trends Neurosci. 1997;20:154–159. doi: 10.1016/s0166-2236(96)01030-2. [DOI] [PubMed] [Google Scholar]
- 5.Kim J, Basak JM, Holtzman DM. The role of apolipoprotein E in Alzheimer’s disease. Neuron. 2009;63:287–303. doi: 10.1016/j.neuron.2009.06.026. [DOI] [PMC free article] [PubMed] [Google Scholar]
- 6.Ashford JW. APOE genotype effects on Alzheimer’s disease onset and epidemiology. J Mol Neurosci. 2004;23:157–165. doi: 10.1385/JMN:23:3:157. [DOI] [PubMed] [Google Scholar]
- 7.Ertekin-Taner N. Genetics of Alzheimer disease in the pre- and post-GWAS era. Alzheimers Res Ther. 2010;2:3. doi: 10.1186/alzrt26. [DOI] [PMC free article] [PubMed] [Google Scholar]
- 8.Harold D, Abraham R, Hollingworth P, Sims R, Gerrish A, Hamshere ML, Pahwa JS, Moskvina V, Dowzell K, Williams A, Jones N, Thomas C, Stretton A, Morgan AR, Lovestone S, Powell J, Proitsi P, Lupton MK, Brayne C, Rubinsztein DC, Gill M, Lawlor B, Lynch A, Morgan K, Brown KS, Passmore PA, Craig D, McGuinness B, Todd S, Holmes C, Mann D, Smith AD, Love S, Kehoe PG, Hardy J, Mead S, Fox N, Rossor M, Collinge J, Maier W, Jessen F, Schurmann B, van den Bussche H, Heuser I, Kornhuber J, Wiltfang J, Dichgans M, Frolich L, Hampel H, Hull M, Rujescu D, Goate AM, Kauwe JS, Cruchaga C, Nowotny P, Morris JC, Mayo K, Sleegers K, Bettens K, Engelborghs S, De Deyn PP, Van Broeckhoven C, Livingston G, Bass NJ, Gurling H, McQuillin A, Gwilliam R, Deloukas P, Al-Chalabi A, Shaw CE, Tsolaki M, Singleton AB, Guerreiro R, Muhleisen TW, Nothen MM, Moebus S, Jockel KH, Klopp N, Wichmann HE, Carrasquillo MM, Pankratz VS, Younkin SG, Holmans PA, O’Donovan M, Owen MJ, Williams J. Genome-wide association study identifies variants at CLU and PICALM associated with Alzheimer’s disease. Nat Genet. 2009;41:1088–1093. doi: 10.1038/ng.440. [DOI] [PMC free article] [PubMed] [Google Scholar]
- 9.Lambert JC, Heath S, Even G, Campion D, Sleegers K, Hiltunen M, Combarros O, Zelenika D, Bullido MJ, Tavernier B, Letenneur L, Bettens K, Berr C, Pasquier F, Fievet N, Barberger-Gateau P, Engelborghs S, De Deyn P, Mateo I, Franck A, Helisalmi S, Porcellini E, Hanon O, de Pancorbo MM, Lendon C, Dufouil C, Jaillard C, Leveillard T, Alvarez V, Bosco P, Mancuso M, Panza F, Nacmias B, Bossu P, Piccardi P, Annoni G, Seripa D, Galimberti D, Hannequin D, Licastro F, Soininen H, Ritchie K, Blanche H, Dartigues JF, Tzourio C, Gut I, Van Broeckhoven C, Alperovitch A, Lathrop M, Amouyel P. Genome-wide association study identifies variants at CLU and CR1 associated with Alzheimer’s disease. Nat Genet. 2009;41:1094–1099. doi: 10.1038/ng.439. [DOI] [PubMed] [Google Scholar]
- 10.Naj AC, Jun G, Beecham GW, Wang LS, Vardarajan BN, Buros J, Gallins PJ, Buxbaum JD, Jarvik GP, Crane PK, Larson EB, Bird TD, Boeve BF, Graff-Radford NR, De Jager PL, Evans D, Schneider JA, Carrasquillo MM, Ertekin-Taner N, Younkin SG, Cruchaga C, Kauwe JS, Nowotny P, Kramer P, Hardy J, Huentelman MJ, Myers AJ, Barmada MM, Demirci FY, Baldwin CT, Green RC, Rogaeva E, George-Hyslop PS, Arnold SE, Barber R, Beach T, Bigio EH, Bowen JD, Boxer A, Burke JR, Cairns NJ, Carlson CS, Carney RM, Carroll SL, Chui HC, Clark DG, Corneveaux J, Cotman CW, Cummings JL, Decarli C, Dekosky ST, Diaz-Arrastia R, Dick M, Dickson DW, Ellis WG, Faber KM, Fallon KB, Farlow MR, Ferris S, Frosch MP, Galasko DR, Ganguli M, Gearing M, Geschwind DH, Ghetti B, Gilbert JR, Gilman S, Giordani B, Glass JD, Growdon JH, Hamilton RL, Harrell LE, Head E, Honig LS, Hulette CM, Hyman BT, Jicha GA, Jin LW, Johnson N, Karlawish J, Karydas A, Kaye JA, Kim R, Koo EH, Kowall NW, Lah JJ, Levey AI, Lieberman AP, Lopez OL, Mack WJ, Marson DC, Martiniuk F, Mash DC, Masliah E, McCormick WC, McCurry SM, McDavid AN, McKee AC, Mesulam M, Miller BL, Miller CA, Miller JW, Parisi JE, Perl DP, Peskind E, Petersen RC, Poon WW, Quinn JF, Rajbhandary RA, Raskind M, Reisberg B, Ringman JM, Roberson ED, Rosenberg RN, Sano M, Schneider LS, Seeley W, Shelanski ML, Slifer MA, Smith CD, Sonnen JA, Spina S, Stern RA, Tanzi RE, Trojanowski JQ, Troncoso JC, Van Deerlin VM, Vinters HV, Vonsattel JP, Weintraub S, Welsh-Bohmer KA, Williamson J, Woltjer RL, Cantwell LB, Dombroski BA, Beekly D, Lunetta KL, Martin ER, Kamboh MI, Saykin AJ, Reiman EM, Bennett DA, Morris JC, Montine TJ, Goate AM, Blacker D, Tsuang DW, Hakonarson H, Kukull WA, Foroud TM, Haines JL, Mayeux R, Pericak-Vance MA, Farrer LA, Schellenberg GD. Common variants at MS4A4/MS4A6E, CD2AP, CD33 and EPHA1 are associated with late-onset Alzheimer’s disease. Nat Genet. 2011;43:436–441. doi: 10.1038/ng.801. [DOI] [PMC free article] [PubMed] [Google Scholar]
- 11.Hollingworth P, Harold D, Sims R, Gerrish A, Lambert JC, Carrasquillo MM, Abraham R, Hamshere ML, Pahwa JS, Moskvina V, Dowzell K, Jones N, Stretton A, Thomas C, Richards A, Ivanov D, Widdowson C, Chapman J, Lovestone S, Powell J, Proitsi P, Lupton MK, Brayne C, Rubinsztein DC, Gill M, Lawlor B, Lynch A, Brown KS, Passmore PA, Craig D, McGuinness B, Todd S, Holmes C, Mann D, Smith AD, Beaumont H, Warden D, Wilcock G, Love S, Kehoe PG, Hooper NM, Vardy ER, Hardy J, Mead S, Fox NC, Rossor M, Collinge J, Maier W, Jessen F, Ruther E, Schurmann B, Heun R, Kolsch H, van den Bussche H, Heuser I, Kornhuber J, Wiltfang J, Dichgans M, Frolich L, Hampel H, Gallacher J, Hull M, Rujescu D, Giegling I, Goate AM, Kauwe JS, Cruchaga C, Nowotny P, Morris JC, Mayo K, Sleegers K, Bettens K, Engelborghs S, De Deyn PP, Van Broeckhoven C, Livingston G, Bass NJ, Gurling H, McQuillin A, Gwilliam R, Deloukas P, Al-Chalabi A, Shaw CE, Tsolaki M, Singleton AB, Guerreiro R, Muhleisen TW, Nothen MM, Moebus S, Jockel KH, Klopp N, Wichmann HE, Pankratz VS, Sando SB, Aasly JO, Barcikowska M, Wszolek ZK, Dickson DW, Graff-Radford NR, Petersen RC, van Duijn CM, Breteler MM, Ikram MA, Destefano AL, Fitzpatrick AL, Lopez O, Launer LJ, Seshadri S, Berr C, Campion D, Epelbaum J, Dartigues JF, Tzourio C, Alperovitch A, Lathrop M, Feulner TM, Friedrich P, Riehle C, Krawczak M, Schreiber S, Mayhaus M, Nicolhaus S, Wagenpfeil S, Steinberg S, Stefansson H, Stefansson K, Snaedal J, Bjornsson S, Jonsson PV, Chouraki V, Genier-Boley B, Hiltunen M, Soininen H, Combarros O, Zelenika D, Delepine M, Bullido MJ, Pasquier F, Mateo I, Frank-Garcia A, Porcellini E, Hanon O, Coto E, Alvarez V, Bosco P, Siciliano G, Mancuso M, Panza F, Solfrizzi V, Nacmias B, Sorbi S, Bossu P, Piccardi P, Arosio B, Annoni G, Seripa D, Pilotto A, Scarpini E, Galimberti D, Brice A, Hannequin D, Licastro F, Jones L, Holmans PA, Jonsson T, Riemenschneider M, Morgan K, Younkin SG, Owen MJ, O’Donovan M, Amouyel P, Williams J. Common variants at ABCA7, MS4A6A/MS4A4E, EPHA1, CD33 and CD2AP are associated with Alzheimer’s disease. Nat Genet. 2011;43 :429–435. doi: 10.1038/ng.803. [DOI] [PMC free article] [PubMed] [Google Scholar]
- 12.Gatz M, Pedersen NL, Berg S, Johansson B, Johansson K, Mortimer JA, Posner SF, Viitanen M, Winblad B, Ahlbom A. Heritability for Alzheimer’s disease: The study of dementia in Swedish twins. J Gerontol A Biol Sci Med Sci. 1997;52:M117–M125. doi: 10.1093/gerona/52a.2.m117. [DOI] [PubMed] [Google Scholar]
- 13.Nee LE, Lippa CF. Alzheimer’s disease in 22 twin pairs–13-year follow-up: Hormonal, infectious and traumatic factors. Dement Geriatr Cogn Disord. 1999;10:148–151. doi: 10.1159/000017115. [DOI] [PubMed] [Google Scholar]
- 14.Li YJ, Scott WK, Hedges DJ, Zhang F, Gaskell PC, Nance MA, Watts RL, Hubble JP, Koller WC, Pahwa R, Stern MB, Hiner BC, Jankovic J, Allen FA, Jr, Goetz CG, Mastaglia F, Stajich JM, Gibson RA, Middleton LT, Saunders AM, Scott BL, Small GW, Nicodemus KK, Reed AD, Schmechel DE, Welsh-Bohmer KA, Conneally PM, Roses AD, Gilbert JR, Vance JM, Haines JL, Pericak-Vance MA. Age at onset in two common neurodegenerative diseases is genetically controlled. Am J Hum Genet. 2002;70:985–993. doi: 10.1086/339815. [DOI] [PMC free article] [PubMed] [Google Scholar]
- 15.Maunakea AK, Nagarajan RP, Bilenky M, Ballinger TJ, D’Souza C, Fouse SD, Johnson BE, Hong C, Nielsen C, Zhao Y, Turecki G, Delaney A, Varhol R, Thiessen N, Shchors K, Heine VM, Rowitch DH, Xing X, Fiore C, Schillebeeckx M, Jones SJ, Haussler D, Marra MA, Hirst M, Wang T, Costello JF. Conserved role of intragenic DNA methylation in regulating alternative promoters. Nature. 2010;466:253–257. doi: 10.1038/nature09165. [DOI] [PMC free article] [PubMed] [Google Scholar]
- 16.Jin SG, Wu X, Li AX, Pfeifer GP. Genomic mapping of 5-hydroxymethylcytosine in the human brain. Nucleic Acids Res. 2011;39:5015–5024. doi: 10.1093/nar/gkr120. [DOI] [PMC free article] [PubMed] [Google Scholar]
- 17.Hernandez DG, Nalls MA, Gibbs JR, Arepalli S, van der Brug M, Chong S, Moore M, Longo DL, Cookson MR, Traynor BJ, Singleton AB. Distinct DNA methylation changes highly correlated with chronological age in the human brain. Hum Mol Genet. 2011;20:1164–1172. doi: 10.1093/hmg/ddq561. [DOI] [PMC free article] [PubMed] [Google Scholar]
- 18.Ladd-Acosta C, Pevsner J, Sabunciyan S, Yolken RH, Webster MJ, Dinkins T, Callinan PA, Fan JB, Potash JB, Feinberg AP. DNA methylation signatures within the human brain. Am J Hum Genet. 2007;81:1304–1315. doi: 10.1086/524110. [DOI] [PMC free article] [PubMed] [Google Scholar]
- 19.Mill J, Tang T, Kaminsky Z, Khare T, Yazdanpanah S, Bouchard L, Jia P, Assadzadeh A, Flanagan J, Schumacher A, Wang SC, Petronis A. Epigenomic profiling reveals DNA-methylation changes associated with major psychosis. Am J Hum Genet. 2008;82:696–711. doi: 10.1016/j.ajhg.2008.01.008. [DOI] [PMC free article] [PubMed] [Google Scholar]
- 20.Dolinoy DC, Jirtle RL. Environmental epigenomics in human health and disease. Environ Mol Mutagen. 2008;49:4–8. doi: 10.1002/em.20366. [DOI] [PubMed] [Google Scholar]
- 21.Suter MA, Aagaard-Tillery KM. Environmental influences on epigenetic profiles. Semin Reprod Med. 2009;27:380–390. doi: 10.1055/s-0029-1237426. [DOI] [PMC free article] [PubMed] [Google Scholar]
- 22.Tohgi H, Utsugisawa K, Nagane Y, Yoshimura M, Genda Y, Ukitsu M. Reduction with age in methylcytosine in the promoter region -224 approximately -101 of the amyloid precursor protein gene in autopsy human cortex. Brain Res Mol Brain Res. 1999;70:288–292. doi: 10.1016/s0169-328x(99)00163-1. [DOI] [PubMed] [Google Scholar]
- 23.Tohgi H, Utsugisawa K, Nagane Y, Yoshimura M, Ukitsu M, Genda Y. The methylation status of cytosines in a tau gene promoter region alters with age to downregulate transcriptional activity in human cerebral cortex. Neurosci Lett. 1999;275:89–92. doi: 10.1016/s0304-3940(99)00731-4. [DOI] [PubMed] [Google Scholar]
- 24.Barrachina M, Ferrer I. DNA methylation of Alzheimer disease and tauopathy-related genes in postmortem brain. J Neuropathol Exp Neurol. 2009;68:880–891. doi: 10.1097/NEN.0b013e3181af2e46. [DOI] [PubMed] [Google Scholar]
- 25.Mastroeni D, Grover A, Delvaux E, Whiteside C, Coleman PD, Rogers J. Epigenetic changes in Alzheimer’s disease: Decrements in DNA methylation. Neurobiol Aging. 2010;31:2025–2037. doi: 10.1016/j.neurobiolaging.2008.12.005. [DOI] [PMC free article] [PubMed] [Google Scholar]
- 26.Mastroeni D, McKee A, Grover A, Rogers J, Coleman PD. Epigenetic differences in cortical neurons from a pair of monozygotic twins discordant for Alzheimer’s disease. PLoS One. 2009;4:e6617. doi: 10.1371/journal.pone.0006617. [DOI] [PMC free article] [PubMed] [Google Scholar]
- 27.Mill J. Toward an integrated genetic and epigenetic approach to Alzheimer’s disease. Neurobiol Aging. 2011;32:1188–1191. doi: 10.1016/j.neurobiolaging.2010.10.021. [DOI] [PubMed] [Google Scholar]
- 28.Chouliaras L, Rutten BP, Kenis G, Peerbooms O, Visser PJ, Verhey F, van Os J, Steinbusch HW, van den Hove DL. Epigenetic regulation in the pathophysiology of Alzheimer’s disease. Prog Neurobiol. 2010;90:498–510. doi: 10.1016/j.pneurobio.2010.01.002. [DOI] [PubMed] [Google Scholar]
- 29.Mastroeni D, Grover A, Delvaux E, Whiteside C, Coleman PD, Rogers J. Epigenetic mechanisms in Alzheimer’s disease. Neurobiol Aging. 2011;32:1161–1180. doi: 10.1016/j.neurobiolaging.2010.08.017. [DOI] [PMC free article] [PubMed] [Google Scholar]
- 30.Loring JF, Wen X, Lee JM, Seilhamer J, Somogyi R. A gene expression profile of Alzheimer’s disease. DNA Cell Biol. 2001;20:683–695. doi: 10.1089/10445490152717541. [DOI] [PubMed] [Google Scholar]
- 31.Miller JA, Oldham MC, Geschwind DH. A systems level analysis of transcriptional changes in Alzheimer’s disease and normal aging. J Neurosci. 2008;28:1410–1420. doi: 10.1523/JNEUROSCI.4098-07.2008. [DOI] [PMC free article] [PubMed] [Google Scholar]
- 32.Hong MG, Myers AJ, Magnusson PK, Prince JA. Transcriptome-wide assessment of human brain and lymphocyte senescence. PLoS One. 2008;3:e3024. doi: 10.1371/journal.pone.0003024. [DOI] [PMC free article] [PubMed] [Google Scholar]
- 33.Pan S, Shi M, Jin J, Albin RL, Lieberman A, Gearing M, Lin B, Pan C, Yan X, Kashima DT, Zhang J. Proteomics identification of proteins in human cortex using multidimensional separations and MALDI tandem mass spectrometer. Mol Cell Proteomics. 2007;6:1818–1823. doi: 10.1074/mcp.M700158-MCP200. [DOI] [PubMed] [Google Scholar]
- 34.Christensen H, Batterham PJ, Mackinnon AJ, Jorm AF, Mack HA, Mather KA, Anstey KJ, Sachdev PS, Easteal S. The association of APOE genotype and cognitive decline in interaction with risk factors in a 65–69 year old community sample. BMC Geriatr. 2008;8:14. doi: 10.1186/1471-2318-8-14. [DOI] [PMC free article] [PubMed] [Google Scholar]
- 35.Bibikova M, Le J, Barnes B, Saedinia-Melnyk S, Zhou LX, Shen R, Gunderson KL. Genome-wide DNA methylation profiling using Infinium (R) assay. Epigenomics. 2009;1:177–200. doi: 10.2217/epi.09.14. [DOI] [PubMed] [Google Scholar]
- 36.Smyth GK. Linear models and empirical bayes methods for assessing differential expression in microarray experiments. Stat Appl Genet Mol Biol. 2004;3:Article3. doi: 10.2202/1544-6115.1027. [DOI] [PubMed] [Google Scholar]
- 37.Subramanian A, Tamayo P, Mootha VK, Mukherjee S, Ebert BL, Gillette MA, Paulovich A, Pomeroy SL, Golub TR, Lander ES, Mesirov JP. Gene set enrichment analysis: A knowledge-based approach for interpreting genome-wide expression profiles. Proc Natl Acad Sci U S A. 2005;102:15545–15550. doi: 10.1073/pnas.0506580102. [DOI] [PMC free article] [PubMed] [Google Scholar]
- 38.Xie X, Lu J, Kulbokas EJ, Golub TR, Mootha V, Lindblad-Toh K, Lander ES, Kellis M. Systematic discovery of regulatory motifs in human promoters and 3′ UTRs by comparison of several mammals. Nature. 2005;434:338–345. doi: 10.1038/nature03441. [DOI] [PMC free article] [PubMed] [Google Scholar]
- 39.Ashburner M, Ball CA, Blake JA, Botstein D, Butler H, Cherry JM, Davis AP, Dolinski K, Dwight SS, Eppig JT, Harris MA, Hill DP, Issel-Tarver L, Kasarskis A, Lewis S, Matese JC, Richardson JE, Ringwald M, Rubin GM, Sherlock G. Gene ontology: Tool for the unification of biology. The Gene Ontology Consortium. Nat Genet. 2000;25:25–29. doi: 10.1038/75556. [DOI] [PMC free article] [PubMed] [Google Scholar]
- 40.Wijsman EM, Daw EW, Yu CE, Payami H, Steinbart EJ, Nochlin D, Conlon EM, Bird TD, Schellenberg GD. Evidence for a novel late-onset Alzheimer disease locus on chromosome 19p13.2. Am J Hum Genet. 2004;75:398–409. doi: 10.1086/423393. [DOI] [PMC free article] [PubMed] [Google Scholar]
- 41.Choufani S, Shapiro JS, Susiarjo M, Butcher DT, Grafodatskaya D, Lou Y, Ferreira JC, Pinto D, Scherer SW, Shaffer LG, Coullin P, Caniggia I, Beyene J, Slim R, Bartolomei MS, Weksberg R. A novel approach identifies new differentially methylated regions (DMRs) associated with imprinted genes. Genome Res. 2011;21:465–476. doi: 10.1101/gr.111922.110. [DOI] [PMC free article] [PubMed] [Google Scholar]
- 42.Ullrich S, Munch A, Neumann S, Kremmer E, Tatzelt J, Lichtenthaler SF. The novel membrane protein TMEM59 modulates complex glycosylation, cell surface expression, and secretion of the amyloid precursor protein. J Biol Chem. 2010;285:20664–20674. doi: 10.1074/jbc.M109.055608. [DOI] [PMC free article] [PubMed] [Google Scholar]
- 43.Siegmund KD, Connor CM, Campan M, Long TI, Weisenberger DJ, Biniszkiewicz D, Jaenisch R, Laird PW, Akbarian S. DNA methylation in the human cerebral cortex is dynamically regulated throughout the life span and involves differentiated neurons. PLoS One. 2007;2:e895. doi: 10.1371/journal.pone.0000895. [DOI] [PMC free article] [PubMed] [Google Scholar]
- 44.Fuso A, Nicolia V, Pasqualato A, Fiorenza MT, Cavallaro RA, Scarpa S. Changes in Presenilin 1 gene methylation pattern in diet-induced B vitamin deficiency. Neurobiol Aging. 2011;32 :187–199. doi: 10.1016/j.neurobiolaging.2009.02.013. [DOI] [PubMed] [Google Scholar]
- 45.Fallin MD, Szymanski M, Wang R, Gherman A, Bassett SS, Avramopoulos D. Fine mapping of the chromosome 10q11–q21 linkage region in Alzheimer’s disease cases and controls. Neurogenetics. 2011;11:335–348. doi: 10.1007/s10048-010-0234-9. [DOI] [PMC free article] [PubMed] [Google Scholar]
- 46.Mosconi L, Tsui W, Murray J, McHugh P, Li Y, Williams S, Pirraglia E, Glodzik L, De Santi S, Vallabhajosula S, de Leon MJ. Maternal age affects brain metabolism in adult children of mothers affected by Alzheimer’s disease. Neurobiol Aging. 2011 doi: 10.1016/j.neurobiolaging.2011.03.003. [DOI] [PMC free article] [PubMed] [Google Scholar]
- 47.Wang SC, Oelze B, Schumacher A. Age-specific epigenetic drift in late-onset Alzheimer’s disease. PLoS One. 2008;3:e2698. doi: 10.1371/journal.pone.0002698. [DOI] [PMC free article] [PubMed] [Google Scholar]
- 48.Jin Z, Liu L, Bian W, Chen Y, Xu G, Cheng L, Jing N. Different transcription factors regulate nestin gene expression during P19 cell neural differentiation and central nervous system development. J Biol Chem. 2009;284:8160–8173. doi: 10.1074/jbc.M805632200. [DOI] [PMC free article] [PubMed] [Google Scholar]
- 49.Pogribny IP, Vanyushin BF. Age-related genomic hypomethylation. In: Tollefsbol TO, editor. Epigenetics of Aging. Springer Science+Business Media, LLC; 2010. pp. 11–27. [Google Scholar]
- 50.Smiraglia DJ, Rush LJ, Fruhwald MC, Dai Z, Held WA, Costello JF, Lang JC, Eng C, Li B, Wright FA, Caligiuri MA, Plass C. Excessive CpG island hyper-methylation in cancer cell lines versus primary human malignancies. Hum Mol Genet. 2001;10:1413–1419. doi: 10.1093/hmg/10.13.1413. [DOI] [PubMed] [Google Scholar]
- 51.Lister R, Pelizzola M, Dowen RH, Hawkins RD, Hon G, Tonti-Filippini J, Nery JR, Lee L, Ye Z, Ngo QM, Edsall L, Antosiewicz-Bourget J, Stewart R, Ruotti V, Millar AH, Thomson JA, Ren B, Ecker JR. Human DNA methylomes at base resolution show widespread epigenomic differences. Nature. 2009;462:315–322. doi: 10.1038/nature08514. [DOI] [PMC free article] [PubMed] [Google Scholar]
- 52.Selkoe DJ. Alzheimer’s disease: Genes, proteins, and therapy. Physiol Rev. 2001;81:741–766. doi: 10.1152/physrev.2001.81.2.741. [DOI] [PubMed] [Google Scholar]
- 53.Akiyama H, Barger S, Barnum S, Bradt B, Bauer J, Cole GM, Cooper NR, Eikelenboom P, Emmerling M, Fiebich BL, Finch CE, Frautschy S, Griffin WS, Hampel H, Hull M, Landreth G, Lue L, Mrak R, Mackenzie IR, McGeer PL, O’Banion MK, Pachter J, Pasinetti G, Plata-Salaman C, Rogers J, Rydel R, Shen Y, Streit W, Strohmeyer R, Tooyoma I, Van Muiswinkel FL, Veerhuis R, Walker D, Webster S, Wegrzyniak B, Wenk G, Wyss-Coray T. Inflammation and Alzheimer’s disease. Neurobiol Aging. 2000;21:383–421. doi: 10.1016/s0197-4580(00)00124-x. [DOI] [PMC free article] [PubMed] [Google Scholar]