

Abstract
MRL mice display unusual healing properties. When MRL ear pinnae are hole punched, the holes close completely without scarring, with re-growth of cartilage, and reappearance of both hair follicles and sebaceous glands. Studies using (MRL/lpr x C57BL/6)F2 and backcross mice first showed that this phenomenon was genetically determined and that multiple loci contributed to this quantitative trait. The lpr mutation itself, however, was not one of them. In the present study, we examined the genetic basis of healing in the Large (LG/J) mouse strain, a parent of the MRL mouse and a strain that shows the same healing phenotype. LG/J mice were crossed with Small (SM/J) mice and the F2 population was scored for healing and their genotypes determined at >200 polymorphic markers. As we previously observed for MRL and (MRL x B6)F2 mice, the wound healing phenotype was sexually dimorphic with female mice healing more quickly and more completely than male mice. We found quantitative trait loci (QTL) on chromosomes (chr) 9, 10, 11, and 15. The heal QTL on chrs 11 and 15 were linked to differential healing primarily in male animals, whereas QTL on chrs 9 and 10 were not sexually dimorphic. A comparison of loci identified in previous crosses with those in the present report using LG/J x SM/J showed that loci on chrs 9, 11 and 15 co-localized with those seen in previous MRL crosses, whereas the locus on chr 10 was not seen before and was is contributed by SM/J.
Introduction
We previously reported that MRL mice are able to completely close ear hole wounds without scarring (Clark et al., 1998), unlike other strains of mice that never close their wounds. This type of wound healing response has also been reported in rabbits and bats (Goss and Grimes, 1975), where such a response has been considered to represent classical epimorphic regeneration. The observed healing also shows similarities with the wound healing response seen in fetal animals after injury (Armstrong and Ferguson, 1995; Hopkinson-Woolley et al., 1994) and in amphibians after limb amputation (Stocum, 1984), exhibiting scarless healing, blastema formation, and the re-growth of various tissues such as cartilage (Clark et al., 1998). Genetic mapping studies of this phenomenon have identified a complex trait with over 20 loci when MRL mice were crossed to C57BL/6 (Blankenhorn et al., 2003; McBrearty et al., 1998) and to other strains such a CAST/Ei (Heber-Katz et al., 2004; Yu et al., 2005) and SJL/J (Masinde et al., 2001).
MRL mice were originally generated from a series of crosses between AKR/J, C3H/HeDi, C57BL/6J, and two final backcrosses of this mixed line with LG/J (Murphy and Roths, 1978). Hence, MRL and LG/J share 75% of their genomes identical by descent. The LG/J mouse, a mouse selected for its large body size (Goodale, 1938), also shows similar healing characteristics to the MRL mouse (Kench et al., 1999; Li et al., 2001). Our interest in the LG/J mouse strain also derives from the wealth of information already gained from existing crosses between LG/J and SM/J mice (Hrbek et al., 2006). SM/J is a strain of mouse selected for its small body size (MacArthur J, 1944). In addition, recombinant inbred strains (Cheverud et al., 2004; Hrbek et al., 2006), as well as AI (advanced intercross) lines (Ehrich et al., 2005; Norgard et al., 2009) from LG/J and SM/J mice have already been generated and studied for other phenotypes and have resulted in the identification of many QTL including a diabetes-modifying gene (Ehrich et al., 2005).
For the mapping studies presented here, we examined ear hole closure in LG/J and SM/J mice and in the F2 intercross populations. We first demonstrate that SM/J mice have healing properties that are similar to B6 mice and confirm that LG/J mice have healing properties similar to MRL mice. The (LG x SM)F2 intercross mice were then subjected to a full genome scan using SNP markers and microsatellite genotyping to fill in regions where SNP coverage was absent. Highly significant quantitative trait loci (QTL) were identified on chr 9; significant loci were identified on chrs 10, 11, and 15. The F2 mice were also measured for body and organ weights. We show that no body and organ QTLs are shared with healing QTLs, although male mice (unlike their female siblings) do exhibit an association between weight and healing. This association was not seen in the (MRL x B6)F2 mice. Finally, haplotype association mapping (HAM) analysis (Burgess-Herbert et al., 2008), combined with global gene expression studies, has provided a narrowed list of candidate genes associated with healing and regeneration.
Materials and Methods
Animals
LG/J and SM/J mice were obtained from the Jackson Laboratories. F1 mice were generated at Washington University, St Louis, MO and F2 crosses were generated at the Wistar Institute, Philaladelphia, PA.
F2 intercross mice were bred from (LG/J x SM/J)F1 males and females (LG granddams, abbreviated LG ♀) or (SM/J x LG/J)F1 male and female parents (SM granddams, or SM ♀), generating a total of 357 mice from crosses using all four parental combinations (birth crosses). The sex ratio in the entire replicate cohort was 185 females and 172 males.
When the mice were 6 weeks old, 2 mm holes were surgically introduced into each ear as previously described (Clark et al., 1998; Li et al., 2001; McBrearty et al., 1998). The residual diameters at 15 and 30 days after ear punching were used as quantitative traits for this study. Holes were measured using a grid-etched reticle (Bausch and Lomb, 7x).
Genetics
DNA samples were prepared from liver tissue collected at time of sacrifice as described (McBrearty et al., 1998). Genome screening of the crosses was carried out using the Illumina Golden Gate Assay and Beadstation. Specifically, the mouse low density linkage panel was used with 377 SNP loci for a theoretical coverage of 4 SNPs per 27 MB. Of the 377 SNPs, 132 were polymorphic (122 for autosomal markers); the remaining markers were microsatellite polymorphisms (Blankenhorn et al., 2003) that were chosen to fill in any gaps remaining after the SNP markers were linked on the genomic map. Thus, for the (LG x SM)F2 intercrosses, a total of 203 markers over 19 autosomes + X were used to assess linkage (see Figure 1 in supplement)
Linkage analysis was carried out using Map Manager QT (Manly and Olson, 1999) and Windows QTL Cartographer (Wang et al., 2009) (see below), and the significance of each linkage was determined by the use of permutation analysis routines in the QT Cartographer program (Wang et al., 2009). In some analyses, cohorts of mice were stratified by such parameters as birth cross or sex and analyzed for the presence of healing QTL using Map Manager QT. Critical values for declaration of significance 9 (Windows QTL Cartographer, model 6) were used to assign levels of confidence in the linkage, depending on α: a significance level for alpha = 0.32 was considered suggestive; alpha = 0.1, strongly suggestive; alpha = 0.05, significant; and alpha = 0.01, highly significant (Churchill and Doerge, 1994). Tests of significant linkage for a QTL are reported as a likelihood ratio test score (LRT) (LRT=~4.6052* logarithm10 of the odds of likelihood of linkage (LOD)). For the traits reported in this study, 1000 permutations of the dataset gave the following estimates of QTL linkage: LRT=19.6 was highly significant, LRT =16.1 is significant, and LRT =14.5 is strongly suggestive for the entire dataset. Values of LRT=20.32,16.87 and 15.08, respectively, were obtained for males and 19.43, 16.65, and 14.78 for females.
Composite interval mapping (CIM; Windows QTL Cartographer, model 6) was then performed on the dataset (Zeng, 1993; Zeng, 1994) to allow for more precise definition of intervals containing QTL. In CIM, markers flanking the test interval are added to the regression model to control for the presence of linked QTL. Additional markers, unlinked to the test interval, but with significant effects on the trait are added to the model to control for the genetic background. The most significant markers unlinked to the test interval are chosen using a linear regression model with a forward/backward selection procedure in Windows QTL Cartographer v. 2.5 (Wang et al., 2009), with a window size of 10 cM and the 5 most significant background markers.
Gene Expression
RNA samples were prepared from day 0 ear holes and from day 7 ear hole donuts from LG/J and SM/J female mice (3mm circular rims formed around the hole punch and containing the blastemas) in triplicate. Day 0 is uninjured and thus, represents the steady-state values for each transcript that might differ between strains. Day 7 was chosen because this day is after the epidermis covers the wound, the basement membrane is broken down in the MRL (first seen on day 5), and increased proliferation and the regeneration blastema begins to form between day 5–7 (Clark et al., 1998; Gourevitch et al., 2003). RNA was extracted using Trizol. RNA quality was assessed by gel electrophoresis and nanodrop analysis and then amplified according to Illumina. Gene expression in the 6 samples was assayed using the Illumina Sentrix Mouse-6 v2. Expression BeadChip (>48,000 probe sequences/array) from an expanded combination of MEEBO oligonucleotides, RIKEN FANTOM sequences, and NCBI RefSeq sequences. Raw intensities and detection p-values were extracted using Illumina Bead Studio v3.0. Arrays were checked for outliers by computing gene-wise between-array median correlation and comparing it with correlation for each array. Arrays were then quantile normalized. Probes were removed from further analysis if their intensity was low (detection p-value > 0.05) relative to background in all samples or if maximum ratio between any 2 samples was not at least 1.2. Microarray data analysis was performed using Matlab v7.2 functions. Differentially expressed genes were determined using ANOVA test with significance level set to 0.05 and fold change threshold of 1.4, calculated as a ratio between medians of two groups of replicates. Borders for the chr 9 intervals were determined from a point-wise estimate of significance on chr 9 with a one-LOD drop from the flanking markers at 55.3MB and 88.6MB. Doing so led to one interval instead of two, such that results in Supplementary Table 1 reflect the first through the last of the differentially expressed genes in the larger interval.. This list of RefSeq genes with their coordinates from particular chromosomal regions was retrieved through UCSC Genome Browser using July 2007 mouse genome assembly.
Haplotype association mapping (HAM)
Single nucleotide polymorphisms (SNPs) reflecting haplotypes of linked genes were compared (Burgess-Herbert et al., 2008) for MRL, LG/J, and C57BL/6J vs. SM/J, SJL/J, and CAST/Ei with the reasoning that these strains were used in crosses with identified QTL that mapped regenerative healing vs. nonhealing (Heber-Katz et al., 2004; Masinde et al., 2001; McBrearty et al., 1998; Yu et al., 2005). Polymorphic genes and gene elements were defined by the detection of SNPS that are categorized as introns, exons or untranslated regions (UTR) by Mouse Phenome Database (www.jax.org/phenome).
Results
The wound healing trait
All LG/J mice quickly and effectively close wounds in their ear pinnae whereas SM/J mice are unable to completely close such wounds (Figure 1). In previous studies, we noted that female mice had significantly better healing than male mice (Blankenhorn et al., 2003). This sexual dimorphism was seen in both parental B6 and MRL/MpJ inbred strains, in F1 hybrids with B6 mothers, in the backcrosses to either parent in which the (MRL x B6)F1 hybrid was the mother, and in all F2 crosses except the original (MRL x B6)F2 (Blankenhorn et al., 2003). There was also significantly better healing in female compared to male mice from at least one cross between MRL and M. castaneus (Heber-Katz et al., 2004) and in SJL females compared to SJL male mice (Yu et al., 2007). For the LG/J mice used in the present study, we found that healing is also sexually dimorphic, and in three of the four parental combinations, F2 females healed significantly better than F2 males (Table 1). Overall, however, there was no significant effect of birth cross on healing in the F2 cohort (Bonferroni-Dunn post-hoc ANOVA, α=0.05; not shown).
Figure 1. Residual wound sizes in female mice from SM/J vs. LG/J inbred strains.
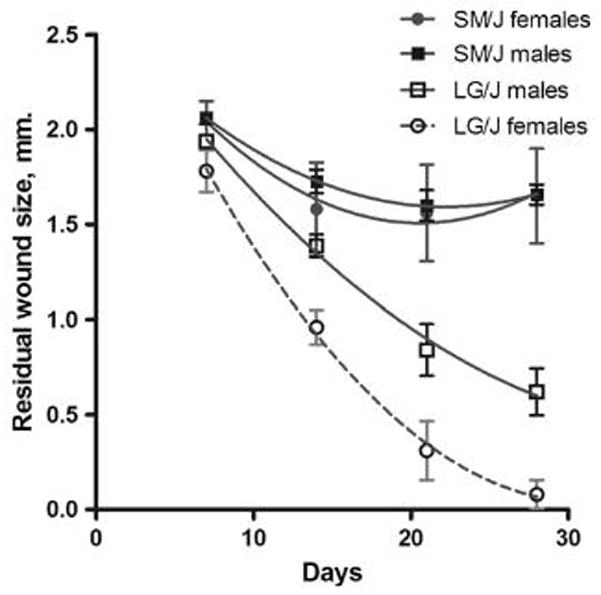
Female SM/J and LG/J mice (5 mice/strain; 2 ear holes/mouse read) at 6 weeks of age were ear punched and hole diameter was read weekly. Wound size between strains is significantly different at all times assessed, p < 0.0001, F = 123.2
Table 1.
Residual wound size (day 30)
| Parental combination | Sex | Mean | S. D. | Count | P value* |
|---|---|---|---|---|---|
| (LG x SM) (LG x SM) F2 | Females | 0.561 | 0.262 | 27 | 0.0014 |
| Males | 0.801 | 0.297 | 36 | ||
| (LG x SM) (SM x LG) F2 | Females | 0.726 | 0.428 | 39 | 0.5393 |
| Males | 0.797 | 0.386 | 31 | ||
| (SM x LG) (LG x SM) F2 | Females | 0.642 | 0.365 | 36 | 0.0019 |
| Males | 0.899 | 0.406 | 36 | ||
| (SM x LG) (SM x LG) F2 | Females | 0.572 | 0.383 | 45 | 0.0007 |
| Males | 0.830 | 0.320 | 35 |
P values are shown for the significance of the sexual dimorphism in each birth cohort.
The distribution of healing of the (LG x SM)F2 population is shown in Figure 2 and is statistically similar to the previous (MRL x B6)F2 population when stratified by sex. The sexual dimorphism of the regeneration trait is also strong in both strain combinations. There was a highly significant correlation between healing at day 15 and at day 30 (F=560, p <0.0001, ANOVA) and this relationship was seen in both males and females (not shown).
Figure 2. Ear hole closure in F2 mice by sex.
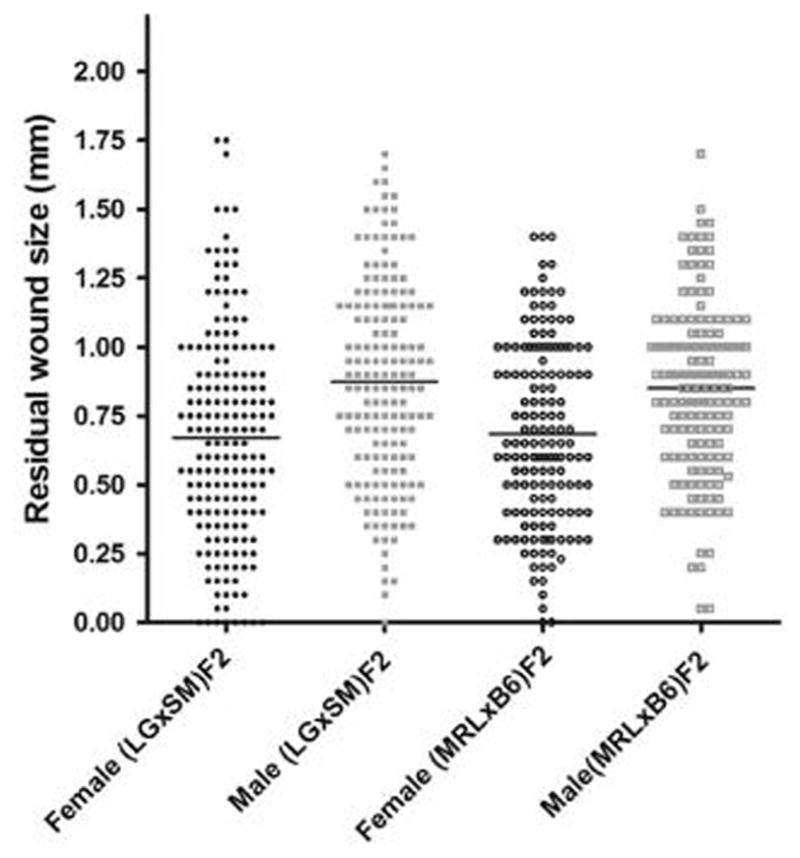
Residual 30-day wound size of (LG x SM)F2 female and male mice (sexually dimorphic, p = <0.001) and (MRL x B6)F2 female and male mice (sexually dimorphic, p = <0.001) (ANOVA with Bonferroni's Multiple Comparison Test). By the same test, females for the two strain combinations were not significantly different, nor were the males.
Body weight and fat is associated with healing in males only
Because both LG and MRL mice are large mice, it is possible that healing is due to the same genetic factors that regulate body size and weight. We therefore examined the relationship between healing and body size in the (LG x SM)F2, where these traits segregate. In the total cross, there was no relationship between healing at day 15 or at day 30 and body weight measured at ten weeks. However, when stratified by sex, we noted that larger F2 males heal better than smaller F2 males (p=0.0002), whereas body weight made no difference in female healing (Figure 3). In males, this relationship of day 30 healing was also seen with organ weight (heart, liver, and kidney, p values of 0.019, 0.001, and 0.0015, respectively) and with abdominal fat weight (p = 0.03), where more fat is associated with better healing. Spleen weight was not associated with healing in any group. None of the QTL linked to healing in males (see below) were linked to the QTL controlling these other traits in males (data not shown). On the other hand, analysis of previous data from an (MRL x B6)F2 cross showed no association with body weight, either female or male (data not shown).
Figure 3. Healing vs. Body Weight.

Regression of healing dependent on 10-wk body weight for female and male (LG x SM)F2 crosses. Healing in males is significantly related to their weight, p = 0.0002.
Mapping of quantitative trait loci linked to the healing phenotype in the F2 population)
Previous mapping studies showed that multiple QTL (heal1 through heal15 plus suggestive loci) control wound healing in the (MRL x B6)F2, [(MRL x B6)F1 x MRL] backcross, and (MRL x CAST/Ei)F2, and multiple QTL (Sth1 through Sth10) were observed in (MRL x SJL)F2 populations (Blankenhorn et al., 2003; Heber-Katz et al., 2004; Li et al., 2001; Masinde et al., 2001; McBrearty et al., 1998). The heal gene nomenclature reported in these publications is annotated in the Mouse Genome Database (http://www.informatics.jax.org/) and will be retained here.
In the (LG x SM)F2 cohort considered as a whole, major loci were identified on chr 9, 10, and 11 that control healing assessed on day 30 (Figure 4). It is likely that chr 9 and chr 10 QTL each contain two peaks as assessed by the composite interval mapping (CIM) method (See supplemental Figures 2 and 3). For clarity, these will be annotated chr 9a and chr 9b, and chr 10a and chr 10b until their identities are known. To determine which of these genes were important early in the process of healing, we also mapped QTL for day 15 healing, and found that these same three QTL were also significantly linked to healing at this early stage, and in addition, a QTL on chr 15 was observed. Finally, a strongly suggestive QTL (heal15) on chr 2 with a peak between 0 −3.8 Mb was seen for day 30.
Figure 4. QTL identified in the (LG x SM)F2 cohort by CIM.

357 F2 progeny were assessed for the trait on day 15 (right) and day 30 (left), submitted to a whole genome scan with the Illumina low-density mouse SNP array plus additional microsatellite genotyping, and the results analyzed with Win QTL Cartographer 2.0, using composite interval mapping. The LRT score is on the Y axis, and positions of genetic markers along the 19 mouse autosomes on the X axis. A horizontal line indicates the LRT=14.5, which is the significance cut-off from suggestive linkage in this cohort. On day 30, there are three major peaks: on mouse chromosome 9 (highly significant by permutation analysis), and on Chr 10, and 11 (significant), and one suggestive QTL on chr 2. On day 15, there is also a significant peak on Chr 15.
Because there is a sexual dimorphism of the healing trait itself, we performed CIM analysis of male and female F2 intercross progeny separately (Figure 5). The highly significant chr 9a and 9b QTL are observed in both male and female QTL linkage plots, but both the chr 10 QTL are suggestively significant only in female mice (Figure 5). Of interest, the chr 10 QTL are significant in both male and female intercross mice for day 15 healing (data not shown). The chr 11 QTL is highly significant in male progeny but not in female progeny. This is consistent with previous mapping of this chr 11 QTL (called heal10), which co-localizes with the present QTL peak and has always had higher significance in male progeny. Thus, it is likely that a chr 11 QTL in the (LG x SM)F2 cross is identical to heal10 (Blankenhorn et al., 2003) and is again a sexually dimorphic QTL in this strain combination. There were no QTL on the X chromosome that contributed to healing in either sex (not shown).
Figure 5. CIM - QTL identified in female and male mice from the (LG x SM)F2 cohort.
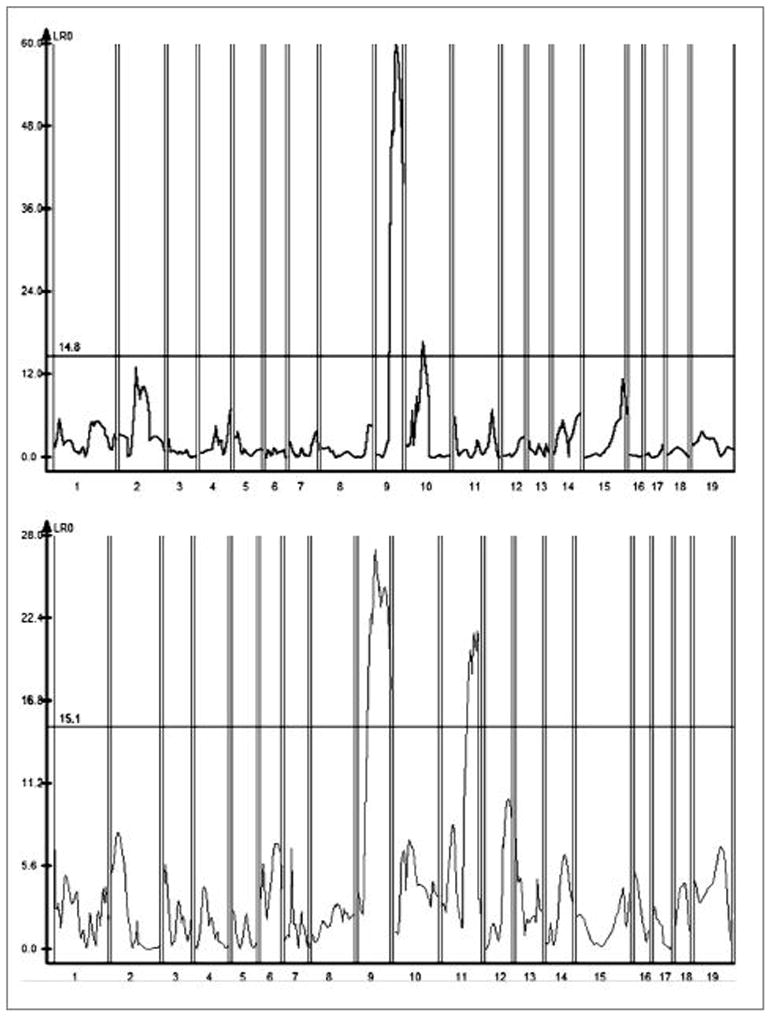
183 female (Left) and 173 male (Right) F2 progeny were assessed for the wound healing trait on day 30. The results are analyzed with WinQTL Cartographer 2.0, using composite interval mapping. LRT score is on the Y axis, and positions of genetic markers along the 19 mouse autosomes on the X axis. For females, peaks are seen on mouse chromosome 9 (highly significant by permutation analysis), and on Chr 10 (significant). For males, two major peaks are seen on chr 9, and 11.
The impact of each individual healing QTL is predicted to be minor, given that quantitative traits are typically due to small, normal differences between alleles of multiple genes. We have calculated the phenotypes associated with inheritance of the most significant QTL in the F2. Wound healing values for mice grouped by inheritance of each QTL were analyzed for significance in male and female F2 cohorts and are shown in Table 2. There was no significant interaction in the total cohort among QTL on Chr 9, 10 or 11 with one another (not shown). However, inheritance of poor-healing alleles (from SM/J) of the heal10 QTL did significantly diminish the healing potential for all male mice, including those with healing alleles derived from LG/J mice on chr 9.
Table 2.
Trait values for healing loci in the (LG x SM)F2.
| QTL peak on chromosomeby sex and allele (L, H, S) | Residual wound size (mm) ± S.D. | Significance comparing | p value | Significant (S) at α = 0.05 | Count |
|---|---|---|---|---|---|
| chr 9 peak #1 at ~60 Mb(9a) | |||||
|
| |||||
| D30 average, F, L | 0.45 ± 0.25 | Het vs. L/L | 0.0038 | SIG | 37 |
| D30 average, F, H | 0.66 ± 0.39 | Het vs. S/S | <.0001 | SIG | 76 |
| D30 average, F, S | 0.93 ± 0.36 | L/L vs. S/S | <.0001 | SIG | 42 |
|
| |||||
| D30 average, M, L | 0.72 ± 0.40 | Het vs. L/L | 0.0441 | 30 | |
| D30 average, M, H | 0.87 ± 0.32 | Het vs. S/S | 0.0003 | SIG | 82 |
| D30 average, M, S | 1.12 ± 0.38 | L/L vs. S/S | <.0001 | SIG | 41 |
|
| |||||
| chr 9 peak #2 at ~90 Mb(9b) | |||||
|
| |||||
| D30 average, F, L | 0.50 ± 0.28 | Het vs. L/L | 0.0286 | 46 | |
| D30 average, F, H | 0.65 ± 0.38 | Het vs. S/S | <.0001 | SIG | 91 |
| D30 average, F, S | 0.95 ± 0.37 | L/L vs. S/S | <.0001 | SIG | 46 |
|
| |||||
| D30 average, M, L | 0.68 ± 0.39 | Het vs. L/L | 0.0014 | SIG | 44 |
| D30 average, M, H | 0.90 ± 0.32 | Het vs. S/S | 0.0245 | 79 | |
| D30 average, M, S | 1.05 ± 0.39 | L/L vs. S/S | <.0001 | SIG | 48 |
|
| |||||
| chr 10 peak #1 at ~48 Mb(10a, heal16) | |||||
|
| |||||
| D30 average, F, L | 0.82 ± 0.38 | Het vs. L/L | 0.1681 | 36 | |
| D30 average, F, H | 0.70 ± 0.38 | Het vs. S/S | 0.0023 | SIG | 72 |
| D30 average, F, S | 0.49 ± 0.31 | L/L vs. S/S | 0.0002 | SIG | 39 |
|
| |||||
| D30 average, M, L | 1.02 ± 0.43 | Het vs. L/L | 0.1100 | 32 | |
| D30 average, M,H | 0.88 ± 0.37 | Het vs. S/S | 0.0346 | 71 | |
| D30 average, M, S | 0.75 ± 0.34 | L/L vs. S/S | 0.0019 | SIG | 28 |
|
| |||||
| chr 10 peak #2 at ~86Mb(10b) | |||||
|
| |||||
| D30 average, F, L | 0.79 ± 0.39 | Het vs. L/L | 0.2978 | 53 | |
| D30 average, F, H | 0.72 ± 0.38 | Het vs. S/S | 0.0020 | SIG | 83 |
| D30 average, F, S | 0.51 ± 0.37 | L/L vs. S/S | 0.0002 | SIG | 47 |
|
| |||||
| D30 average, M, L | 0.93 ± 0.37 | Het vs. L/L | 0.8667 | 44 | |
| D30 average, M, H | 0.92 ± 0.37 | Het vs. S/S | 0.0083 | SIG | 90 |
| D30 average, M, S | 0.73 ± 0.32 | L/L vs. S/S | 0.0142 | SIG | 37 |
|
| |||||
| Chr 11, peak #1 at ~83 Mb (heal10) | |||||
|
| |||||
| D30 average, F, L | 0.58 ± 0.33 | Het vs. L/L | 0.0277 | 46 | |
| D30 average, F, H | 0.74 ± 0.41 | Het vs. S/S | 0.4316 | 96 | |
| D30 average, F, S | 0.68 ± 0.40 | L/L vs. S/S | 0.2444 | 41 | |
|
| |||||
| D30 average, M, L | 0.70 ± 0.34 | Het vs. L/L | 0.0003 | SIG | 46 |
| D30 average, M, H | 0.94 ± 0.41 | Het vs. S/S | 0.4596 | 86 | |
| D30 average, M, S | 0.99 ± 0.30 | L/L vs. S/S | 0.0002 | SIG | 40 |
|
| |||||
| chr 15 peak #1 at ~92 Mb | |||||
|
| |||||
| D15 average, F, L | 1.10 ± 0.34 | Het vs. L/L | 0.7703 | 18 | |
| D15 average, F, H | 1.12 ± 0.29 | Het vs. S/S | 0.0176 | 62 | |
| D15 average, F, S | 0.95 ± 0.23 | L/L vs. S/S | 0.1045 | 22 | |
|
| |||||
| D15 average, M, L | 1.21 ± 0.27 | Het vs. L/L | 0.5450 | 23 | |
| D15 average, M, H | 1.17 ± 0.26 | Het vs. S/S | 0.0127 | SIG | 59 |
| D15 average, M, S | 0.99 ± 0.36 | L/L vs. S/S | 0.0099 | SIG | 21 |
F and M, trait values for female and male F2; L or L/L, H or Het, S or S/S represent the homozygous LG, heterozygous LG/SM, and homozygous SM genotype. Significant differences at the α = 0.05 level by Bonferroni post hoc analysis are designated “SIG”.
Gene expression analysis
LG/J and SM/J female ear tissue from day 0 and from circular blastemas formed around the hole punch on day 7 were analyzed using Illumina beadchip arrays. All genes whose expression is either significantly (p<0.05, ANOVA) up-regulated or down-regulated in LG/J compared to SM/J at 0 days or 7 days by 1.4 fold are presented in Supplementary Table 1, which includes 601 genes within the intervals on chrs 9, 10, 11, and 15. We sought to narrow this list for the major QTL on chr 9a and chr 9b (184 differentially expressed genes) and Figure 6 shows relative expression of the most differentially expressed genes (fold change > 2) from the region.
Figure 6. Genes from both chr 9 QTL that changed 2 fold or more between LG and SM at 0 day or 7 day time point.
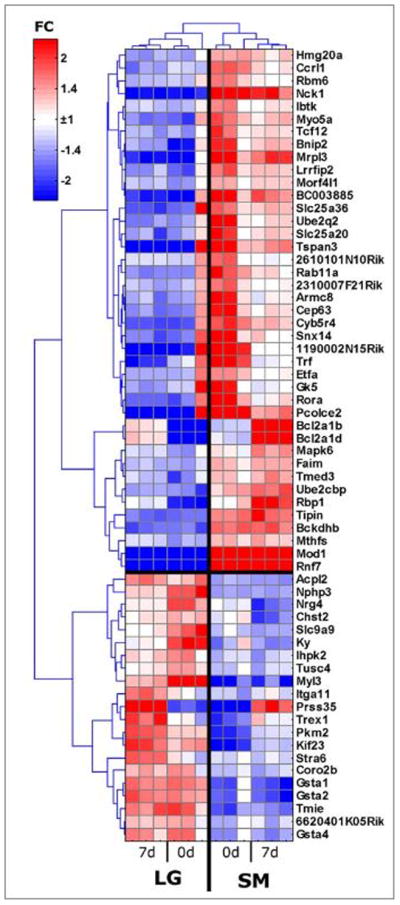
Color of boxes represents relative expression levels with shades of red = high expression, shades of blue=low expression. Three samples (3 mice)/timepoint.
Haplotype Association Mapping (HAM) on chr 9
To narrow the potential candidate genes involved in healing further, we used haplotype association mapping (HAM) analysis of polymorphic QTL candidates that were mapped with significance in the (LG x SM)F2. SNPs reflecting ancestral haplotype blocks of linked genes can be useful for narrowing the polymorphic intervals and the list of possible candidate genes underlying QTL. HAM is more powerful and accurate if only parental strains that have shown linkage to the same QTL region in previous mapping studies (Manenti et al., 2009) are used in the analysis.
Our HAM analysis focuses strictly on the chr 9 QTL that have been seen in this and other crosses. A comparison of healing loci obtained from other crosses and this one shows that there are two likely overlapping QTL: chr 9a with Sth8a and chr 9b with Sth9b (Tables 2 and 3, and see Discussion). Thus, our comparison of SNP haplotypes is based on the assumption that the same, co-localizing chr 9 QTL were seen in crosses between MRL x SJL, MRL x CAST/Ei, and LG x SM but not in MRL x B6 (Table 3). Thus, we set MRL=B6=LG/J as a healing group that is not equal to SM/J, or not equal to the pair, SM/J=SJL/J, or not equal to the trio SM/J=SJL/J=CAST/Ei as non-healing strains in a sequential analysis of polymorphic regions in each paired set.
Table 3.
Presumptive shared QTL for healing on Chr 9, 10, and 11 in six crosses
| Chr | QTL name | Peak Marker | Mb | Cross | Allele origin | Ref |
|---|---|---|---|---|---|---|
| 9 | Sth8 | D9Mit207 | 60.4 | MRL x SJL | MRL | (Masinde et al., 2001) |
| 9 | Sth9 | D9Mit270 | 75.9 | MRL x SJL | MRL | (Masinde et al., 2001) |
| 9 | Sth8 a | 61.9 | MRL x SJL | MRL | (Yu et al., 2007) | |
| 9 | Sth9 a | 87.3 | MRL x SJL | MRL | (Yu et al., 2007) | |
| 9 | Sth9 b | 94.7 | MRL x SJL | MRL | (Yu et al., 2007) | |
| 9 | Heal14/Sth9 | D9Mit182 | 101.4 | MRL x CAST/Ei | Het, F>M | (Heber-Katz et al., 2004) |
| 9 | Sth8 b | D9Mit129 | 43.7 | MRL x CAST/Ei | MRL | (Yu et al., 2005) |
| 9 | Sth9 b | D9Mit355 | 98.7 | MRL x CAST/Ei | MRL | (Yu et al., 2005) |
| 9 | Chr 9a/Sth8a | D9Mit207 | 60 | LG x SM | LG | current |
| 9 | Chr 9b/Sth9b | rs13480313/D9Mit12 | 85–98 | LG x SM | LG | current |
| 10 | Heal 16 | D10Mit170 | 48 | LGXSM | SM | current |
| 10 | Chr 10b | rs8258353 | 86 | LGXSM | SM | current |
| 11 | Heal10 | D11Mit213 | 94.4 | MRL x B6 | MRL, M>F | (Blankenhorn et al., 2003) |
| 11 | Heal10 | D11Mit100 | 110 | MRL x CAST/Ei | MRL, M>F | (Heber-Katz et al., 2004) |
| 11 | Heal10 | D11Mit101/D11Mit 122 | 83–92 | LG x SM | LG/J, M>F | current |
| 15 | Heal4 | D15Mit189 | 82.5 | MRL x B6 | MRL | (McBrearty et al., 1998) |
| 15 | Heal4? | rs13482628/D15Mit66 | 68–69 | LG x SM | SM/J,M>F (d 15) | current |
Designations are presented as found in the references (right column), except for QTL designated Sth8 and Sth9, where (a) and (b) are added to distinguish QTL that have been separated by subsequent analysis (Yu et al., 2007).
Approximately 375 genes and genetic entities (as defined in the Mouse Genome Informatics Database: www.informatics/jax/org) and 8 microRNAs exist in the interval between 55 Mb and 105 Mb on chr 9, as identified using Biomart (http://www.ensembl.org/biomart). The HAM result using the healer set (MRL=B6=LG) vs. SM/J non-healer narrowed this list of genes bearing polymorphic UTR, intronic or exonic SNPs to 134 genes and unidentified but conserved cDNA transcripts and two microRNAs in the entire region from 55–105 Mb of mouse chr 9 (Table 4, column A). A further narrowing of the list by the inclusion of SJL/J as a non-healer (SM/J=SJL/J) in the HAM search for polymorphic genes resulted in 87 candidate genes for the large overlapping 9a/Sth8a and 9b/Sth9b intervals (Table 4, column B). Further narrowing occurred when CAST/Ei was included as a non-healer (SM/J=SJL/J=CAST). Because only the 9b/Sth9b QTL was identified in the CAST/Ei cross, the HAM analysis was only done for 9b/Sth9b (with a cutoff of 72.3 -105 Mb) and this resulted in 32 genes (Table 4, column C).
Table 4.
Haplotype association mapping (HAM) under three different genotypic criteria, correlated with expression differences in healing tissue
| # | QTL | Mb | HAM-A | B | C | Ratio | Exp | Max expr |
|---|---|---|---|---|---|---|---|---|
| 1 | 9a | 55.40 | Zfp291 | 1.46 | 579.6 | |||
| 2 | 9a | 55.81 | 4930563M21Rik | ne | ||||
| 3 | 9a | 55.89 | Rcn2 | ne | ||||
| 4 | 9a | 58.50 | 2410076I21Rik | 142.9 | ||||
| 5 | 9a | 59.50 | Pkm2 | 2.79 | 21038.5 | |||
| 6 | 9a | 59.53 | 4933407I18Rik | ne | ||||
| 7 | 9a | 59.55 | Gramd2 | 112.5 | ||||
| 8 | 9a | 60.83 | A430102L10 | |||||
| 9 | 9a | 61.22 | Tle3 | −1.68 | 468.7 | |||
| 10 | 9a | 61.32 | LOC100039851 | |||||
| 11 | 9a | 61.76 | Rplp1 | + | + | 54788.3 | ||
| 12 | 9a | 61.76 | Kif23 | + | 3.52 | 2215.7 | ||
| 13 | 9a | 61.80 | Paqr5 | + | + | 275.7 | ||
| 14 | 9a | 61.90 | Glce | + | 1174.8 | |||
| 15 | 9a | 62.19 | Anp32a | + | + | 1973.0 | ||
| 16 | 9a | 62.27 | Coro2b | + | 2.09 | 323.4 | ||
| 17 | 9a | 63.27 | Iqch | + | ne | |||
| 18 | 9a | 63.45 | 2310007F21Rik | + | −2.25 | 2070.5 | ||
| 19 | 9a | 63.49 | Smad3 | 1.42 | 1791.5 | |||
| 20 | 9a | 64.23 | Megf11 | + | ne | |||
| 21 | 9a | 66.62 | Aph1b | −1.71 | 1001.8 | |||
| 22 | 9a | 66.69 | Rab8b | + | 5550.2 | |||
| 23 | 9a | 66.79 | Rps27l | + | 25637.7 | |||
| 24 | 9a | 66.80 | Lactb | |||||
| 25 | 9a | 66.87 | Tpm1 | + | 1.71 | 8248.0 | ||
| 26 | 9a | 67.06 | Tln2 | 1.56 | 452.5 | |||
| 27 | 9a | 67.41 | LOC100040253 | |||||
| 28 | 9a | 67.69 | Vps13c | + | 145.4 | |||
| 29 | 9a | 68.50 | Rora | + | −5.22 | 4912.7 | ||
| 30 | 9a | 69.94 | 6430514L14Rik | + | + | 316.4 | ||
| 31 | 9a | 70.05 | Myo1e | + | 1.80 | 2973.9 | ||
| 32 | 9a | 70.25 | Ccnb2 | + | ne | |||
| 33 | 9a | 70.27 | Rnf111 | + | 153.1 | |||
| 34 | 9a | 70.64 | Lipc | + | ne | |||
| 35 | 9a | 70.96 | Aqp9 | + | 2059.5 | |||
| 36 | 9a | 71.32 | Grinl1a | + | ne | |||
| 37 | 9a | 71.35 | AA407270 | + | + | 545.8 | ||
| 38 | 9a | 71.47 | Cgnl1 | + | 127.3 | |||
| 39 | 9a | 71.69 | Tcf12 | + | −2.33 | 1117.0 | ||
| 40 | 9a | 72.02 | EG665964 | + | ||||
| 41 | 9a | 72.12 | Suhw4 | + | 703.7 | |||
| 42 | 9a | 72.24 | LOC100041760 | + | ||||
| 43 | 9a | 73.96 | Wdr72 | + | ne | |||
| 44 | 9a | 74.71 | Onecut1 | + | ||||
| 45 | 9a | 74.82 | BC031353 | + | + | 2975.9 | ||
| 46 | 9a | 74.88 | Arpp19 | + | + | 2084.2 | ||
| 47 | 9a | 74.91 | LOC100040812 | |||||
| 48 | 9a | 74.92 | Myo5a | + | −3.05 | 1001.9 | ||
| 49 | 9a | 75.07 | Myo5c | 122.6 | ||||
| 50 | 9a | 75.16 | Gnb5 | + | + | 564.5 | ||
| 51 | 9a | 74.09 | Mapk6 | + | −2.07 | 2657.4 | ||
| 52 | 9b | 75.62 | Bmp5 | + | + | −1.96 | 384.9 | |
| 53 | 9b | 75.86 | Hmgcll1 | + | + | ne | ||
| 54 | 9b | 76.01 | Gfral | + | + | ne | ||
| 55 | 9b | 76.07 | Hcrtr2 | + | + | ne | ||
| 56 | 9b | 76.95 | 2310046A06Rik | + | + | + | 430.1 | |
| 57 | 9b | 77.21 | 5730403I07Rik | ne | ||||
| 58 | 9b | 77.28 | Lrrc1 | −1.52 | 2150.5 | |||
| 59 | 9b | 78.24 | LOC100042356 | |||||
| 60 | 9b | 78.29 | Mto1 | 1.59 | 591.7 | |||
| 61 | 9b | 78.38 | Slc17a5 | 555.6 | ||||
| 62 | 9b | 78.46 | Cd109 | 1804.7 | ||||
| 63 | 9b | 79.44 | Col12a1 | 1.52 | 2761.2 | |||
| 64 | 9b | 79.66 | Filip1 | ne | ||||
| 65 | 9b | 80.16 | Impg1 | + | + | ne | ||
| 66 | 9b | 83.67 | Elovl4 | + | + | 46705.1 | ||
| 67 | 9b | 83.83 | Bckdhb | −3.27 | 2458.6 | |||
| 68 | 9b | 85.67 | EG434426 | + | ||||
| 69 | 9b | 85.72 | 9330154J02Rik | 123.5 | ||||
| 70 | 9b | 86.20 | 2610018I03Rik | + | −2.59 | 396.8 | ||
| 71 | 9b | 86.38 | Dopey1 | + | ne | |||
| 72 | 9b | 86.44 | Pgm3 | + | + | 159.9 | ||
| 73 | 9b | 86.47 | Mod1 | + | −38.78 | 3640.8 | ||
| 74 | 9b | 86.66 | Snap91 | + | + | 109a | ||
| 75 | 9b | 87.04 | LOC244958 | + | ||||
| 76 | 9b | 87.08 | 4922501C03Rik | + | + | 240.0 | ||
| 77 | 9b | 87.60 | Tbx18 | + | 102.5 | |||
| 78 | 9b | 88.17 | EG272633 | |||||
| 79 | 9b | 89.48 | AF529169 | + | ne | |||
| 80 | 9b | 89.59 | Tmed3 | + | −2.32 | 2047.6 | ||
| 81 | 9b | 88.22 | Nt5e | −1.64 | 3408.3 | |||
| 82 | 9b | 89.62 | B230218L05Rik | + | ne | |||
| 83 | 9b | 89.80 | Rasgrf1 | + | + | 1.80 | 236.6 | |
| 84 | 9b | 90.10 | Tbc1d2b | + | + | 1878.2 | ||
| 85 | 9b | 91.26 | Zic4 | + | 104.3 | |||
| 86 | 9b | 92.09 | LOC331000 | + | + | 112.2 | ||
| 87 | 9b | 92.14 | Plscr1 | + | + | −1.49 | 274.4 | |
| 88 | 9b | 92.20 | 1700057G04Rik | + | 96.4 | |||
| 89 | 9b | 92.44 | Plod2 | + | + | −1.52 | 388.9 | |
| 90 | 9b | 92.61 | LOC100039944 | + | ||||
| 91 | 9b | 94.46 | EG667601 | + | ||||
| 92 | 9b | 94.57 | Slc9a9 | + | + | 2.60 | 1517.8 | |
| 93 | 9b | 95.36 | 2610101N10Rik | + | + | −2.29 | 3362.8 | |
| 94 | 9b | 95.61 | Trpc1 | + | −1.61 | 133.3 | ||
| 95 | 9b | 95.65 | AI427122 | + | + | 1.90 | 388.8 | |
| 96 | 9b | 95.85 | Xrn1 | + | + | 163.8 | ||
| 97 | 9b | 96.10 | Tfdp2 | + | + | 1.68 | 394.4 | |
| 98 | 9b | 96.58 | Zbtb38 | 1.64 | 255.6 | |||
| 99 | 9b | 96.23 | Atp1b2 | + | 2.18 | 493.2 | ||
| 100 | 9b | 96.84 | Spsb4 | + | + | + | 161.3 | |
| 101 | 9b | 97.34 | Clstn2 | + | + | ne | ||
| 102 | 9b | 97.37 | Rnf7 | + | + | −53.98 | 5582.5 | |
| 103 | 9b | 98.20 | Nmnat3 | + | 121.9 | |||
| 104 | 9b | 98.39 | Rbp2 | + | + | 1.79 | 2968.3 | |
| 105 | 9b | 98.91 | Gm1123 | 116.3 | ||||
| 106 | 9b | 98.94 | Pik3cb | 1334.2 | ||||
| 107 | 9b | 99b1 | D9Ertd280e | + | + | + | 2291.6 | |
| 108 | 9b | 99b9 | Mras | −1.49 | 1646.8 | |||
| 109 | 9b | 99.38 | Armc8 | + | −3.27 | 910.0 | ||
| 110 | 9b | 99.59 | Cldn18 | ne | ||||
| 111 | 9b | 99.92 | 4930519F24Rik | ne | ||||
| 112 | 9b | 100.36 | Il20rb | + | −1.70 | 2550.8 | ||
| 113 | 9b | 100.39 | Nck1 | + | −6.88 | 2174.7 | ||
| 114 | 9b | 100.45 | Tmem22 | + | −1.64 | 174.5 | ||
| 115 | 9b | 100.54 | Stag1 | + | + | + | 1318.6 | |
| 116 | 9b | 100.88 | Pccb | + | + | −1.55 | 1262.6 | |
| 117 | 9b | 101.00 | 3222402P14Rik | + | + | −1.61 | 217.6 | |
| 118 | 9b | 101.82 | Ephb1 | 1.49 | 211.3 | |||
| 119 | 9b | 101.84 | 9630041A04Rik | 103.8 | ||||
| 120 | 9b | 102.41 | Ky | 3.11 | 1632.6 | |||
| 121 | 9b | 102.49 | Cep63 | + | −3.63 | 2468.2 | ||
| 122 | 9b | 102.91 | Slco2a1 | 1.43 | 977.4 | |||
| 123 | 9b | 103.01 | Rab6b | + | + | 102.4 | ||
| 124 | 9b | 103.09 | Srprb | 1.60 | 1415.2 | |||
| 125 | 9b | 103.11 | Trf | + | + | −2.89 | 19114.9 | |
| 126 | 9b | 103.15 | 1300017J02Rik | + | + | + | 171.5 | |
| 127 | 9b | 103.21 | Topbp1 | + | + | ne | ||
| 128 | 9b | 103.25 | Cdv3 | + | + | −1.42 | 5510.1 | |
| 129 | 9b | 103.33 | Bfsp2 | + | + | 97.4 | ||
| 130 | 9b | 103.39 | Tmem108 | ne | ||||
| 131 | 9b | 103.90 | Nphp3 | 2.92 | 320.4 | |||
| 132 | 9b | 103.95 | Ube1dc1 | + | 3044.2 | |||
| 133 | 9b | 104.47 | Cpne4 | + | + | 108.5 | ||
| 134 | 9b | 104.95 | Mrpl3 | + | −6.59 | 2286.6 |
Abbreviations: Mb, position of the gene in megabases; A, genes that are B6=MRL=LG ≠ SM (55–105Mb interval); B, genes that are B6=MRL=LG ≠ SM=SJL (55–105Mb interval); C, genes that are B6=MRL=LG ≠ SM=SJL=CAST (75–105Mb interval); Ratio, shows fold change LG/SM if the gene is significantly differentially expressed; Exp., 20 genes that are expressed > 2-fold over background levels (>160) and yet show less than 30% difference between LG and SM; Max expr., maximum expression level for the
We next compared these polymorphic gene candidates from the HAM analysis with the differentially expressed genes (Supplementary Table 1 and Figure 6). When the 134 genes identified when MRL, B6 and LG were considered together and compared to SM, 52 of these were differentially expressed genes (Table 4, column “ratio”). When SJL was added as a non-healer, 33 differentially expressed genes were identified. And finally, when CAST/Ei as a non-healer was added for the chr 9b/Sth9b locus, we identified 23 differentially-expressed genes (Table 4). Overall, 23 genes both reside in polymorphic blocks of the genome and are differentially expressed by LG and SM. Genes that were actively transcribed but not differentially expressed in this multiple locus interval were also noted, as they could underlie the QTL because of their amino acid polymorphisms in candidate genes that could cause healing differences without affecting RNA expression levels. There are 20 genes that are transcribed at 2-fold or more background expression levels and exhibit less than 30% change in expression between LG and SM mice (Table 4).
Discussion
LG/J and SM/J mice have been examined for size, propensity for obesity and for autoimmunity (Cheverud et al., 2004; Kramer et al., 1998). LG/J mice have been reported to show unusual healing properties similar to that seen in the MRL mouse (Kench et al., 1999; Li et al., 2001), of which it is a parent strain (Murphy and Roths, 1978). In this study, we determine that SM/J mice of both sexes show poor relative closure of ear wounds. We crossed LG/J to SM/J mice and identified multiple loci that are genetically linked to the ear hole closure response, a response to injury that shows regenerative healing. There were healing QTL identified by composite interval mapping located on three chromosomes 9, 10, and 11 that control day 30 healing in this strain combination. The two QTL on chr 9 have been previously observed (Sth8a and Sth9b, see below) and are remarkably strong QTL in this strain combination. A broad area of linkage likely containing two QTL was observed on chr 10 for healing measured on days 15 and 30. Better healing due to this QTL is seen in mice carrying two alleles from SM/J. Day 15 healing was also regulated by these three significant QTL and in addition, there was a clear significant linkage to a chr 15 QTL.
A Comparison of MRL and LG healing loci
Previous studies have identified ear hole closure QTL using global microsatellite mapping employed F2 and backcrosses between MRL and multiple non-healer parental lines including B6, SJL, and CAST/Ei. A summary of the loci shared among these crosses and the LG/J x SM/J cross studied here is presented In Table 3. As noted above, two QTL on chr 9 have been observed in multiple crosses, and in four studies, the healing allele is derived from the healing mouse strain (i.e., MRL or LG). Two QTL on chr 9 were first identified in an (MRL x SJL) cross at 60 (Sth8) and 76 Mb (Sth9) (Masinde et al., 2001). These were further refined and subdivided in a larger cross into 3 QTL using Bayesian shrinkage analysis: one co-localizing with Sth8 (which for the sake of clarity, we will designate “Sth8a”) at 62 Mb, and two QTL at 87Mb and 95Mb (in the region of the former Sth9, which we will designate “Sth9a” and “Sth9b”) (Yu et al., 2007). In an (MRL x CAST/Ei)F2 cross, a chr 9 QTL appeared in females only at 101 Mb (Heber-Katz et al., 2004), which may be equivalent to Sth9b. An earlier study using the same cross showed QTL at 44Mb (originally designated as “Sth8”, this could be called “Sth8b”, to distinguish it from Sth8a at 60 Mb) and another QTL at 99 Mb, presumably equivalent to Sth9b (Yu et al., 2005). In the present cross, two highly significant loci with peaks at 60Mb (chr 9a, presumably equivalent to Sth8a) and 90–92 Mb (chr 9b, presumably equivalent to Sth9b) were identified. It is likely, then, that LG/J mice carry the same alleles as MRL for Sth8a and Sth9b (Table 3). It is likely that LG/J mice also carry an MRL-like allele at Sth9a. An SJL.MRL chr 9 interval-specific substitution congenic was generated based on these linkages, which demonstrated somewhat better healing than SJL but only in males (Yu et al., 2007). In the current study, the QTL on chr 9 showed no sexual dimorphism.
The QTL on chr 10 from the LG x SM cross (Table 2) have not been mapped in any MRL cross; healing alleles for both are derived from SM/J. The stronger QTL will be called heal16. A separate QTL (10b) at ~85 Mb is also seen in this cross. A QTL on chr 11 was previously identified in males in the MRL x B6 cross at 94 Mb (heal10) (Blankenhorn et al., 2003), in the MRL x CAST/Ei cross at 110 Mb (Heber-Katz et al., 2004)), and these are likely to be the same QTL as in the present LG x SM cross at 83–92 Mb. In the current study, while the heal10 peak is between 88 and 92 Mb, significant linkage is detected in males out to the second most distal marker on chr 11 (rs3710148 at 102 Mb). This QTL has significant linkage to healing in males on both day 15 and 30 in this cross, as has been seen in the previous studies.
A QTL on chr 15 was mapped in the present LG x SM cross at 92 Mb, which might be the same as the QTL heal4 identified in the original map of healing using an MRL x B6 cross (McBrearty et al., 1998). However, in the present cross, the chr 15 linkage is only seen on day 15, with a peak at 92Mb, and the healing phenotype is contributed by the SM/J allele. This may or may not be identical, therefore, to the original heal4.
Finally, a suggestive QTL (heal15) on chr 2 with a peak between 0 - 3.8 Mb was identified in an MRL x CAST/Ei cross (Heber-Katz et al., 2004). This was significant in the whole F2 population but not in males or females alone. It was also seen only in mice heterozygous at this locus. In the LG x SM cross, a suggestive QTL on chr 2 is seen at approximately the same location.
Sexual Dimorphism
We have previously shown in the MRLxB6 crosses and in the parental strains that female mice display better healing in terms of ear hole closure than males. This was also found to be true in (MRL x CAST/Ei) crosses and (MRL x SJL) crosses. A recent study examining joint cartilage regeneration in MRL and B6 mice showed a sexually dimorphic response in the other direction, where only males displayed cartilage regeneration (Fitzgerald et al., 2008). Based on previous mapping studies, we expected to find in the current analysis at least one healing QTL that was sexually dimorphic. In fact, heal10 on chr 11 shows significant influence only in mice of one sex (males) (Table 2). The CIM analysis of male at day 15 showed a significant healing QTL on chr 15; this QTL did not achieve significance but was present in females at this stage (not shown).
Size and Healing
A comparison of healing and body weight showed a positive correlation in F2 male mice. This was not seen in female mice or in the population assessed as a whole. The LG x SM cross used in this study has been the focus of genetic mapping studies by the Cheverud laboratory for multiple phenotypes including body size (Cheverud et al., 2004). It has been shown that LG/J male mice show more rapid growth during the first 10 weeks than LG/J female and SM/J mice and that this may be caused by increased levels of IGF and growth hormone (Ehrich et al., 2003). One possible explanation for our result is that a growth-related gene involved in early LG/J male growth is involved in healing and may be a sexually dimorphic gene. Thus, a likely candidate would be the chr 11 heal10 locus, which is mainly Influential in males and contributed by LG/J. However, heal10 showed no influence on any of the body or organ weight traits in male mice (not shown). Notably, when the relationship of size and healing was examined in an MRL x B6 cross, no such association was seen.
Candidate genes
A sequential HAM analysis has allowed us to narrow the list of candidate genes in the large, overlapping chr 9 intervals we designated 9a (likely identical to Sth8a) and 9b (Sth9b) (Table 3 and 4). First, polymorphic regions in introns, exons and 5’ UTR in the interval containing both 9a/Sth8a and 9b/Sth9b were examined, and we sequentially identified those SNP blocks that had an appropriate strain distribution pattern for the five strains. We then narrowed this list further by selecting genes that were differentially expressed between LG and SM. This intersection of candidates identified by the two approaches resulted in a final list of 23 candidate genes, many of which have already been identified in regenerative systems: Kif23, Coro2B, 231007F21Rik, Rora, Tpm1, Myo1e, Tcf12, Myo5a, and Mapk6 in the 9a/Sth8a QTL; and Bmp5, Rasgrf1, Plscr1, Plod2, Slc9a9, 2610101N10RIK, AI427122 (pls1), Tfdp2, Rnf7, Rbp2, Pccb, 3222402P14RIK (Ppp2r3a), Trf, and Cdv3 in the 9b/Sth9b QTL.
Among the candidates for the 9a/Sth8a QTL, there are numerous genes involved in microtubule-actin interactions involved in morphogenesis and cell migration, potentially key molecules in wound healing and regeneration (Rodriguez et al., 2003). Four such genes are up-regulated in LG healing tissue, including Kif23, a kinesin-like family member and motor protein which drives organelle movement and completion of cytokinesis (Rodriguez and Cheney, 2002); Coro2B, also known as ClipinC, a coronin protein involved in actin binding, assembly, and crosslinking (Nakamura et al., 1999); and Myo1e, a class I myosin that interacts with actin, and has been reported to be involved in endocytosis and podocyte formation (Krendel et al., 2007). Tpm1 encodes tropomyosin, which is an actin-binding protein that plays an important role in regulating the cytoskeleton (Gunning et al., 2008). Myo5a, which is down regulated in LG/J, forms complexes with kinesins to coordinate organelle movement along microtubules (Huang et al., 1999; Krendel et al., 2007).
Down-regulation of three other molecules in 9a/Sth8a are consistent with reduced muscle and chondrocyte differentiation. TCF12 is a bHLH transcription factor expressed in muscle and thought to be involved in lineage specific gene expression (Zhao and Hoffman, 2004) and Mapk6 or ERK3 is a Ser/Thr kinase localized to the nucleus and accumulates during muscle differentiation. Rora is an retinoid-related orphan receptor and has been reported to be involved in chrondrocyte differentiation and a negative regulator of inflammation (Delerive et al., 2001; Woods et al., 2009).
In the 9b/Sth9b locus, there are several genes involved with development and wound healing. These include Bmp5, which has been shown to be involved in chondrogenesis and muscle and bone development (Guenther et al., 2008; Reber-Muller et al., 2006), and is down regulated in LG/J, potentially inhibiting premature formation of cartilage and muscle. Also, Plod2 (procollagen lysine, 2-oxoglutarate 5-dioxygenase 2 or LH2) is a membrane-bound enzyme which hydrolyzes collagen allowing cross-linking and is important in the formation of scar tissue (Ulrich et al., 2007); this is down regulated in LG/J which could allow growth over scarring. Rbp-2 retinol (Vitamin A) binding protein (also known as crbp-2 or crbpII) is involved with cell cycle control and is down regulated in chick limb development (Maden et al., 1989; Roesch et al., 2006). It is upregulated in healing tissue from LG/J mice and may lead to increased levels of available retinol for RA synthesis.
It will also be important to consider activated genes that are similar in expression levels between LG and SM but may be different in function due to sequence differences in primary structure or regulatory regions. These are represented in Table 4 and will be more extensively analyzed when the interval is further narrowed.
Conclusion
Many genes found in the QTL described here are of potential interest and may play a role in wound healing and regeneration. At present, studies examining gene expression and fine mapping of recombinant inbred lines derived from LG/J x SM/J and advanced intercross lines are underway.
Supplementary Material
Acknowledgments
These studies were supported by a grant from NIH, NIGMS GM073226, a grant from the Commonwealth of Pennsylvania, and an NCI Cancer Center Grant (P30 CA10815) to the Wistar Institute. These studies were also supported by the Genomics and Animal Wistar Core Facilities. We thank Abhishek Kulkarni for his help in the linkage analysis.
Contributor Information
Elizabeth P. Blankenhorn, Email: eblanken@drexelmed.edu, Department of Microbiology and Immunology, Drexel University, College of Medicine, 2900 Queen Lane, Philadelphia PA 19129.
Gregory Bryan, Department of Microbiology and Immunology, Drexel University, College of Medicine, 2900 Queen Lane, Philadelphia PA 19129.
Andrew V. Kossenkov, The Wistar Institute, 3601 Spruce Street, Philadelphia, Pennsylvania, 19104, USA
Lise Desquenne Clark, The Wistar Institute, 3601 Spruce Street, Philadelphia, Pennsylvania, 19104, USA.
Xiang-Ming Zhang, The Wistar Institute, 3601 Spruce Street, Philadelphia, Pennsylvania, 19104, USA.
Celia Chang, The Wistar Institute, 3601 Spruce Street, Philadelphia, Pennsylvania, 19104, USA.
Wenhwai Horng, The Wistar Institute, 3601 Spruce Street, Philadelphia, Pennsylvania, 19104, USA.
L. Susan Pletscher, Department of Anatomy & Neurobiology, Washington University School of Medicine, 660 S. Euclid Avenue, St. Louis, MO 63110.
James M. Cheverud, Email: cheverud@wustl.edu, Department of Anatomy & Neurobiology, Washington University School of Medicine, 660 S. Euclid Avenue, St. Louis, MO 63110
Louise Showe, The Wistar Institute, 3601 Spruce Street, Philadelphia, Pennsylvania, 19104, USA.
Ellen Heber-Katz, Email: heberkatz@wistar.upenn.edu, The Wistar Institute, 3601 Spruce Street, Philadelphia, Pennsylvania, 19104, USA.
References
- Armstrong JR, Ferguson MW. Ontogeny of the skin and the transition from scar-free to scarring phenotype during wound healing in the pouch young of a marsupial, Monodelphis domestica. Dev Biol. 1995;169:242–260. doi: 10.1006/dbio.1995.1141. [DOI] [PubMed] [Google Scholar]
- Blankenhorn EP, Troutman S, Clark LD, Zhang XM, Chen P, Heber-Katz E. Sexually dimorphic genes regulate healing and regeneration in MRL mice. Mamm Genome. 2003;14:250–260. doi: 10.1007/s00335-002-2222-3. [DOI] [PubMed] [Google Scholar]
- Burgess-Herbert SL, Cox A, Tsaih SW, Paigen B. Practical applications of the bioinformatics toolbox for narrowing quantitative trait loci. Genetics. 2008;180:2227–2235. doi: 10.1534/genetics.108.090175. [DOI] [PMC free article] [PubMed] [Google Scholar]
- Cheverud JM, Ehrich TH, Hrbek T, Kenney JP, Pletscher LS, Semenkovich CF. Quantitative trait loci for obesity- and diabetes-related traits and their dietary responses to high-fat feeding in LGXSM recombinant inbred mouse strains. Diabetes. 2004;53:3328–3336. doi: 10.2337/diabetes.53.12.3328. [DOI] [PubMed] [Google Scholar]
- Churchill GA, Doerge RW. Empirical threshold values for quantitative trait mapping. Genetics. 1994;138:963–971. doi: 10.1093/genetics/138.3.963. [DOI] [PMC free article] [PubMed] [Google Scholar]
- Clark LD, Clark RK, Heber-Katz E. A new murine model for mammalian wound repair and regeneration. Clin Immunol Immunopathol. 1998;88:35–45. doi: 10.1006/clin.1998.4519. [DOI] [PubMed] [Google Scholar]
- Delerive P, Monte D, Dubois G, Trottein F, Fruchart-Najib J, Mariani J, Fruchart JC, Staels B. The orphan nuclear receptor ROR alpha is a negative regulator of the inflammatory response. EMBO Rep. 2001;2:42–48. doi: 10.1093/embo-reports/kve007. [DOI] [PMC free article] [PubMed] [Google Scholar]
- Ehrich TH, Kenney JP, Vaughn TT, Pletscher LS, Cheverud JM. Diet, obesity, and hyperglycemia in LG/J and SM/J mice. Obes Res. 2003;11:1400–1410. doi: 10.1038/oby.2003.189. [DOI] [PubMed] [Google Scholar]
- Ehrich TH, Kenney-Hunt JP, Pletscher LS, Cheverud JM. Genetic variation and correlation of dietary response in an advanced intercross mouse line produced from two divergent growth lines. Genet Res. 2005;85:211–222. doi: 10.1017/S0016672305007603. [DOI] [PubMed] [Google Scholar]
- Fitzgerald J, Rich C, Burkhardt D, Allen J, Herzka AS, Little CB. Evidence for articular cartilage regeneration in MRL/MpJ mice. Osteoarthritis Cartilage. 2008;16:1319–1326. doi: 10.1016/j.joca.2008.03.014. [DOI] [PubMed] [Google Scholar]
- Goodale H. A study of the inheritance of body weight in the albino mouse by selection. J Hered. 1938;29:101–112. [Google Scholar]
- Goss RJ, Grimes LN. Epidermal downgrowths in regenerating rabbit ear holes. J Morphol. 1975;146:533–542. doi: 10.1002/jmor.1051460408. [DOI] [PubMed] [Google Scholar]
- Gourevitch D, Clark L, Chen P, Seitz A, Samulewicz SJ, Heber-Katz E. Matrix metalloproteinase activity correlates with blastema formation in the regenerating MRL mouse ear hole model. Developmental Dynamics. 2003;226:377–387. doi: 10.1002/dvdy.10243. [DOI] [PubMed] [Google Scholar]
- Guenther C, Pantalena-Filho L, Kingsley DM. Shaping skeletal growth by modular regulatory elements in the Bmp5 gene. PLoS Genet. 2008;4:e1000308. doi: 10.1371/journal.pgen.1000308. [DOI] [PMC free article] [PubMed] [Google Scholar]
- Gunning P, O'Neill G, Hardeman E. Tropomyosin-based regulation of the actin cytoskeleton in time and space. Physiol Rev. 2008;88:1–35. doi: 10.1152/physrev.00001.2007. [DOI] [PubMed] [Google Scholar]
- Heber-Katz E, Chen P, Clark L, Zhang XM, Troutman S, Blankenhorn EP. Regeneration in MRL mice: further genetic loci controlling the ear hole closure trait using MRL and M.m. Castaneus mice. Wound Repair Regen. 2004;12:384–392. doi: 10.1111/j.1067-1927.2004.012308.x. [DOI] [PubMed] [Google Scholar]
- Hopkinson-Woolley J, Hughes D, Gordon S, Martin P. Macrophage recruitment during limb development and wound healing in the embryonic and foetal mouse. J Cell Sci. 1994;107 ( Pt 5):1159–1167. doi: 10.1242/jcs.107.5.1159. [DOI] [PubMed] [Google Scholar]
- Hrbek T, de Brito RA, Wang B, Pletscher LS, Cheverud JM. Genetic characterization of a new set of recombinant inbred lines (LGXSM) formed from the inter-cross of SM/J and LG/J inbred mouse strains. Mamm Genome. 2006;17:417–429. doi: 10.1007/s00335-005-0038-7. [DOI] [PubMed] [Google Scholar]
- Huang JD, Brady ST, Richards BW, Stenolen D, Resau JH, Copeland NG, Jenkins NA. Direct interaction of microtubule- and actin-based transport motors. Nature. 1999;397:267–270. doi: 10.1038/16722. [DOI] [PubMed] [Google Scholar]
- Kench JA, Russell DM, Fadok VA, Young SK, Worthen GS, Jones-Carson J, Henson JE, Henson PM, Nemazee D. Aberrant wound healing and TGF-beta production in the autoimmune-prone MRL/+ mouse. Clin Immunol. 1999;92:300–310. doi: 10.1006/clim.1999.4754. [DOI] [PubMed] [Google Scholar]
- Kramer MG, Vaughn TT, Pletscher LS, King-Ellison K, Adams E, Erikson C, Cheverud JM. Genetic variation in body weight gain and composition in the intercross of Large (LG/J) and Small (SM/J) inbred strains of mice. Genetics and Molecular Biology. 1998;21:211–218. [Google Scholar]
- Krendel M, Osterweil EK, Mooseker MS. Myosin 1E interacts with synaptojanin-1 and dynamin and is involved in endocytosis. FEBS Lett. 2007;581:644–650. doi: 10.1016/j.febslet.2007.01.021. [DOI] [PMC free article] [PubMed] [Google Scholar]
- Li XM, Gu WK, Masinde G, Hamilton-Ulland M, Xu SZ, Mohan S, Baylink DJ. Genetic control of the rate of wound healing in mice. Heredity. 2001;86:668–674. doi: 10.1046/j.1365-2540.2001.00879.x. [DOI] [PubMed] [Google Scholar]
- MacArthur J. Genetics of body size and related characters. I. Selection of small and large races of the laboratory mouse. Am Nat. 1944;78:142–157. [Google Scholar]
- Maden M, Ong DE, Summerbell D, Chytil F. The role of retinoid-binding proteins in the generation of pattern in the developing limb, the regenerating limb and the nervous system. Development. 1989;107(Suppl):109–119. doi: 10.1242/dev.107.Supplement.109. [DOI] [PubMed] [Google Scholar]
- Manenti G, Galvan A, Pettinicchio A, Trincucci G, Spada E, Zolin A, Milani S, Gonzalez-Neira A, Dragani TA. Mouse genome-wide association mapping needs linkage analysis to avoid false-positive Loci. PLoS Genet. 2009;5:e1000331. doi: 10.1371/journal.pgen.1000331. [DOI] [PMC free article] [PubMed] [Google Scholar]
- Manly KF, Olson JM. Overview of QTL mapping software and introduction to map manager QT. Mamm Genome. 1999;10:327–334. doi: 10.1007/s003359900997. [DOI] [PubMed] [Google Scholar]
- Masinde GL, Li X, Gu W, Davidson H, Mohan S, Baylink DJ. Identification of wound healing/regeneration quantitative trait loci (QTL) at multiple time points that explain seventy percent of variance in (MRL/MpJ and SJL/J) mice F2 population. Genome Res. 2001;11:2027–2033. doi: 10.1101/gr.203701. [DOI] [PMC free article] [PubMed] [Google Scholar]
- McBrearty BA, Clark LD, Zhang XM, Blankenhorn EP, Heber-Katz E. Genetic analysis of a mammalian wound-healing trait. Proc Natl Acad Sci U S A. 1998;95:11792–11797. doi: 10.1073/pnas.95.20.11792. [DOI] [PMC free article] [PubMed] [Google Scholar]
- Murphy ER, Roths JB. Autoimmunity and Lymphoproliferation: Induction by Mutant Gene Lpr, and Acceleration by a Male-associated Factor in Strain BXSB Mice. Elsevier North Holland; New York: 1978. [Google Scholar]
- Nakamura T, Takeuchi K, Muraoka S, Takezoe H, Takahashi N, Mori N. A neurally enriched coronin-like protein, ClipinC, is a novel candidate for an actin cytoskeleton-cortical membrane-linking protein. J Biol Chem. 1999;274:13322–13327. doi: 10.1074/jbc.274.19.13322. [DOI] [PubMed] [Google Scholar]
- Norgard EA, Jarvis JP, Roseman CC, Maxwell TJ, Kenney-Hunt JP, Samocha KE, Pletscher LS, Wang B, Fawcett GL, Leatherwood CJ, Wolf JB, Cheverud JM. Replication of long-bone length QTL in the F9-F10 LG,SM advanced intercross. Mamm Genome. 2009;20:224–235. doi: 10.1007/s00335-009-9174-9. [DOI] [PMC free article] [PubMed] [Google Scholar]
- Reber-Muller S, Streitwolf-Engel R, Yanze N, Schmid V, Stierwald M, Erb M, Seipel K. BMP2/4 and BMP5-8 in jellyfish development and transdifferentiation. Int J Dev Biol. 2006;50:377–384. doi: 10.1387/ijdb.052085sr. [DOI] [PubMed] [Google Scholar]
- Rodriguez OC, Cheney RE. Human myosin-Vc is a novel class V myosin expressed in epithelial cells. J Cell Sci. 2002;115:991–1004. doi: 10.1242/jcs.115.5.991. [DOI] [PubMed] [Google Scholar]
- Rodriguez OC, Schaefer AW, Mandato CA, Forscher P, Bement WM, Waterman-Storer CM. Conserved microtubule-actin interactions in cell movement and morphogenesis. Nat Cell Biol. 2003;5:599–609. doi: 10.1038/ncb0703-599. [DOI] [PubMed] [Google Scholar]
- Roesch A, Becker B, Schneider-Brachert W, Hagen I, Landthaler M, Vogt T. Re-expression of the retinoblastoma-binding protein 2-homolog 1 reveals tumor-suppressive functions in highly metastatic melanoma cells. J Invest Dermatol. 2006;126:1850–1859. doi: 10.1038/sj.jid.5700324. [DOI] [PubMed] [Google Scholar]
- Stocum DL. The urodele limb regeneration blastema. Determination and organization of the morphogenetic field. Differentiation. 1984;27:13–28. doi: 10.1111/j.1432-0436.1984.tb01403.x. [DOI] [PubMed] [Google Scholar]
- Ulrich MM, Verkerk M, Reijnen L, Vlig M, van den Bogaerdt AJ, Middelkoop E. Expression profile of proteins involved in scar formation in the healing process of full-thickness excisional wounds in the porcine model. Wound Repair Regen. 2007;15:482–490. doi: 10.1111/j.1524-475X.2007.00255.x. [DOI] [PubMed] [Google Scholar]
- Wang S, Basten CJ, Zeng Z-B. Windows QTL Cartographer 2.5. Department of Statistics, North Carolina State University; Raleigh, NC: 2009. Ref Type: Electronic Citation. [Google Scholar]
- Woods A, James CG, Wang G, Dupuis H, Beier F. Control of Chondrocyte Gene Expression by Actin Dynamics: A Novel Role of Cholesterol/Roralpha Signaling in Endochondral Bone Growth. J Cell Mol Med. 2009 doi: 10.1111/j.1582-4934.2009.00684.x. [DOI] [PMC free article] [PubMed] [Google Scholar]
- Yu H, Baylink DJ, Masinde GL, Li R, Nguyen B, Davidson HM, Xu S, Mohan S. Mouse chromosome 9 quantitative trait loci for soft tissue regeneration: congenic analysis and fine mapping. Wound Repair Regen. 2007;15:922–927. doi: 10.1111/j.1524-475X.2007.00317.x. [DOI] [PubMed] [Google Scholar]
- Yu H, Mohan S, Masinde GL, Baylink DJ. Mapping the dominant wound healing and soft tissue regeneration QTL in MRL x CAST. Mamm Genome. 2005;16:918–924. doi: 10.1007/s00335-005-0077-0. [DOI] [PubMed] [Google Scholar]
- Zeng ZB. Theoretical basis for separation of multiple linked gene effects in mapping quantitative trait loci. Proc Natl Acad Sci U S A. 1993;90:10972–10976. doi: 10.1073/pnas.90.23.10972. [DOI] [PMC free article] [PubMed] [Google Scholar]
- Zeng ZB. Precision mapping of quantitative trait loci. Genetics. 1994;136:1457–1468. doi: 10.1093/genetics/136.4.1457. [DOI] [PMC free article] [PubMed] [Google Scholar]
- Zhao P, Hoffman EP. Embryonic myogenesis pathways in muscle regeneration. Dev Dyn. 2004;229:380–392. doi: 10.1002/dvdy.10457. [DOI] [PubMed] [Google Scholar]
Associated Data
This section collects any data citations, data availability statements, or supplementary materials included in this article.