Abstract
We present a method for measuring the average group refractive index of the human crystalline lens in vivo using an optical coherence tomography (OCT) system which allows full-length biometry of the eye. A series of OCT images of the eye including the anterior segment and retina were recorded during accommodation. Optical lengths of the anterior chamber, lens and vitreous were measured dynamically along the central axis on the OCT images. The group refractive index of the crystalline lens along the central axis was determined using linear regression analysis of the intraocular optical length measurements. Measurements were acquired on three subjects of age 21, 24 and 35 years. The average group refractive index for the three subjects was, respectively, n = 1.41, 1.43 and 1.39 at 835nm.
1. Introduction
Optical biometry based on low-coherence interferometry has become a standard method to measure ocular distances, including corneal thickness, anterior chamber depth, lens thickness and axial eye length [1,2]. Intraocular distances are calculated by dividing the measured optical path length with estimates of the group refractive index of the ocular media [3]. The group refractive indices of the cornea and aqueous media can be estimated from published dispersion curves [3-5]. Obtaining reliable values of the group refractive index of the crystalline lens, however, is more difficult because the lens has a refractive index gradient that changes with age. In the lens, conversion from optical to physical thickness requires a value of the average group refractive index along the path of the light rays [6].
Calculations of the group refractive index of the lens from published dispersion curves of water or ocular media produce values of 1.4122 at 830 nm, 1.407 at 780 nm and 1.4065 at 855 nm [3-5]. These values do not take into account the refractive index gradient or differences in the dispersion between different media [3,5]. More recently an average value of 1.416 was found for the group refractive index from measurements on isolated lenses [6]. However, obtaining accurate in vitro measurements is problematic due to post-mortem tissue deterioration [6,7].
We present a method to measure the average group refractive index of the lens in vivo using OCT. The method is an adaptation of a technique developed by Van Der Heijde and Weber [8] to measure the speed of sound in the crystalline lens in vivo from dynamic echosonography during accommodation.
2. Optical Principle
In this method the intraocular length, L, is defined as the distance between the posterior cornea and vitreo–retinal boundary. The intraocular length is the sum of the anterior chamber optical depth, OPLAC, the optical thickness of the crystalline lens, OPLL, and the optical depth of the vitreous, OPLV, divided by their respective group indices of refraction, nAQ, nL and nV.
| (1) |
The group refractive indices at 835 nm of the aqueous (nAQ=1.3418) and vitreous (nV=1.3413) are approximately equal [5]. To simplify the calculation we assumed that nV=nAQ = 1.3415. During accommodation, the lens thickness increases and the anterior chamber and vitreous depths decrease. Assuming that axial length does not change (ΔL = 0) and that the average refractive index of the lens remains constant throughout accommodation, equation 1 can be rearranged to show that there is a direct relation between the change in the sum of anterior chamber and vitreous depth, and the change in thickness of the crystalline lens:
| (2) |
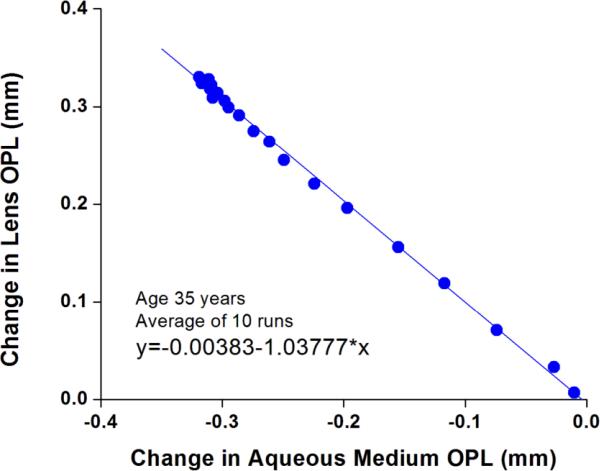
The refractive index of the lens can be determined by plotting the change in optical path length of the crystalline lens against the sum of the change in optical path length of the aqueous media measured at different accommodative states. The average group refractive index of the lens (nL) is the slope of the linear regression of the plot multiplied by the group refractive index of the aqueous media (nAQ=1.3415).
3. Experiment
An SD-OCT system that enables acquisition of B-scans located at different depths was used to acquire images of the anterior segment and the retina in rapid succession during accommodation [9]. An accommodation unit integrated in the OCT delivery probe provides monocular accommodative and disaccommodative stimuli stepping from 0D to 8D during the image acquisition process. Technical details of the system are presented elsewhere [9]. Each composite B-scan (Fig. 1) consisted of 400 A-lines acquired at a rate of about 16.7 frames per second. A total of 16 to 36 composite images of the full-length anterior segment and the retina were consecutively acquired during an accommodative response. Images were acquired on the right eye of three subjects aged 21, 24 and 35 years with refractive errors of +0.50D, -3.5D and -2.5D, respectively. No subject wore corrective lenses during the experiment. The accommodative response of each subject was imaged successively 10 times for the 35 year old subject, and 3 times for the 21 and 25 year old subjects.
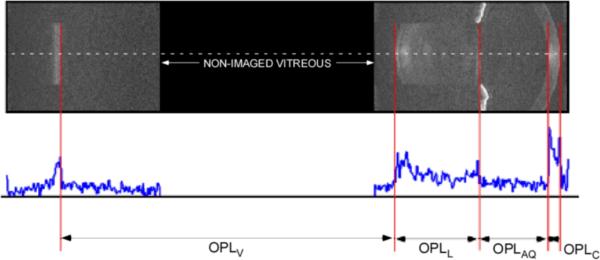
Figure 1.
OCT image of the anterior segment and the retina. The area in black is part of the vitreous and was not imaged since it does not carry any biometric information. Bottom: The A-line along the central axis is selected and its intensity profile is displayed. Local maxima of the intensity profile are used to determine anatomical boundaries and optical distances
Anterior chamber depth, crystalline lens thickness and vitreous depth were determined along the user-selected central A-line corresponding to the apex of the cornea on each of the composite OCT images acquired during the accommodative process. The positions of local maxima in the intensity profile of the central A-line (Fig. 1) corresponding to the ocular boundaries were automatically determined using a custom-built peak-detection algorithm in MATLAB. This analysis was repeated three times for each composite image and resulting optical path lengths were averaged. The intraocular distances were then averaged across imaging sessions to produce an averaged time history of the change in crystalline lens optical thickness and aqueous media optical depth in response to accommodation.
For each subject, the optical change in depth of the crystalline lens after application of the accommodation stimulus was plotted as a function of the change in optical depth of the aqueous and vitreous. The slope of a linear regression was then calculated to produce a value of the group refractive index of the lens.
4. Results
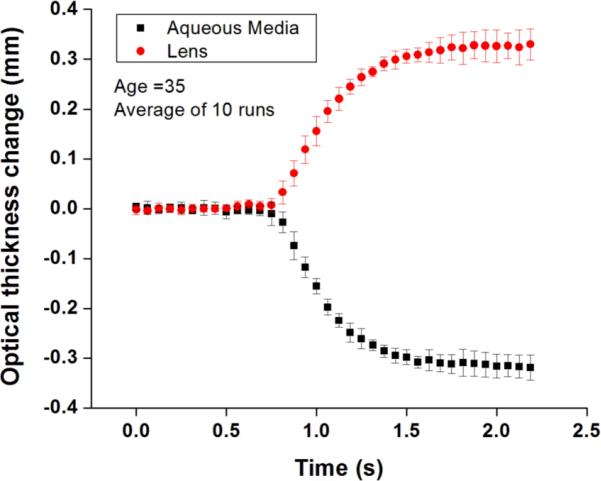
Variability in central A-line selection resulted in a +/-5 μm variability (SD = 2μm) in landmark position. In Fig. 2, the averaged time history and regression plots are shown for the 35 year old subject. Group refractive indices for each subject are shown in Table 1. The values are roughly in agreement with previously reported ex vivo measurements (1.405 to 1.424) [6].
Figure 2.
Change in optical thickness of the aqueous media and the lens of a 35 year old subject. The plots show the average (dots) and standard deviations (error bars) of 10 separate responses.
Table 1.
Group Refractive Index Values
| Age | Measured Group Refractive Index +/- Standard Error | Number of Runs |
|---|---|---|
| 21 | 1.41 ± 0.05 | 3 |
| 24 | 1.43 ± 0.05 | 4 |
| 35 | 1.39 ± 0.01 | 10 |
5. Discussion
We measured the average group refractive index of the lens in vivo by adapting the method that Van Der Heijde and Weber [8] used to measure the speed of sound in the lens. The method rests on the assumptions that the axial eye length and the average group refractive index of the crystalline lens remain constant during accommodation. Some studies using optical biometry report a small increase in axial eye length with accommodation [10-13]. If we assume that axial eye length increases during accommodation, according to Eq. (2) the presented method would overestimate the index of refraction. A change as small as 2.5 μm results in a 0.01 error in the group refractive index. However, these studies calculate eye length by assuming either a single average refractive index for the whole eye [10], or Gullstrand's phase refractive indices in the visible [11] instead of the group refractive indices in the near-infrared. Some of the measured change may also be caused by slight differences in ocular alignment of the device with the visual axis of the eye, which may change the position of the A-line or the path of the beam. The use of B scans allows us to select the same A-line in each image acquired during accommodation and the accommodation stimulus was designed to preserve co-alignment of the OCT beam with the eye throughout the accommodative response. In addition, an error analysis of Eq. (2) shows that if the axial elongation is assumed to range anywhere between 5μm [13] to 60 μm [14], the refractive index of the 21 year-old, for instance, would decrease from nL = 1.41 to a value ranging from 1.22 to 1.37, which is much lower than expected. Further studies with improved accuracy are required to confirm if the axial eye length changes during accommodation.
The method presented also relies on the assumption that the index of refraction remains constant during accommodation. Integrating the refractive index distributions that Kasthurirangan et al [14] present for young unaccommodated and accommodated eyes shows that the average refractive index of the crystalline lens changes by less than 0.001 during accommodation, and this value is well within our error in measurement. One of the challenges of the technique is that high precision measurements of the refractive index (to the third digit) require very high precision measurements of the ocular distances. An error analysis shows that a precision of ± 0.005 in the group refractive index can be achieved with a precision of ±6 μm in the measurement of the optical path length change during accommodation. To increase the precision of the measurements, the image acquisition must be optimized to increase the number of samples acquired during the dynamic phase of the accommodative response to reduce the uncertainty of the slope. Another approach is to acquire and average a larger number of responses per subject.
The present study demonstrates the feasibility of measuring the average axial group refractive index of the lens in vivo by quantifying dynamic changes in ocular distances with accommodation. The method can be used to quantify the inter-individual variation as well as the age-dependence of the group refractive index on a large population sample. These studies will produce normative data that will help increase the accuracy of ocular biometry across all ages before the onset of presbyopia. Knowledge of the average group refractive index of the lens is also useful to validate models of the refractive index gradient [6,14] and to develop distortion correction algorithms designed to obtain accurate estimates of the posterior lens and retina shape from OCT images [15]. One limitation of the method is that it can not measure presbyopic lenses.
Figure 3.
Optical thicknesses of the crystalline lens in function of the optical length of the aqueous media for the 35 year old subject. The slope of the data linear regressions (blue line, 1.038) represents the ratio between the group refractive indices of the lens and the aqueous media.
Acknowledgements
Supported in part by NIH grants 2R01EY14225; 1R01EY021834; the Australian Commonwealth Government under the Cooperative Research Centre (CRC) Scheme Vision CRC, Sydney, Australia; NIH P30EY14801 (Center Grant); Florida Lions Eye Bank; Research to Prevent Blindness; the Henri and Flore Lesieur Foundation (JMP). A sincere thank you to Robert Augusteyn for all of his help in reviewing the manuscript.
Footnotes
Author Disclosure. The University of Miami and authors MR, FM, JMP, and AH stand to benefit from intellectual property in the OCT technology used in this study.
References
- 1.Chen Y-A, Himschall N, Findl O. Evaluation of 2 new optical biometry devices and comparison with current gold standard biometer. J Cataract Refract Surg. 2011;37:513–517. doi: 10.1016/j.jcrs.2010.10.041. [DOI] [PubMed] [Google Scholar]
- 2.Rabsiller T, Jepsen C, Auffarth G, Holzer M. Intraocular lens power calculation: Clinical comparison of 2 optical biometry devices. J Cataract Refract Surg. 2010;36:230–234. doi: 10.1016/j.jcrs.2009.09.016. [DOI] [PubMed] [Google Scholar]
- 3.Hitzenberger C. Optical measurement of the axial eye length by laser doppler interferometry. Invest Ophth Vis Sci. 1991;32:616–624. [PubMed] [Google Scholar]
- 4.Atchison D, Smith G. Chromatic dispersion of the ocular media of human eyes. J. Opt. Soc. Am. A. 2005;22:29–37. doi: 10.1364/josaa.22.000029. a. [DOI] [PubMed] [Google Scholar]
- 5.Drexler W, Hitzenberger CK, Baumgartner A, Findl O, Sattmann H, Fercher A. Investigation of dispersion effects in ocular media by multiple wavelength partial coherence interferometry. Exp. Eye Res. 1998;66:25–33. doi: 10.1006/exer.1997.0401. [DOI] [PubMed] [Google Scholar]
- 6.Uhlhorn S, Borja D, Manns F, Parel JM. Refractive index measurement of the isolated crystalline lens using optical coherence tomography. Vision Res. 2008;48:2732–2738. doi: 10.1016/j.visres.2008.09.010. [DOI] [PMC free article] [PubMed] [Google Scholar]
- 7.Augusteyn R, Rosen A, Borja D, Ziebarth NM, Parel J-M. Biometry of primate lenses during immersion in preservation media. Molecular Vision. 2006;12:740–747. [PubMed] [Google Scholar]
- 8.Van der Heijde GL, Weber J. Accommodation used to determine ultrasound velocity in the human lens. Optometry and Vision Science. 1989;66:830–833. doi: 10.1097/00006324-198912000-00005. [DOI] [PubMed] [Google Scholar]
- 9.Borja D, Siedlecki D, de Castro A, Uhlhorn S, Ortiz S, Arrieta E, Parel JM, Marcos S, Manns F. Distortions of the posterior surface in optical coherence tomography images of the isolated crystalline lens: effect of the lens index gradient. Biomedical Optics Express A. 2010;1:1331–1340. doi: 10.1364/BOE.1.001331. [DOI] [PMC free article] [PubMed] [Google Scholar]
- 10.Ruggeri M, Uhlhorn S, de Freitas C, Ho A, Manns F, Parel J-M. Imaging and full-length biometry of the eye during accommodation using spectral domain OCT with an optical switch. Biomedical Optics Express. 2012;3:2506–2520. doi: 10.1364/BOE.3.001506. [DOI] [PMC free article] [PubMed] [Google Scholar]
- 11.Mallen E, Kashyap P, Hampson K. Transient Axial Length Change during the Accommodation Response in Young Adults. Invest Ophth Vis Sci. 2006;47:1251–1254. doi: 10.1167/iovs.05-1086. [DOI] [PubMed] [Google Scholar]
- 12.Woodman E, Read S, Collins M. Axial length and choroidal thickness changes accompanying prolonged accommodation in myopes and emmetropes. Vision Res. 2012;72:34–41. doi: 10.1016/j.visres.2012.09.009. [DOI] [PubMed] [Google Scholar]
- 13.Drexler W, Findl O, Schmetterer L, Hitzenberger CK, Fercher AF. Eye elongation during accommodation in humans: differences between emmetropes and myopes. Invest Ophth Vis Sci. 1998;39:2140–2147. [PubMed] [Google Scholar]
- 14.Uozato H, Shimizu K, Minei R, Suzuki H. Effect of accommodation on axial length measurment in optical coherence biometry. presented at the annual meeting of the Association of Research in Vision and Ophthalmology; Ft. Lauderdale, FL. May 2003. [Google Scholar]
- 15.Kasthurirangan S, Markwell E, Atchison D, Pope J. In vivo study of changes in refractive index distribution in the human crystalline lens with age and accommodation. Invest Opht Vis Sci. 2008;49:2531–2540. doi: 10.1167/iovs.07-1443. [DOI] [PubMed] [Google Scholar]


