

Abstract
The study of hominin brain evolution relies mostly on evaluation of the endocranial morphology of fossil skulls. However, only some general features of external brain morphology are evident from endocasts, and many anatomical details can be difficult or impossible to examine. In this study, we use geometric morphometric techniques to evaluate inter- and intraspecific differences in cerebral morphology in a sample of in vivo magnetic resonance imaging scans of chimpanzees and humans, with special emphasis on the study of asymmetric variation. Our study reveals that chimpanzee–human differences in cerebral morphology are mainly symmetric; by contrast, there is continuity in asymmetric variation between species, with humans showing an increased range of variation. Moreover, asymmetric variation does not appear to be the result of allometric scaling at intraspecific levels, whereas symmetric changes exhibit very slight allometric effects within each species. Our results emphasize two key properties of brain evolution in the hominine clade: first, evolution of chimpanzee and human brains (and probably their last common ancestor and related species) is not strongly morphologically constrained, thus making their brains highly evolvable and responsive to selective pressures; second, chimpanzee and, especially, human brains show high levels of fluctuating asymmetry indicative of pronounced developmental plasticity. We infer that these two characteristics can have a role in human cognitive evolution.
Keywords: chimpanzee, hominin, EvoDevo, geometric morphometrics, neuroanatomy
1. Introduction
Current understanding of hominin brain evolution is based on morphology that can be ascertained in the fossil record represented either by cranial fossil remains or by endocranial casts. Some traits considered to be related to the evolution of modern human behaviour can be traced in fossils. These traits include endocranial volume [1], petalial patterns [2], morphology of the frontal lobes [3,4], asymmetry of Broca's cap region [5], neurocranial globularity [6,7] and lunate sulcus position [8], among others (reviewed in [9]). However, even this constellation of traits cannot be unequivocally evaluated in hominin fossil species owing to the incomplete correspondence between endocranial and brain morphology. The study of those traits that do not leave an imprint in the endocranial surface can only be examined by means of comparative studies of humans with other primates.
Geometric morphometrics (GM) is the statistical analysis of morphology based on Cartesian landmark coordinates, and it constitutes a powerful methodological set of tools that is widely used in palaeontological and palaeoanthropological research. Nevertheless, with a few notable exceptions [10,11], these methodologies have rarely been used in neuroscience. However, the application of these techniques in comparative neuroscience holds tremendous potential for several reasons. First and most importantly, the use of a common methodological framework can help to bridge the gap that sometimes exists between palaeoanthropological and neuroanatomical observations. Second, GM techniques provide appropriate tools to analyse morphological variation between and within populations, which constitutes the substrate upon which natural selection can act. Quantifying and understanding this variation is fundamental to studies of brain evolution. Finally, the classic formulation of GM methods is based on the analysis of homologous structures represented by means of reference points or landmarks. Such use of anatomically homologous points make these techniques especially suitable for evolutionary studies, as the variation of those structures can be traced across the fossil record or across closely related species.
Although brain asymmetry and behavioural lateralization were once considered to be exclusively human traits [12], owing to the pronounced cerebral hemisphere specialization for some complex cognitive capabilities [13], increasing evidence demonstrates that macrostructural, microstructural and behavioural asymmetries are widespread not only in other primates [14–20], but also in other mammals, vertebrates and even invertebrates [21]. Three distinctive patterns of population-level asymmetries are theoretically possible in organisms' brains, and each type may differ in anatomical localization and functional significance: (i) directional asymmetry occurs when the two sides of the brain are systematically different across a population in some respects; (ii) anti-symmetry is the consistent difference between sides, but the direction of this difference varies in the population; and (iii) fluctuating asymmetry is an estimate of non-directional departures from the expected bilateral symmetry (or from the norm of average directional asymmetry [22]). Directional asymmetry and anti-symmetry are considered to be at least partially genetically determined, whereas fluctuating asymmetry is usually considered a signal of developmental instability [23]. Indirect evidence of developmental processes shaping brain phenotypes gained from studies of symmetric and asymmetric variation can help to better understand the interaction between brain development and the evolution of human cognitive capabilities.
Functional inferences based on morphological variations are however far from unambiguous. It has been demonstrated that there is a variable relationship between sulcal organization and cytoarchitectural boundaries [24]. This relationship seems to be more constant for primary and secondary sensorimotor areas, whereas higher order cortical areas exhibit more variability [25]. This has led to the use of probabilistic mapping techniques to characterize the location of cortical areas in humans and, more recently, in chimpanzees [18,19]. At a more functional level, it has been proposed that cognitive evolution can rely on redeployment of existing neural components, such that specific cortical areas may become increasingly multi-functional, and the most recent cognitive functions will involve more distributed network processing among disparate cortical areas [26]. Changes in brain morphology across hominin evolution are clear and probably related to other macrostructural, microstructural, behavioural and cognitive modifications, but the indirect relationship between endocast morphology, sulcal organization, cytoarchitecture and function requires inferences about cognitive evolution drawn solely from morphological analyses to be cautious.
In this study, we explore inter- and intraspecific patterns of variation in cortical morphology in common chimpanzees (Pan troglodytes) and modern humans (Homo sapiens), which are, together with bonobos, the only extant representatives of the hominine clade that includes a larger number of panin and hominin fossil species. We also evaluate the existence of intraspecific allometric variation in both species. In addition, we quantify the different components of symmetric and asymmetric (including directional and fluctuating) variation in an attempt to clearly describe human brain morphology with respect to asymmetry. We use these patterns of variation to infer the impact that developmental events may have had on brain evolution of hominins.
2. Material and methods
A sample of 72 chimpanzee (23 males and 49 females) and 73 human (27 males and 46 females) in vivo magnetic resonance imaging (MRI) scans was used for this study. Chimpanzees housed at the Yerkes National Primate Research Center of Emory University were scanned using a 3 T scanner (Siemens Trio, Siemens Medical Solutions, Malvern, PA, USA), and they ranged from 6 to 50 years old. Human scans were obtained from the OASIS database [27], selecting only healthy (non-demented) individuals with ages ranging from 18 to 60 years old. All the scans stored in this database belong to right-handed individuals and were acquired with a 1.5 T Vision scanner (Siemens, Erlangen, Germany). Technical details of human MRI acquisition, as well as population information, is provided in [27], whereas the equivalent information for chimpanzee MRI scans is provided in [17]. Three-dimensional surface models of brain hemispheres were reconstructed using BrainVISA software [28], and they were later imported into IDAV Landmark Editor software [29] for landmark digitation.
Thirty-eight homologous landmarks (19 landmarks per hemisphere) were selected in order to obtain a uniform representation of the cerebral cortical surface (see the electronic supplementary material, figure S1 and table S1). Landmarks were located at the initial and endpoints, as well as at some intersections, of the most constant sulci observed in chimpanzees [20], which are those that demarcate major lobar subdivisions and that are associated with some cognitively relevant areas (i.e. Broca's area, Wernicke's area and insular cortex). The conformation of landmarks used for chimpanzee brain analysis was later used for the analysis of human brains (see the electronic supplementary material for discussion on landmark homology). Landmarks were digitized twice in both samples to assess measurement error (see below).
Three-dimensional configurations of landmarks were subjected to a Procrustes superimposition [30] to remove the non-shape variation corresponding to position, size and orientation. The symmetric and asymmetric components of morphological variance were studied separately by analysing the symmetric averages of the original and mirrored configurations of landmarks for each brain (symmetric variation), and the deviations of the original conformations of landmarks from the symmetric averages (asymmetric variation, [22,31]). Principal components analyses (PCAs) of superimposed Procrustes symmetric coordinates and asymmetric residuals were carried out to extract the main patterns of variation in the chimpanzee and in the human samples. Main axes of intra- and interspecific variation were compared by measuring the angle θ between chimpanzee and human vectors [32], which is close to 0° when two vectors have parallel trajectories, and close to 90° when trajectories diverge significantly. Analyses were carried out using MorphoJ software [33]. Thin plate spline-based surface warping was used for visual representations of morphological variations using IDAV Landmark Editor software [29]. Allometric effects were evaluated by means of a multivariate regression of shape variables (Procrustes coordinates) on centroid size, a measure of size defined as the squared root of the summed squared distances between individual landmarks and the centroid of the configuration of landmarks. Allometric trajectories observed in chimpanzees and humans were also compared by measuring the angle between them.
Evaluations of the different components of variance with respect to asymmetry used the classic formulation of Procrustes ANOVA as laid out by Klingenberg & McIntyre [22] and Klingenberg et al. [31], where the factor ‘individual’ reflect symmetric variations in both hemispheres, the factor ‘side’ reflects consistent variations in one direction (directional asymmetric variations), and the interaction term reflects non-directional asymmetric changes in individuals (fluctuating asymmetric variations). Repeated measurements of individuals allowed us to quantify measurement error as the residual variation obtained in the Procrustes ANOVA. The localization of these different types of effects was quantified by decomposing the Procrustes mean squares for each effect according to landmarks [22]. As it has been discussed elsewhere, this is a conservative but valid procedure to identify localized variation in configurations of landmarks [22]. The obtained values were graphically represented on brain surface models using an inverse distance weighting interpolation implemented in Mathematica v. 8.0 (Wolfram Research Inc., Champaign, IL, USA).
3. Results
PCAs were used to reduce the original dataset to a few dimensions that represent most morphological variation. PCAs of combined data from humans and chimpanzees revealed that shape differences between both species are mainly owing to symmetric variation (figure 1a). Morphological differences between both species are clear, and include some well-described traits such as frontal enlargement and parietal expansion in humans, as well as a general alteration of brain proportions, that vary from relatively short and broad in chimpanzees to rostro-caudally elongated in humans. In terms of asymmetry, the PCA plot does not show a separation of both species, but the range of intraspecific variation in humans is considerably larger and encompasses the chimpanzee range of variation (figure 1a).
Figure 1.

Evolution of brain morphology. (a) Principal components analysis of (i) symmetric and (ii) asymmetric variation with 95% confidence ellipses (humans are represented in blue, and chimpanzees are represented in red). The green circle in the plot to the right represents the hypothetical location of a perfectly symmetric brain. (b) Scree plots showing the distribution of variance across the first 20 principal components (PCs) (lower rank PCs are not represented) for the complete sample (green), human sample (blue) and chimpanzee sample (red), for (i) symmetric and (ii) asymmetric variation. (c) Theoretical model of evolution across an adaptive landscape with an optimum value (global optimum, red) and a suboptimum value (local optimum, orange). The population ‘a’ has a well-defined line of least resistance that takes it to the suboptimum value, even if the selective optimum is closer to the initial value of the population. Populations without well-defined lines of least resistance as ‘b’ can evolve directly to optimal values, thus being highly evolvable in landscapes with moving optima. Part (c) of the figure has been modified after Steppan et al. [34].
As the brain phenotype of the chimpanzee–human last common ancestor (LCA) is generally assumed to be more similar to chimpanzees, the first principal component (PC) of interspecific comparisons may be interpreted to be similar to the direction of evolution in the hominin clade. The angle θ between the vector separating chimpanzees and humans, and the main axes of variation within each species estimates the extent to which intraspecific variation and evolutionary change follow similar patterns. For symmetric variation, evolutionary change is not significantly associated with the direction of maximum intraspecific variation in chimpanzees (θ = 82.2°, which is statistically indistinguishable from the angle between random vectors: p = 0.328), and it is only weakly associated with the axis of maximum variation in humans (θ = 70.6°, p = 0.014). The first axis of asymmetric variation in humans is significantly aligned to the first interspecific axis (θ = 16.6°, p < 0.001), whereas evolutionary change is not significantly aligned to the first axis of variation in chimpanzees (θ = 76.4°, p = 0.084), but to the second axis (θ = 56.3°, p < 0.001).
Analyses within each species demonstrate that both humans and, especially, chimpanzees show smooth intraspecific distributions of variance without clearly predominant PCs (figure 1b). This means that no single factor accounts for most morphological variance within these samples. Morphological comparisons of the configuration of landmarks on the cerebral cortex of chimpanzees and humans show that they share similar patterns of symmetric variation (θ = 59.2°, p < 0.001). As for asymmetry, the first axes of variation observed in chimpanzees and humans are only moderately associated (θ = 73.1°, p = 0.030), but association is stronger between the human first axis and the chimpanzee second axis (θ = 58.6°, p < 0.001).
The first PC obtained in the analysis of symmetric variation explains 14.12 per cent of variance in chimpanzees and 18.09 per cent in humans (see the electronic supplementary material, table S2), and it corresponds in both samples with a general alteration of brain proportions that change from a brachycephalic shape (a laterally broad shape with respect to the rostro-caudal axis) to a dolichocephalic shape (laterally narrow and rostro-caudally elongated; figure 2, upper quadrants). Other symmetric morphological patterns recovered in the first axis of variation in both samples include parietal expansion and a relative lengthening of the Sylvian fissure and superior temporal sulcus, regions that are associated with Wernicke's area (figure 2, upper quadrants). Regarding asymmetric variation, both samples share a unilateral lengthening of the Sylvian fissure and the superior temporal sulcus that is more frequently observed in the left hemisphere (figure 2, lower quadrants). However, while petalial variation is also included in the first axis of variation in the human sample, which explains 19.01 per cent of variance, the left-occipital right-frontal (LORF) petalia is barely visible in the first PC corresponding to chimpanzees, which accounts for 11.56 per cent of shape variance (see the electronic supplementary material, table S2). The chimpanzee PC1 recovers a frontal projection of Broca's area homologue (more frequently observed in the left hemisphere) relative to the lateral orientation of this region in the other hemisphere (figure 2, lower-left quadrant).
Figure 2.

Intraspecific morphological variation in chimpanzee and human brains. Wireframe models showing the transformation from the consensus shape (grey) to the target shape (black) are provided under warped surface models. Morphological extremes corresponding to positive and negative scores for PC1 are provided for symmetric variation. As for asymmetric variation, the range of observed asymmetry is visualized by providing the population symmetric consensus shape (Sym) and the most extreme asymmetric shape (Asym). Red spheres represent anatomical landmarks used in the study. Top and right lateral views are provided for symmetric variation, and right and left lateral views are represented for asymmetric variation. Chimpanzee and human brains are not to scale.
Both the chimpanzee and the human sample exhibit significant, although quantitatively very small, allometric effects when evaluating the symmetry component of variation. The percentage of variance predicted by overall brain size is 3.08 per cent in chimpanzees (p = 0.006) and 3.13 per cent in humans (p = 0.009). These allometric trajectories are divergent, forming an angle of 83.1°, which is not significantly different from the angle between random vectors (p = 0.191). Larger chimpanzee brains tend to show laterally expanded frontal and parietal lobes (see the electronic supplementary material, figure S2). Larger human brains, by contrast, tend to have a more elongated shape relative to smaller brains, which tend to be bilaterally broader (see the electronic supplementary material, figure S2). For the asymmetry component of variance, there is not a significant association with allometry in either sample (p = 0.480 for chimpanzees and p = 0.744 for humans). Sex, age and handedness have non-significant or quantitatively very small effects on the evaluated morphological patterns (see the electronic supplementary material, figures S3 and S4).
The proportion of symmetric and asymmetric variation differs substantially between chimpanzees and humans. Whereas in chimpanzees almost 75 per cent of variance corresponds to symmetric changes, this value is only slightly higher than 50 per cent in humans (table 1). Directional asymmetry is highly significant in both samples, although it explains less than 2 per cent of the total variance in chimpanzees versus more than 8 per cent in humans. Fluctuating asymmetry is the most predominant component of asymmetric variation in both species (and it is highly significant with respect to measurement error), with a value close to 20 per cent in chimpanzees and close to 27 per cent in humans. The possibility that the interaction term individual × side corresponds to anti-symmetric variation is ruled out because there is no evidence of clustering of two groups in PCA plots of asymmetric variation (see figure 1 and electronic supplementary material, figures S3 and S4). Directional asymmetric differences between hemispheres are mainly localized at the posterior perisylvian region (posterior extreme of the Sylvian fissure and of the superior temporal sulcus) in both humans and chimpanzees. Interestingly, the main fluctuating asymmetric variations are localized in the same posterior perisylvian regions in human brains, where these areas are hypervariable. In chimpanzees, fluctuating asymmetric variation is mainly found in the inferior frontal region (see figure 3 and electronic supplementary material, tables S3 and S4).
Table 1.
Intraspecific Procrustes ANOVAs of chimpanzee and human samples. (SS, sum of squares; MS, mean squares (multiplied by 1000); d.f., degrees of freedom; F, F-ratio; p, p-value; %var, percentage of variance explained by each effect; S, symmetry; DA, directional asymmetry; FA, fluctuating asymmetry; measurement, measurement error.)
| species | effect | SS | MS | d.f. | F | p | %var |
|---|---|---|---|---|---|---|---|
| chimpanzee | individual (S) | 0.950 | 0.252 | 3763 | 3.92 | <0.0001 | 73.53 |
| side (DA) | 0.024 | 0.440 | 54 | 6.83 | <0.0001 | 1.86 | |
| individual × side (FA) | 0.247 | 0.064 | 3834 | 6.96 | <0.0001 | 19.12 | |
| measurement | 0.071 | 0.009 | 7704 | 5.49 | |||
| total | 1.292 | ||||||
| human | individual (S) | 0.928 | 0.243 | 3816 | 2.16 | <0.0001 | 56.41 |
| side (DA) | 0.134 | 2.479 | 54 | 22.06 | <0.0001 | 8.15 | |
| individual × side (FA) | 0.437 | 0.112 | 3888 | 6.02 | <0.0001 | 26.56 | |
| measurement | 0.146 | 0.019 | 7811 | 8.87 | |||
| total | 1.645 |
Figure 3.
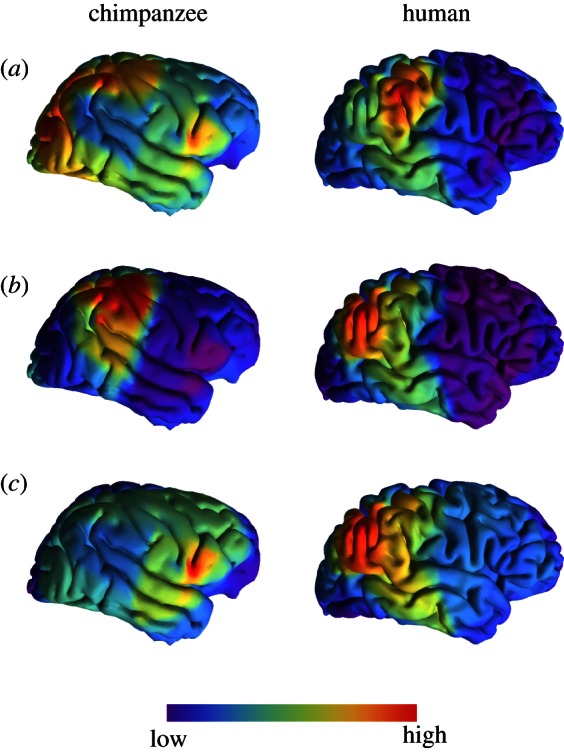
Localization of levels of variation for chimpanzees and humans. (a) Symmetric variation is mainly localized in the posterior perisylvian area in humans, whereas it is more diffusely localized in chimpanzees. (b) Strongest directional asymmetries are localized in both species at the posterior termination of the Sylvian fissure and of the superior temporal sulcus. (c) Fluctuating asymmetric variation is also localized in the postsylvian area in humans, but it is strongest in the inferior frontal region in chimpanzees. Chimpanzee and human brains are not to scale.
4. Discussion
Our GM analysis has revealed that, although chimpanzee and human brain morphology are clearly differentiated in symmetric features, asymmetric variation in humans appears to be a maximization of the trend observed in chimpanzees and, probably, in the chimpanzee–human LCA. In addition, our results demonstrate that brain morphological variation in both species is not strongly determined by one single factor (represented by the first PC), and therefore might be highly evolvable. Although allometric factors are often invoked to explain hominin brain evolution, they are not observed to exert a strong effect on cortical morphology within each species. Finally, our decomposition of asymmetric variation into both directional and fluctuating asymmetric changes has demonstrated that both types of asymmetry are significant in chimpanzees and humans, but substantially larger in humans.
Morphological variation in the chimpanzee and human cortex showed several quasi-equivalent trajectories represented by various PCs (figure 1b,c). This lack of generalized and strong covariances may be indicative of the high evolvability (the ability of a population to respond to selection) of hominine brains, because the phenotypic line of least evolutionary resistance [35] along which evolutionary changes are facilitated [36] can change rapidly in response to selective pressures. This can be the reason why the chimpanzee second axis of variation has stronger association with the human first axis and with evolutionary change than the chimpanzee first axis. The line of least resistance is represented by the first PC obtained in intraspecific analyses, and it is considered to be well defined when that PC explains a large proportion of morphological variance, a very different scenario from the one observed in our analyses. Modular organization is one of the mechanisms that can favour evolvability by allowing one module to change without interfering with others, but it has been suggested that the most evolvable architectures may be those with intermediate levels of integration [37]. An evaluation of morphological integration between different cerebral areas is currently in progress and will help to clarify this association, adding new information to the existing literature on these topics, which is mainly based on cranial morphology [38,39].
In regard to asymmetry, the human range of variation is larger than and includes the total range of variation for chimpanzees. Analyses of fossil endocasts similarly seem to reflect a gradual increase in the degree of expression of asymmetric traits from earlier to later hominins [9], so the H. sapiens range of asymmetric variation is likely to include that of other hominin species as well. If this were the case, the direction of maximum phenotypic variance identified in the analysis of asymmetric variation in humans would be roughly parallel to the corresponding interspecific vector, so the evolution of asymmetry would be expanding the range of variation along the first several lines of least resistance, which have been collectively defined as a subspace of least resistance [40].
Several features of modern human brains, such as cerebral (or neurocranial) globularity [6,7] and widening of the frontal lobes [41] appear to be evolutionary specializations as compared with apes, whereas increased asymmetries are an extension of the trend observed in other primates [16,17,20,42,43]. Our study reveals that one of the most prominent directional asymmetries maximized during hominin evolution is in the posterior part of the perisylvian region, an anatomical asymmetry that is also accompanied by microstructural asymmetries in both humans [44] and chimpanzees [19,45]. In addition, our results reveal that the LORF petalia is not independent of other cortical asymmetric variations [46], and that sulci related to Broca's area are not markedly asymmetric when compared with other sulci [47]. However, other studies have demonstrated that surface asymmetry in the inferior frontal region is prominent and reaches similar degrees as the surface asymmetry of the posterior perisylvian region in humans [47]. Different measures of asymmetry in the inferior frontal region in chimpanzees have reported varying results, ranging from similarities in the degree of volumetric asymmetries to that observed in modern humans [42,43], to non-significant asymmetry based on cytoarchitectural analysis [18]. These observations reveal that inferior frontal region asymmetry is a complex and multi-dimensional trait that does not provide unequivocal results when explored in its different dimensions [48]. Taken together, our results reveal that directional asymmetric variations in sulcal folding show similar patterns in chimpanzees and humans, consisting of a conspicuous asymmetry in the postsylvian area that is quantitatively more marked than any other brain asymmetry.
Our study also shows that increased brain asymmetry is not the necessary outcome of increased brain size, as predicted by theoretical models based on interhemispheric conduction delay [49]. Our sample of chimpanzees encompasses a range of cranial capacities of approximately 350–500 cc, and the human sample includes a range of 1100–1900 cc. The range of endocranial volumes observed in chimpanzees includes the volumes measured in most Australopithecus and Paranthropus species [9]. Similarly, the range of cranial capacities measured in our human sample ranges from values similar to those found in some Homo erectus [50] to values exceeding by more than 3 s.d. the mean endocranial volume of Neanderthals and fossil H. sapiens [50]. In spite of these large ranges of cranial capacities (and corresponding brain volumes), we did not find a significant association between brain size and brain asymmetry at an intraspecific level. This suggests that, despite the efforts to control for phylogenetic effects, the findings of broad comparative interspecific analyses [51] may reflect differences in species-typical brain bauplans only secondarily associated with size, instead of a consistent allometric trend that is governed solely by biophysical demands that vary with brain size. Our results also reveal a quantitatively small allometric effect in the symmetric component of variation of both humans and chimpanzees that are nonetheless divergent in their directions. Taken together, our results indicate that the most evolutionarily distinctive morphological features observed in the human cerebral cortex are not simply the result of allometric scaling [41].
Previous research on cranial shape (including facial and basicranial shape) in different hominoid species (orangutans, gorillas, chimpanzees, bonobos and humans) show approximately 90 per cent of symmetric variation, 10 per cent of fluctuating asymmetric variation and 1 per cent of directional asymmetric variation (percentages have been calculated using values in table 2 in [52]). These percentages are very similar across species, but human skulls show the lowest percentage of symmetric variation among the five species, and the highest percentages of directional asymmetry and fluctuating asymmetry. Although our study only includes chimpanzees and humans, our results are fully compatible with these values showing a relative increase of directional and fluctuating asymmetric variation in humans, and may reflect the interaction of brain and skull development [53].
Elevated degrees of fluctuating asymmetry have been argued to arise from high developmental instability or developmental noise [22]. Biological systems that express high levels of fluctuating asymmetry might signal relatively weak canalization [54], which refers to the property of organisms to buffer development against environmental and genetic perturbations [55]. In such cases, fluctuating asymmetry is often thought to be a maladaptive trait that results from the inability of the system to compensate for developmental perturbations. We suggest, however, that evidence of fluctuating asymmetry may also be indicative of developmental plasticity in the context of brain evolution and development, where different forms of plasticity have a key role in learning and, consequently, in behaviour and cognition [56]. In our view, cerebral fluctuating asymmetry might be the outcome of developmental plasticity, a highly adaptive property that can be identified at very different levels of brain organization (anatomical, cellular and molecular). Developmental plasticity is prominent in human brains as evident by an extended period of maturation of connectivity, and a greater dynamic range of gene expression in childhood as compared with adulthood [57,58]. Furthermore, comparative studies of gene expression and microstructure indicate that the human neocortex is distinguished by prolonged postnatal development as compared with chimpanzees and other primates [59]. Our current findings demonstrate that anatomical fluctuating asymmetry in the brain is also elevated in humans as compared with chimpanzees, which is consistent with the interpretation that it might represent an adult phenotype that reflects the outcome of amplified developmental plasticity earlier in life.
Some of the models explaining gyrification link the tension produced by neuronal connections with morphological variation in gyral and sulcal patterns, thus establishing an association between brain surface morphology and neuronal connectivity within a developmental framework [60–62]. Studies of monozygotic twins have demonstrated the high degree of environmental influence on cortical morphology [63], in spite of the unquestionable genetic influences on brain structure [64]. Primary and secondary sulci, as well as directional asymmetries of sulcal folding, develop early during prenatal development [65], whereas tertiary sulci develop postnatally and are subject to high degrees of environmental influences [62]. The high degree of cortical plasticity that defines human neurodevelopment may cause slight and non-directional deviations of the trajectory of primary sulci that are quantified as fluctuating asymmetric variations in our study, and that can be linked to the appearance of tertiary sulci.
Recent literature has highlighted that some phylogenetic and developmental constraints can serve as preadaptations for human cognitive evolution [66]. The existence of directional asymmetries in the posterior perisylvian area of chimpanzees [14,19] and other primates [15] may be one of the first preadaptations scaffolding the later appearance of some specialized cognitive abilities in humans, such as language [19,67]. Biomechanical [68] or metabolic [69] constraints causing human altriciality may have provided another key preadaptation for the evolution of modern human cognition by allowing an increased period of postnatal modelling of the developing brain via the interaction with complex social and cultural environments [70]. Importantly, the dependence of human newborns on parental care may have created a selective pressure on social interaction (and possibly a subsequent interplay between social interaction and brain plasticity) that may have been inherited through non-genetic mechanisms before genetic assimilation [71]. Our results support a progressive and multi-level view of human cognitive evolution by demonstrating high levels of fluctuating asymmetry in adult hominine brains. Exaggerated fluctuating cerebral asymmetries in humans relative to chimpanzees may be indicative of a substantial and sustained developmental plasticity, potentially linked with unique cognitive abilities arising during hominin evolution.
Acknowledgements
Scanning procedures in chimpanzees were approved by the Institutional Animal Care and Use Committee of Emory University, and human subjects participated in scan acquisition in accordance with guidelines of the Washington University Human Studies Committee.
We are grateful to Emiliano Bruner for general advice and orientation, to Eran Shifferman and Gerard Muntané for commenting on earlier versions of the manuscript and to David Polly and David Sánchez-Martín for their invaluable ideas for graphical representations of brain surface models. This work was supported by National Science Foundation grant nos. BCS-0515484, BCS-0549117, BCS-0824531 and DGE-0801634; National Institutes of Health grant nos. HD-56232, MH-92932, NS-42867, NS-73134, RR-00165 and U01 MH081896 and James S. McDonnell Foundation grant nos. 22002078, 220020165 and 220020293. The Open Access Series of Imaging Studies (OASIS) project is supported by grants P50 AG05681, P01 AG03991, R01 AG021910, P50 MH071616, U24 RR021382 and R01 MH56584.
References
- 1.Holloway RL. 1995. Toward a synthetic theory of human brain evolution. In Origins of the human brain (eds Changeux JP, Chavaillon J.), pp. 42–54 Oxford, UK: Clarendon Press [Google Scholar]
- 2.Balzeau A, Gilissen E, Grimaud-Hervé D. 2012. Shared pattern of endocranial shape asymmetries among great apes, anatomically modern humans, and fossil hominins. PLoS ONE 7, e29581. 10.1371/journal.pone.0029581 (doi:10.1371/journal.pone.0029581) [DOI] [PMC free article] [PubMed] [Google Scholar]
- 3.Carlson KJ, Stout D, Jashashvili T, Ruiter DJ, de Tafforeau P, Carlson K, Berger LR. 2011. The endocast of MH1, Australopithecus sediba. Science 333, 1402–1407 10.1126/science.1203922 (doi:10.1126/science.1203922) [DOI] [PubMed] [Google Scholar]
- 4.Falk D. 2012. Hominin paleoneurology: where are we now? In Evolution of the primate brain (eds Hofman MA, Falk D.), pp. 255–272 Amsterdam, The Netherlands: Elsevier [Google Scholar]
- 5.Holloway RL. 1983. Human paleontological evidence relevant to language behavior. Hum. Neurobiol. 2, 105–114 [PubMed] [Google Scholar]
- 6.Lieberman DE, McBratney BM, Krovitz G. 2002. The evolution and development of cranial form in Homo sapiens. Proc. Natl Acad. Sci. USA 99, 1134–1139 10.1073/pnas.022440799 (doi:10.1073/pnas.022440799) [DOI] [PMC free article] [PubMed] [Google Scholar]
- 7.Bruner E, Manzi G, Arsuaga JL. 2003. Encephalization and allometric trajectories in the genus Homo: evidence from the Neandertal and modern lineages. Proc. Natl Acad. Sci. USA 100, 15 335–15 340 10.1073/pnas.2536671100 (doi:10.1073/pnas.2536671100) [DOI] [PMC free article] [PubMed] [Google Scholar]
- 8.Holloway RL, Clarke RJ, Tobias PV. 2004. Posterior lunate sulcus in Australopithecus africanus: was Dart right? Comptes Rendus Palevol. 3, 287–293 10.1016/j.crpv.2003.09.030 (doi:10.1016/j.crpv.2003.09.030) [DOI] [Google Scholar]
- 9.de Sousa A, Cunha E. 2012. Hominins and the emergence of the modern human brain. In Evolution of the primate brain (eds Hofman MA, Falk D.), pp. 293–322 Amsterdam, The Netherlands: Elsevier; [DOI] [PubMed] [Google Scholar]
- 10.Free SL, O'Higgins P, Maudgil DD, Dryden IL, Lemieux L, Fish DR, Shorvon SD. 2001. Landmark-based morphometrics of the normal adult brain using MRI. NeuroImage 13, 801–813 10.1006/nimg.2001.0748 (doi:10.1006/nimg.2001.0748) [DOI] [PubMed] [Google Scholar]
- 11.Aldridge K. 2011. Patterns of differences in brain morphology in humans as compared to extant apes. J. Hum. Evol. 60, 94–105 10.1016/j.jhevol.2010.09.007 (doi:10.1016/j.jhevol.2010.09.007) [DOI] [PMC free article] [PubMed] [Google Scholar]
- 12.Chance SA, Crow TJ. 2007. Distinctively human: cerebral lateralisation and language in Homo sapiens. J. Anthropol. Sci. 85, 83–100 [Google Scholar]
- 13.Corballis MC. 2009. The evolution and genetics of cerebral asymmetry. Phil. Trans. R. Soc. B 364, 867–879 10.1098/rstb.2008.0232 (doi:10.1098/rstb.2008.0232) [DOI] [PMC free article] [PubMed] [Google Scholar]
- 14.Hopkins WD, Marino L, Rilling JK, MacGregor LA. 1998. Planum temporale asymmetries in great apes as revealed by magnetic resonance imaging (MRI). Neuroreport 9, 2913–2918 10.1097/00001756-199808240-00043 (doi:10.1097/00001756-199808240-00043) [DOI] [PubMed] [Google Scholar]
- 15.Hopkins WD, Pilcher DL, MacGregor L. 2000. Sylvian fissure asymmetries in nonhuman primates revisited: a comparative MRI study. Brain Behav. Evol. 56, 293–299 10.1159/000047213 (doi:10.1159/000047213) [DOI] [PMC free article] [PubMed] [Google Scholar]
- 16.Gilissen EP. 2001. Structural symmetries and asymmetries in human and chimpanzee brains. In Evolutionary anatomy of the primate cerebral cortex (eds Falk D, Gibson KR.), pp. 187–215 Cambridge, UK: Cambridge University Press [Google Scholar]
- 17.Keller SS, Roberts N, Hopkins W. 2009. A comparative magnetic resonance imaging study of the anatomy, variability, and asymmetry of Broca's area in the human and chimpanzee brain. J. Neurosci. 29, 14 607–14 616 10.1523/JNEUROSCI.2892-09.2009 (doi:10.1523/JNEUROSCI.2892-09.2009) [DOI] [PMC free article] [PubMed] [Google Scholar]
- 18.Schenker NM, Hopkins WD, Spocter MA, Garrison AR, Stimpson CD, Erwin JM, Hof PR, Sherwood CC. 2009. Broca's area homologue in chimpanzees (Pan troglodytes): probabilistic mapping, asymmetry, and comparison to humans. Cereb. Cortex 20, 730–742 10.1093/cercor/bhp138 (doi:10.1093/cercor/bhp138) [DOI] [PMC free article] [PubMed] [Google Scholar]
- 19.Spocter MA, Hopkins WD, Garrison AR, Bauernfeind AL, Stimpson CD, Hof PR, Sherwood CC. 2010. Wernicke's area homologue in chimpanzees (Pan troglodytes) and its relation to the appearance of modern human language. Proc. R. Soc. B 277, 2165–2174 10.1098/rspb.2010.0011 (doi:10.1098/rspb.2010.0011) [DOI] [PMC free article] [PubMed] [Google Scholar]
- 20.Bogart SL, Mangin J-F, Schapiro SJ, Reamer L, Bennett AJ, Pierre PJ, Hopkins WD. 2012. Cortical sulci asymmetries in chimpanzees and macaques: a new look at an old idea. NeuroImage 61, 533–541 10.1016/j.neuroimage.2012.03.082 (doi:10.1016/j.neuroimage.2012.03.082) [DOI] [PMC free article] [PubMed] [Google Scholar]
- 21.Vallortigara G, Rogers LJ. 2005. Survival with an asymmetrical brain: advantages and disadvantages of cerebral lateralization. Behav. Brain Sci. 28, 575–589, discussion 589–633 10.1017/S0140525X05000105 (doi:10.1017/S0140525X05000105) [DOI] [PubMed] [Google Scholar]
- 22.Klingenberg CP, McIntyre GS. 1998. Geometric morphometrics of developmental instability: analyzing patterns of fluctuating asymmetry with Procrustes methods. Evolution 52, 1363–1375 10.2307/2411306 (doi:10.2307/2411306) [DOI] [PubMed] [Google Scholar]
- 23.Dongen SV. 2006. Fluctuating asymmetry and developmental instability in evolutionary biology: past, present and future. J. Evol. Biol. 19, 1727–1743 10.1111/j.1420-9101.2006.01175.x (doi:10.1111/j.1420-9101.2006.01175.x) [DOI] [PubMed] [Google Scholar]
- 24.Sherwood CC, Broadfield DC, Holloway RL, Gannon PJ, Hof PR. 2003. Variability of Broca's area homologue in African great apes: implications for language evolution. Anat. Rec. 271A, 276–285 10.1002/ar.a.10046 (doi:10.1002/ar.a.10046) [DOI] [PubMed] [Google Scholar]
- 25.Fischl B, Rajendran N, Busa E, Augustinack J, Hinds O, Yeo BT, Mohlberg H, Amunts K, Zilles K. 2008. Cortical folding patterns and predicting cytoarchitecture. Cereb. Cortex 18, 1973–1980 10.1093/cercor/bhm225 (doi:10.1093/cercor/bhm225) [DOI] [PMC free article] [PubMed] [Google Scholar]
- 26.Anderson ML. 2007. Evolution of cognitive function via redeployment of brain areas. Neuroscientist 13, 13–21 10.1177/1073858406294706 (doi:10.1177/1073858406294706) [DOI] [PubMed] [Google Scholar]
- 27.Marcus DS, Wang TH, Parker J, Csernansky JG, Morris JC, Buckner RL. 2007. Open Access Series of Imaging Studies (OASIS): cross-sectional MRI data in young, middle aged, nondemented, and demented older adults. J. Cogn. Neurosci. 19, 1498–1507 10.1162/jocn.2007.19.9.1498 (doi:10.1162/jocn.2007.19.9.1498) [DOI] [PubMed] [Google Scholar]
- 28.Cointepas Y, Mangin J-F, Garnero L, Poline J-B, Benali H. 2001. BrainVISA: software platform for visualization and analysis of multi-modality brain data. NeuroImage 13, 98. 10.1016/S1053-8119(01)91441-7 (doi:10.1016/S1053-8119(01)91441-7) [DOI] [Google Scholar]
- 29.Wiley DF, et al. 2005. Evolutionary morphing. Proc. IEEE Vis. Conf., 2005, pp. 431–438. See http://graphics.idav.ucdavis.edu/research/EvoMorph [Google Scholar]
- 30.Rohlf FJ, Slice D. 1990. Extensions of the Procrustes method for the optimal superimposition of landmarks. Syst. Zool. 39, 40–59 10.2307/2992207 (doi:10.2307/2992207) [DOI] [Google Scholar]
- 31.Klingenberg CP, Barluenga M, Meyer A. 2002. Shape analysis of symmetric structures: quantifying variation among individuals and asymmetry. Evolution 56, 1909–1920 10.1111/j.0014-3820.2002.tb00117.x (doi:10.1111/j.0014-3820.2002.tb00117.x) [DOI] [PubMed] [Google Scholar]
- 32.Marroig G, Cheverud JM. 2005. Size as a line of least evolutionary resistance: diet and adaptive morphological radiation in New World monkeys. Evolution 59, 1128–1142 10.1111/j.0014-3820.2005.tb01049.x (doi:10.1111/j.0014-3820.2005.tb01049.x) [DOI] [PubMed] [Google Scholar]
- 33.Klingenberg CP. 2011. MorphoJ: an integrated software package for geometric morphometrics. Mol. Ecol. Resour. 11, 353–357 10.1111/j.1755-0998.2010.02924.x (doi:10.1111/j.1755-0998.2010.02924.x) [DOI] [PubMed] [Google Scholar]
- 34.Steppan SJ, Phillips PC, Houle D. 2002. Comparative quantitative genetics: evolution of the G matrix. Trends Ecol. Evol. 17, 320–327 10.1016/S0169-5347(02)02505-3 (doi:10.1016/S0169-5347(02)02505-3) [DOI] [Google Scholar]
- 35.Schluter D. 1996. Adaptive radiation along genetic lines of least resistance. Evolution 50, 1766–1774 10.2307/2410734 (doi:10.2307/2410734) [DOI] [PubMed] [Google Scholar]
- 36.Marroig G, Shirai L, Porto A, de Oliveira F, De Conto V. 2009. The evolution of modularity in the mammalian skull. II. Evolutionary consequences. Evol. Biol. 36, 136–148 10.1007/s11692-009-9051-1 (doi:10.1007/s11692-009-9051-1) [DOI] [Google Scholar]
- 37.Hansen TF. 2003. Is modularity necessary for evolvability? Remarks on the relationship between pleiotropy and evolvability. Biosystems 69, 83–94 10.1016/S0303-2647(02)00132-6 (doi:10.1016/S0303-2647(02)00132-6) [DOI] [PubMed] [Google Scholar]
- 38.Bastir M, Rosas A. 2009. Mosaic evolution of the basicranium in Homo and its relation to modular development. Evol. Biol. 36, 57–70 10.1007/s11692-008-9037-4 (doi:10.1007/s11692-008-9037-4) [DOI] [Google Scholar]
- 39.Martínez-Abadías N, Esparza M, Sjøvold T, González-José R, Santos M, Hernández M. 2009. Heritability of human cranial dimensions: comparing the evolvability of different cranial regions. J. Anat. 214, 19–35 10.1111/j.1469-7580.2008.01015.x (doi:10.1111/j.1469-7580.2008.01015.x) [DOI] [PMC free article] [PubMed] [Google Scholar]
- 40.Martínez-Abadías N, Esparza M, Sjøvold T, González-José R, Santos M, Hernández M, Klingenberg CP. 2012. Pervasive genetic integration directs the evolution of human skull shape. Evolution 66, 1010–1023 10.1111/j.1558-5646.2011.01496.x (doi:10.1111/j.1558-5646.2011.01496.x) [DOI] [PubMed] [Google Scholar]
- 41.Bruner E, Holloway RL. 2010. A bivariate approach to the widening of the frontal lobes in the genus Homo. J. Hum. Evol. 58, 138–146 10.1016/j.jhevol.2009.10.005 (doi:10.1016/j.jhevol.2009.10.005) [DOI] [PubMed] [Google Scholar]
- 42.Cantalupo C, Hopkins WD. 2001. Asymmetric Broca's area in great apes: a region of the ape brain is uncannily similar to one linked with speech in humans. Nature 414, 505. 10.1038/35107134 (doi:10.1038/35107134) [DOI] [PMC free article] [PubMed] [Google Scholar]
- 43.Hopkins WD, Taglialatela JP, Meguerditchian A, Nir T, Schenker NM, Sherwood CC. 2008. Gray matter asymmetries in chimpanzees as revealed by voxel-based morphometry. NeuroImage 42, 491–497 10.1016/j.neuroimage.2008.05.014 (doi:10.1016/j.neuroimage.2008.05.014) [DOI] [PMC free article] [PubMed] [Google Scholar]
- 44.Shapleske J, Rossell SL, Woodruff PWR, David AS. 1999. The planum temporale: a systematic, quantitative review of its structural, functional and clinical significance. Brain Res. Rev. 29, 26–49 10.1016/S0165-0173(98)00047-2 (doi:10.1016/S0165-0173(98)00047-2) [DOI] [PubMed] [Google Scholar]
- 45.Hopkins WD, Nir TM. 2010. Planum temporale surface area and grey matter asymmetries in chimpanzees (Pan troglodytes): the effect of handedness and comparison with findings in humans. Behav. Brain Res. 208, 436–443 10.1016/j.bbr.2009.12.012 (doi:10.1016/j.bbr.2009.12.012) [DOI] [PMC free article] [PubMed] [Google Scholar]
- 46.LeMay M. 1976. Morphological cerebral asymmetries of modern man, fossil man, and nonhuman primate. Ann. New York Acad. Sci. 280, 349–366 10.1111/j.1749-6632.1976.tb25499.x (doi:10.1111/j.1749-6632.1976.tb25499.x) [DOI] [PubMed] [Google Scholar]
- 47.Toga AW, Thompson PM. 2003. Mapping brain asymmetry. Nat. Rev. Neurosci. 4, 37–48 10.1038/nrn1009 (doi:10.1038/nrn1009) [DOI] [PubMed] [Google Scholar]
- 48.Keller SS, Crow T, Foundas A, Amunts K, Roberts N. 2009. Broca's area: nomenclature, anatomy, typology and asymmetry. Brain Lang. 109, 29–48 10.1016/j.bandl.2008.11.005 (doi:10.1016/j.bandl.2008.11.005) [DOI] [PubMed] [Google Scholar]
- 49.Ringo JL, Doty RW, Demeter S, Simard PY. 1994. Time is of the essence: a conjecture that hemispheric specialization arises from interhemispheric conduction delay. Cereb. Cortex 4, 331–343 10.1093/cercor/4.4.331 (doi:10.1093/cercor/4.4.331) [DOI] [PubMed] [Google Scholar]
- 50.Holloway RL, Broadfield DC, Yuan MS, Schwartz JH, Tattersall I. 2004. The human fossil record. Brain endocasts—the paleoneurological evidence, vol. 3 New York, NY: Wiley-Liss [Google Scholar]
- 51.Hopkins WD, Rilling JK. 2000. A comparative MRI study of the relationship between neuroanatomical asymmetry and interhemispheric connectivity in primates: implication for the evolution of functional asymmetries. Behav. Neurosci. 114, 739–748 10.1037/0735-7044.114.4.739 (doi:10.1037/0735-7044.114.4.739) [DOI] [PMC free article] [PubMed] [Google Scholar]
- 52.Singh N, Harvati K, Hublin JJ, Klingenberg CP. 2012. Morphological evolution through integration: a quantitative study of cranial integration in Homo, Pan, Gorilla and Pongo. J. Hum. Evol. 62, 155–164 10.1016/j.jhevol.2011.11.006 (doi:10.1016/j.jhevol.2011.11.006) [DOI] [PubMed] [Google Scholar]
- 53.Richtsmeier JT, Aldridge K, DeLeon VB, Panchal J, Kane AA, Marsh JL, Yan P, Cole TM. 2006. Phenotypic integration of neurocranium and brain. J. Exp. Zool. B 306, 360–378 10.1002/jez.b.21092 (doi:10.1002/jez.b.21092) [DOI] [PMC free article] [PubMed] [Google Scholar]
- 54.Waddington CH. 1942. Canalization of development and the inheritance of acquired characters. Nature 150, 563–565 10.1038/150563a0 (doi:10.1038/150563a0) [DOI] [PubMed] [Google Scholar]
- 55.Hallgrímsson B, Willmore K, Hall BK. 2002. Canalization, developmental stability, and morphological integration in primate limbs. Am. J. Phys. Anthropol. 119, 131–158 10.1002/ajpa.10182 (doi:10.1002/ajpa.10182) [DOI] [PMC free article] [PubMed] [Google Scholar]
- 56.Feldman DE. 2009. Synaptic mechanisms for plasticity in neocortex. Annu. Rev. Neurosci. 32, 33–55 10.1146/annurev.neuro.051508.135516 (doi:10.1146/annurev.neuro.051508.135516) [DOI] [PMC free article] [PubMed] [Google Scholar]
- 57.Sterner KN, et al. 2012. Dynamic gene expression in the human cerebral cortex distinguishes children from adults. PLoS ONE 7, e37714. 10.1371/journal.pone.0037714 (doi:10.1371/journal.pone.0037714) [DOI] [PMC free article] [PubMed] [Google Scholar]
- 58.Somel M, Liu X, Khaitovich P. 2013. Human brain evolution: transcripts, metabolites and their regulators. Nat. Rev. Neurosci. 14, 112–127 10.1038/nrn3372 (doi:10.1038/nrn3372) [DOI] [PubMed] [Google Scholar]
- 59.Miller DJ, et al. 2012. Prolonged myelination in human neocortical evolution. Proc. Natl Acad. Sci. USA 109, 16 480–16 485 10.1073/pnas.1117943109 (doi:10.1073/pnas.1117943109) [DOI] [PMC free article] [PubMed] [Google Scholar]
- 60.VanEssen DC. 1997. A tension-based theory of morphogenesis and compact wiring in the central nervous system. Nature 385, 313–318 10.1038/385313a0 (doi:10.1038/385313a0) [DOI] [PubMed] [Google Scholar]
- 61.White T, Hilgetag CC. 2008. Gyrification and development of the human brain. In Handbook of developmental cognitive neuroscience (eds Nelson CA, Luciana M.), pp. 39–50 Cambridge, MA: MIT Press [Google Scholar]
- 62.White T, Su S, Schmidt M, Kao C-Y, Sapiro G. 2010. The development of gyrification in childhood and adolescence. Brain Cogn. 72, 36–45 10.1016/j.bandc.2009.10.009 (doi:10.1016/j.bandc.2009.10.009) [DOI] [PMC free article] [PubMed] [Google Scholar]
- 63.Lohmann G, Cramon DY, von & Steinmetz H. 1999. Sulcal variability of twins. Cereb. Cortex 9, 754–763 10.1093/cercor/9.7.754 (doi:10.1093/cercor/9.7.754) [DOI] [PubMed] [Google Scholar]
- 64.Thompson PM, et al. 2001. Genetic influences on brain structure. Nat. Neurosci. 4, 1253–1258 10.1038/nn758 (doi:10.1038/nn758) [DOI] [PubMed] [Google Scholar]
- 65.Habas PA, Scott JA, Roosta A, Rajagopalan V, Kim K, Rousseau F, Barkovich AJ, Glenn OA, Studholme C. 2012. Early folding patterns and asymmetries of the normal human brain detected from in utero MRI. Cereb. Cortex. 22, 13–25 10.1093/cercor/bhr053 (doi:10.1093/cercor/bhr053) [DOI] [PMC free article] [PubMed] [Google Scholar]
- 66.Fitch WT. 2012. Evolutionary developmental biology and human language evolution: constraints on adaptation. Evol. Biol. 39, 613–637 10.1007/s11692-012-9162-y (doi:10.1007/s11692-012-9162-y) [DOI] [PMC free article] [PubMed] [Google Scholar]
- 67.Hopkins WD, Russell JL, Cantalupo C. 2007. Neuroanatomical correlates of handedness for tool use in chimpanzees (Pan troglodytes) implication for theories on the evolution of language. Psychol. Sci. 18, 971–977 10.1111/j.1467-9280.2007.02011.x (doi:10.1111/j.1467-9280.2007.02011.x) [DOI] [PMC free article] [PubMed] [Google Scholar]
- 68.Rosenberg KR. 1992. The evolution of modern human childbirth. Am. J. Phys. Anthropol. 35, 89–124 10.1002/ajpa.1330350605 (doi:10.1002/ajpa.1330350605) [DOI] [Google Scholar]
- 69.Dunsworth HM, Warrener AG, Deacon T, Ellison PT, Pontzer H. 2012. Metabolic hypothesis for human altriciality. Proc. Natl Acad. Sci. USA 109, 15 212–15 216 10.1073/pnas.1205282109 (doi:10.1073/pnas.1205282109) [DOI] [PMC free article] [PubMed] [Google Scholar]
- 70.Sherwood CC, Subiaul F, Zawidzki TW. 2008. A natural history of the human mind: tracing evolutionary changes in brain and cognition. J. Anat. 212, 426–454 10.1111/j.1469-7580.2008.00868.x (doi:10.1111/j.1469-7580.2008.00868.x) [DOI] [PMC free article] [PubMed] [Google Scholar]
- 71.Jablonka E, Lamb MJ. 2005. Evolution in four dimensions: genetic, epigenetic, behavioral, and symbolic variation in the history of life. Cambridge, MA: MIT Press [Google Scholar]