Abstract
A fragment-based fractional number of electron (FNE) approach, is developed to study entire electron transfer (ET) processes from the electron donor region to the acceptor region in condensed phase. Both regions are described by the density-fragment interaction (DFI) method while FNE as an efficient ET order parameter is applied to simulate the electron transfer process. In association with the QM/MM energy expression, the DFI-FNE method is demonstrated to describe ET processes robustly with the Ru2+-Ru3+ self-exchange ET as a proof-of-concept example. This method allows for systematic calculations of redox free energies, reorganization energies, and electronic couplings, and the absolute ET rate constants within the Marcus regime.
1. Introduction
Electron transfer (ET) process is one of the fundamental processes in chemistry, biochemistry, and material science.1 The Marcus theory for electron transfer characterizes the ET rate constant as,2
| (1) |
where HDA is the donor-acceptor electronic coupling, the symbol <…> denotes the thermal average, λ is the reorganization energy, ΔG is the ET reaction free energy, kB is Boltzmann's constant, and T is the temperature (298K in this work). Although the Marcus theory is semiclassical and is based on transition-state theory, which assumes weak coupling and slow solvation limit,3 it has been applied successfully to elucidate and compute the ET rate constants for many chemical systems.4-7 As such, accurate calculations of each term in eq. 1 are pivotal to facilitate the understanding of the ET process with atomistic and electronic details. To calculate the parameters, e.g. <H2DA>, ΔG, and λ, for ET processes, many methods have been developed using empirical,8,9 semiclassical or quantum mechanical models,10-18 and classical19-24 or density functional based MD simulations.25-47 A more detailed discussion of these works is beyond the scope of this work but has been summarized in a number of reviews.48-55 We note that only few practical ab initio method,37,43 using constrained density functional theory (DFT)56 or time dependent DFT, have been proposed to systematically compute the key terms: <H2DA>, ΔG, λ, and the final ET rate constant. Usually, these terms are calculated using different schemes. For instance, to obtain the ensemble average of H2DA, classical molecular mechanical (MM) molecular dynamics (MD) simulations are frequently performed to explore the conformational ensemble of either the product or reactant state, without sampling the adiabatic ET transition state. For ΔG and λ, methods using a combination of QM treatment and continuum model have been commonly employed to approximate the explicit environments, but they inevitably miss some details of the environments, including entropic, dynamic and conformational contributions, which are especially important for protein systems.18,27 In order to reach a theoretical estimation of kET, one must combine various schemes, and ensure each scheme can yield results directly comparable to experiments. Therefore, developing a systematic method is still important for understanding the microscopic kinetics, thermodynamics, and mechanism of ET processes at the atomistic and electronic level.
A challenging task for theoretical simulations on kET is how to balance the computational cost and accuracy. The hybrid quantum mechanical and molecular mechanical (QM/MM) method becomes a very promising tool to simulate the ET process: QM describes the region involving electron transfer while the rest of the system is simulated by MM. In our previous work, we demonstrated that using the fractional number of electron (FNE) as the order parameter in the “on-the-fly” QM/MM simulations,57 the redox potential residing in ΔG could be computed accurately and the ET half reaction processes could be characterized as well. When combined with the QM/MM minimum free energy path (MFEP) method,58,59 the resulted QM/MM-MFEP/FNE can simulate the ET half reactions for organic molecules and proteins because of the efficiency gained.60 However, the FNE approach has been limited to study of the ET half reaction rather than the entire ET process from the electron donor region to the acceptor region. As such, the electronic coupling term or reorganization energy term of ET cannot be computed readily using FNE.
In this work, we combine the density-fragment interaction (DFI) method with FNE (i.e., DFI-FNE) to simulate the entire ET transfer process in association with “on-the-fly” QM/MM simulations. DFI method, based on the Kohn-Sham density functional theory (KS-DFT), was originally developed to achieve the linear scaling of computational cost with respect to the growing system size.61 In particular, we reformulated DFI to reduce the computational cost and make it applicable for large molecular systems.62 For instance, we demonstrated that our new DFI method can simulate the thermodynamic properties of liquid water efficiently and accurately. DFI is essentially the simplest divide-and-conquer (DAC)63,64 method without any buffer region, but with frozen fragment pseudopotentials. In DFI, the entire QM system is first divided into small fragments, then each fragment is computed independently, and the desired properties of the entire system are evaluated using the solved fragment information. Interestingly, the fragmentation process can be viewed as the electron localization step. For each fragment in DFI, the number of electrons is fixed and localized in its own region. Therefore, we can gradually move one electron from one fragment to another fragment using FNE as the order parameter to simulate the entire ET process while the environment can be simulated by MM.
This paper is organized as follows. We first briefly review the DFI and FNE approaches and introduce the combined DFI-FNE QM/MM scheme for ET simulations. In Sec. 3, we show the computational details of our simulations on the Ru2+–Ru3+ self-exchange ET process in aqueous solution as a simple but essential testing case. In Sec. 4, we elucidate how to compute <H2DA>, ΔG, and λ to obtain kET and discuss some challenging issues related to the accuracy. Finally, we conclude our work in Sec. 5.
2. Methods
2.1 Density Fragment Interaction (DFI) Approach
Briefly, we reformulated the DFI energy expression as,
| (2) |
Here, and ρi is the electron density of fragment i. is the self-energy of fragment i,
| (3) |
is the electrostatic interaction energy between fragments,
| (4) |
NF is the number of fragments in the system and ni is the number of atoms in fragment i. is the nucleic charge of atom a in fragment i, and is the corresponding nucleic position. In our new DFI reformulations, we introduced , the frozen fragment pseudopotential for atom j, which takes the Pauli repulsive interactions among fragments into account and approximated , using the simple ESP charges. Note that the frozen fragment pseudopotential depends on atomic type and needs to be fitted using a set of training molecules. In this work, we fitted the Pauli parameters for Ru, O, and H with BLYP/Lanl2dz using the fitting protocol described in Ref 62. The finial parameters used in this work is listed in SI Table S1. Note that these parameters are negligible when the edge-edge distance between donor and acceptor groups is beyond 5 Å.62
2.2 Fractional Number of Electron (FNE) Approach
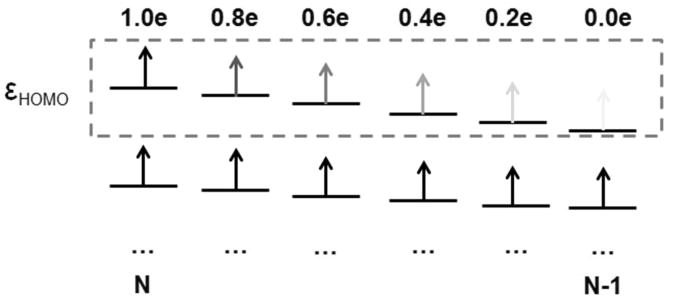
The FNE approach is illustrated in Fig. 1 for removing one electron from the electron donor group to simulate the ET half reaction,
Figure 1.
Schematic view of FNE procedure.
| (5) |
Here, FNE is the order parameter to drive the system from one state to the other to achieve the sufficient sampling of free energy. In contrast to mix two potential energy functions to describe the transition from one state to the other,28,29,31,33 FNE gradually changes the number of electrons in the system, which only requires one QM calculation for a given conformation. Fig. 1 shows that the number of electron on HOMO denoted by η is gradually decreased from 1.0 to 0.0. According to the Janak theorem65 and its extension to generalized Kohn-Sham calculations in our recent work,57,66 the energy derivative with respect to the number of electron (expressed as the frontier occupation number) is
| (6) |
for both Kohn-Sham calculations with explicit density functionals and generalized Kohn-Sham calculations with orbital functional.47,56 Thus, the free energy change (i.e., oxidation free energy) of eq. 5 can be readily computed by thermodynamic integration (TI),
| (7) |
The FNE-TI approach has been applied successfully to compute the redox potential of metal ion in aqueous solution. In addition, the reorganization energy of the half reaction and activation free energy of the full reaction (assuming two reaction centers do not interact with each other) can be calculated by reusing the sampled trajectories using the energy gap ΔE as the reaction coordinate.57
2.3 Combined DFI-FNE QM/MM Simulations for Full ET Reactions
To simulate the realistic ET reaction process, the previous half reactions studied by FNE are not satisfactory since the electron must be driven from the donor to the acceptor to characterize the ET mechanism with both donor and acceptor groups present. Here, we combine the DFI method with FNE and TI to simulate the full ET process. In this work, we focus on using a simple ET reaction of Ru3+ and Ru2+ self-exchange in aqueous solution to demonstrate how DFI-FNE works,
| (8) |
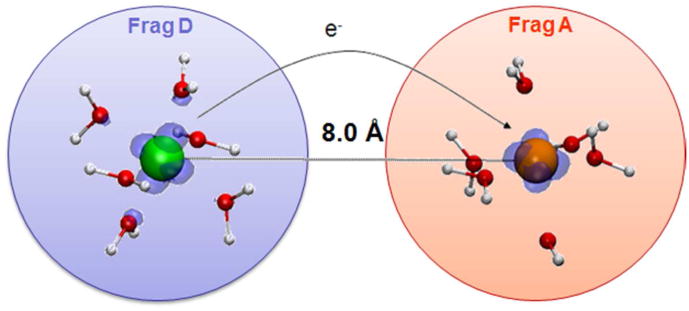
As shown in Fig. 2, for a given distance between two ruthenium metal centers, each hydrated Ru is one independent fragment in DFI. As such, it is natural to use FNE as the order parameter to drive the electron from one Ru to the other since the number of electrons in each fragment can be specified (i.e., the electrons are naturally localized within fragments). Therefore, the free energy change of the full ET reaction such as eq. 7 can be obtained by TI,
Figure 2.
Schematic view of DFI-FNE procedure for the Ru2+-Ru3+ self-exchange ET process.
| (9) |
where is the HOMO energy of fragment D and is the HOMO energy of fragment A. Note that the HOMO becomes LUMO in fragment D at the finial state while the LUMO becomes HOMO in fragment A after the fractional electron is moved from fragment D to fragment A. ΔA vanishes in the specific self-exchange ET, but finite free energy differences are also allowed in this method for general cases.
By analyzing the sampled DFI-FNE trajectories, we can compute and λ required in eq. 1 using the consistent DFI QM/MM energy expression without introducing any ad hoc parameter. The reorganization energy λ can be readily evaluated by using the energy gap as the reaction coordinate.19 For HDA, we apply the fragment orbital approach combined with DFI. The frontier molecular orbitals for each fragment can be extracted and taken as the donor and acceptor orbital (i.e.,φD and φA) to compute HDA67,
| (10) |
where TDA =〈φD|F̂φA〉, TDD = 〈φD|F̂φD〉, TAA = 〈φA|F̂φA〉, and SDA = 〈φD|φA〉. The operator F̂ is the Fock operator that is constructed from the density of the entire system ρ without fragmentations. Total density ρ is the summation of converged fragmental densities ρD and ρA obtained from self-consistent DFI calculations. Note that our coupling calculations are similar to the FO-DFT used in a previous work.39 However, the DFI frontier molecular orbitals are used here, rather than the CDFT wave functions,39,40 to represent the two diabatic states for donor and acceptor, respectively. In order to obtain HDA with consistent relative phases between donor and acceptor orbital, we adjust the signs of the donor and acceptor orbital, respectively, in each MD snapshot as the same as the signs in the first snapshot.
The Ru3+ and Ru2+ self-exchange ET process is simple but extremely challenging. Normal QM computations with both ions are even hardly converged due to electronic state degeneracy and delocalization errors of functionals.68-70 Moreover, the ET rate constant of Ru3+ and Ru2+ self-exchange process requires the extensive sampling with different Ru3+ and Ru2+ distances. Hence, the final rate constant need to be computed and integrated as,71
| (11) |
where G(r) is the potential of mean force for the two reactant complexes in solution that determines the pair distribution of the donor and acceptor. We will elucidate how DFI-FNE can be applied in this case and what are challenges in DFI-FNE.
3. Computational Details
The self-exchange redox couple was simulated by the DFI method with two individual fragments. The initial geometries of the two Ru complexes were built 10.0 Å apart, then solvated using TIP3P explicit solvent model in a cubic water box with the side length of 64 Å. A harmonic restraint was applied on the two Ru atoms with the equilibrium distance of 10.0 Å and the force constant of 100 kcal/mol/Å2 . The separation distances were then sequentially reduced to 6.0 Å with the increment of 1.0 Å in a series of MD simulations that generated the initial geometries of Ru2+–Ru3+ at different distances. Since the radius of the aqueous Ru2+/3+ complexes are determined to be 5.5-6 Å, system with separation distance less than 6 Å would cause significant electronic coupling between the donor and acceptor, undermining the decoupled assumption in DFI. Thus, DFI calculations with separation distance less than 6 Å is avoided. The system was equilibrated for 16 ps with a timestep of 1 fs using the NVT ensemble, with a reduced restraining force constant of 10 kcal/mol/Å2. In the following production MD, the simulation timescale is 16 ps for each separation distance, with 1000 snapshots recorded to compute the HDA and reorganization energies. The DFI method with BLYP/LanL2DZ was used for the QM subsystem in the production MD, and BLYP/LanL2DZ(Ru)+6-31+G*(H2O) was used in the calculation of HDA. Classical MM MD umbrella samplings with force field parameters adapted from Ref.34 were performed to obtain the potential mean force (PMF) of the Ru-Ru distance with a force cut-off of 16 Å combined with Particle Mesh Ewald method, since the long range electrostatic interactions caused by periodic boundary condition (PBC) have not been incorporated in our QM/MM simulations. These long range interactions are important to compute the PMF profile for two ions.44,72,73 In the PMF umbrella sampling, restraining potential of 5 kcal/mol/Å2 were used to increase the overlap between sampling windows, generating an average of standard deviations of 0.35 Å for Ru-Ru distance. The window interval of 0.5 Å were used to cover the distances ranging from 5.5 Å to 16 Å and 160 ps MD was carried out for each window. Weighted histogram analysis method was used to reconstruct the PMF.74
4. Results and Discussion
4.1 Oxidation free energy
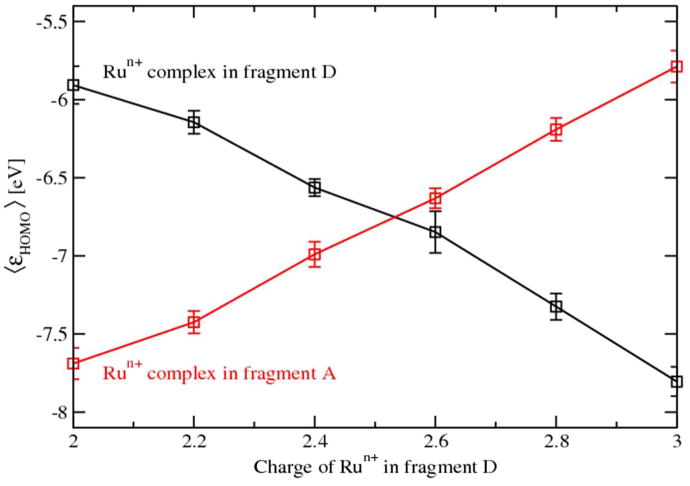
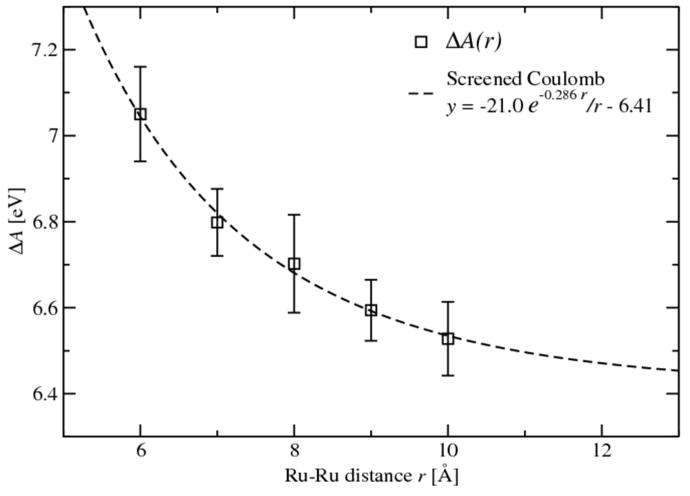
The absolute oxidation free energies were obtained by integrating the ensemble averages of eigenvalues of HOMO 〈εHOMO〉 of the Ru complexes according to Eq. 6. Fig. 3 shows a profile of 〈εHOMO〉 at different FNE of the Ru–Ru couple at the separation distance of 7.0 Å. The self-exchange ET reaction shows a symmetric profile of the two 〈εHOMO〉 series. The integrations of the two curves generate the absolute oxidation free energies for the two fragments of 6.75 eV and 6.79 eV, with a difference of 0.04 eV. The average discrepancy of the oxidation free energy between the two self-exchange fragments is 0.03 eV over various separation distances, which is entirely due to the convergence in of the statistical sampling One may note that the absolute oxidation free energies of the aqueous Ru complex obtained in the full ET scheme are remarkably higher than that calculated in the half ET reaction (4.96 eV).57 The shift of the oxidation free energies is mainly caused by the electrostatic field exerted by the second Ru complex in proximity. The presences of the two positively charged Ru complexes raise the electrostatic potential on each other thus make them stronger oxidizers. As shown in Fig. 4, we plot the oxidation free energies as a function of separation distance. The oxidation free energies decay from 7.05 eV at r = 6.0 Å to 6.50 eV at r = 10.0 Å, which fit well to the screened Coulomb potential shown in dashed line. Note that when long range electrostatic interactions are considered, the oxidation free energies may be lower.
Figure 3.
Symmetrical redox profile of the self-exchange ET reaction (Ru – Ru distance of 7.0 Å is shown). Values of <εHOMO> are obtained in DFI simulations and the error bars show the statistic uncertainties. Integration of each <εHOMO> curve generates the oxidation free energy of the corresponding Ru complex.
Figure 4.
Distance dependence of oxidation free energies of Ru complexes. The calculated results are shown in black square with error bars showing the sampling uncertainties, and the dashed line is fitted to screened Coulomb potential.
4.2 Reorganization energy
The reorganization is a key factor that determines the rate constant and the mechanism of an ET process. Based on the DFI method, we can obtain the reorganization energy of the full ET process by projecting the diabatic free energy profiles over the energy gap similarly to the procedure in a half ET reaction.57 The essential difference is that the energy gap of the full ET reaction is the energy difference between the swapped electronic states of the redox couple, i.e.
| (12) |
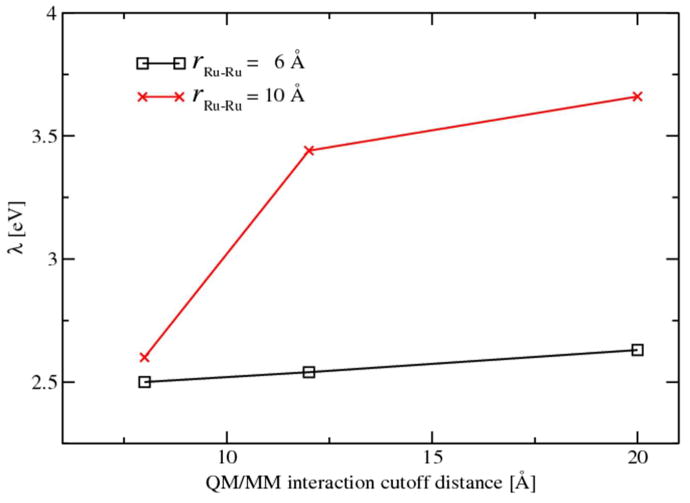
Because the QM/MM electrostatic interaction cutoff is used in the DFI simulations, we investigated the influence of the choice of different cutoff radius on the final values of the reorganization energies. We chose two extreme separation distances, 6.0 Å and 10.0 Å to represent the two scenarios of close proximity and long ET distance. For each separation distance, the cutoff distance of 8.0 Å, 12.0 Å and 20.0 Å were examined and the corresponding reorganization energies are shown in Fig. 5. As we can see, the choice of the cutoff distance does not affect the reorganization energy of the Ru-Ru couple at close proximity while the electrostatic cutoff shows significant impact on the Ru-Ru couple at long distance. The increased separation distance between the two charged Ru complexes leads to disturbed solvent distributions in a larger region and thus requires larger QM/MM interaction cutoff. Furthermore, a comparison of the reorganization energies of the five various separation distances between the choice of 12.0 Å and 20.0 Å cutoffs are shown in Fig. S2 and summarized in Table S2. Reorganization energies obtained using the cutoff of 20.0 Å generally show about 0.1 eV discrepancy compared to the results obtained using 12.0 Å. The λ convergence at 20.0 Å cutoff is also in agreement with our previous work on half ET reactions where detailed convergence tests were performed. Therefore, the cutoff distance is set to 20.0 Å in the production runs of DFI simulations.
Figure 5.
Influence of QM/MM electrostatic cutoff distance on reorganization energies.
The individual diabatic free energy profiles showing the reorganization energies at difference separation distances are plotted in Fig. S1, and the values of the reorganization energies are summarized in Table 1. In addition to the total reorganization energies, λ can also be decomposed to inner and outer shell reorganization energies by re-evaluating the sampled energies in the absence of solvent molecules.57 As an example of Ru couple at r = 8.0 Å, the inner shell diabatic ET surfaces were constructed as shown in Fig. S3, which generates the inner shell reorganization energy of 0.69 eV. Based on the total reorganization energy of 3.13 eV, we can derive that the outer shell contribution is 2.44 eV, which is the major part of the reorganization energy in the Ru2+-Ru3+ self-exchange ET reaction. This suggests that the outer shell reorganization plays important roles to determine the total reorganization energy since two hydrated ions are rigid during ET.
Table. 1. Reorganization energies, HDA and kET at different Ru-Ru distance.
| r/Å | <H2DA>1/2/eV | λ(rcutoff=20 Å)/eV | kET/M-1s-1 | λscaled/eV | kET (λscaled)/s-1a |
|---|---|---|---|---|---|
| 6.0 | 2.03E-03 | 2.63 | 3.81E-01 | 1.66 | 5.88E+03 |
| 7.0 | 3.33E-04 | 2.97 | 3.59E-04 | 1.87 | 1.87E+01 |
| 8.0 | 1.07E-04 | 3.23 | 2.89E-06 | 2.03 | 3.80E-01 |
| 9.0 | 3.75E-05 | 3.40 | 6.71E-08 | 2.14 | 1.62E-02 |
| 10.0 | 1.66E-05 | 3.66 | 1.02E-09 | 2.31 | 6.28E-04 |
The free energy difference of the self-exchange process (ΔA) is rounded to zero in the calculations of kET.
We noticed that the reorganization energies calculated using our QM/MM method are consistently overestimated.57 In the comparison of other simulations on the same self-exchange process, we find that the lack of polarizable solvent model is an important reason for the overestimation.20,24,34 The simulations with solvent polarization generate relatively lower and more accurate reorganization energies.36,37,41 In addition, the lack of PBC in QM calculations may also contribute to the error in the reorganization energies. Since the reorganization energy has an exponential dependence on ET rate kET (for self-exchange reactions with zero redox free energy), we here rescaled the reorganization energy to reduce the errors due to the lack of solvent polarization and PBC with the scaling coefficient 0.63, which was the determined from the ratio of the reorganization energy of a single Ru complex (2.45 eV) from our previous work57 to the experimental estimation (1.54 eV).12
4.3 Electronic coupling
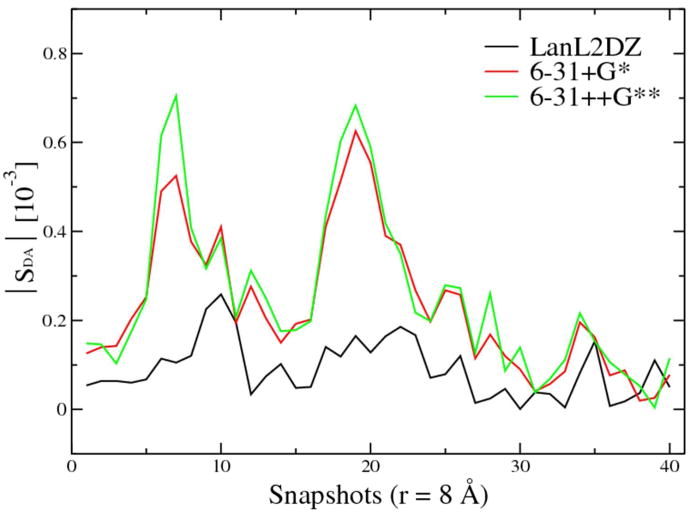
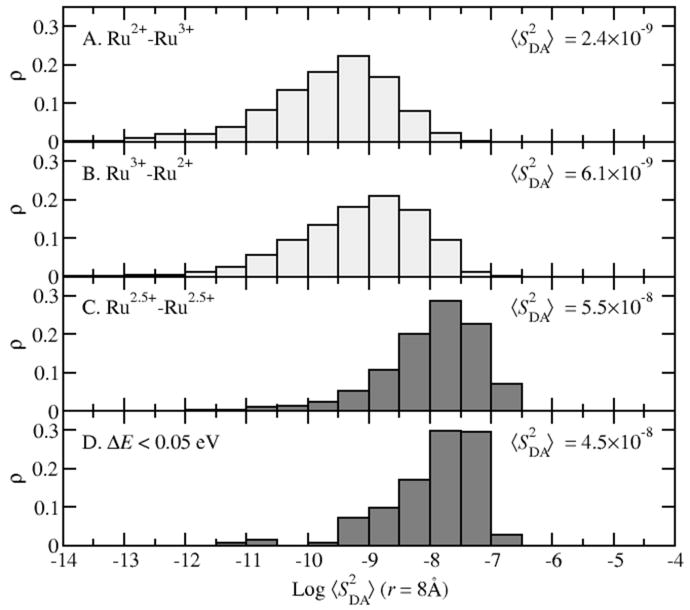
To calculate the ET rate, the electronic coupling HDA needs to be determined. According to our DFI scheme, we computed the electronic coupling using the fragment orbital approximation (Eq. 10). Since the calculation of HDA involves the molecular orbital overlap SDA, we examined the basis set dependence of SDA. The basis set LanL2DZ is used in the direct MD sampling to achieve affordable cost for the “on-the-fly” DFI-FNE/MM calculations. Based on the MD trajectories, we re-evaluated the SDA of each snapshots using larger basis sets, 6-31+G* and 6-31++G**. The comparison of |SDA| among different basis sets is shown in Fig. 6. The other two large basis sets show good agreement with each other, indicating the convergence of the size of the basis set; however, the small basis set LanL2DZ is obviously not sufficient to calculate accurately the orbital overlap SDA and the electronic coupling HDA. As such, we choose the 6-31+G* in the calculations of HDA to balance the computational cost and the accuracy. In addition, we analyzed SDA in different ET reaction regions by comparing the ensemble averages of S2DA obtained from samplings at different electronic states as shown in Fig. 7. Based on the conformational trajectories of reactant and product states, the values of <S2DA> at the reaction endpoints are about 10-9, which is one order of magnitude smaller than the ensemble averages obtained for the diabatic transition state (∼10-8) where ΔE < 0.05 eV. Although the FNE state with even distribution of electron on donor and acceptor (Ru2.5+–Ru2.5+) restrains the system near the transition state (<ΔE>=0.002 eV), it still allows thermal fluctuations of the solvent dynamics and shows standard deviation of ΔE to be 0.37 eV. Therefore the ensemble of Ru2.5+–Ru2.5+ is not the strict diabatic transition state ensemble (defined as |ΔE| < 0.05 eV). Interestingly, as shown in Fig. 7, the statistics of <S2DA> are almost identical for the two ensembles, indicating that the FNE state is a good approximation to the diabatic ET transition state.
Figure 6.
Basis set dependence of |SDA| using LanL2DZ, 6-31+G*, and 6-31++G**. Convergence is achieved at 6-31+G*.
Figure 7.
Distribution of <S2DA> in various electronic states: A. reactant state (light gray); B. product state (light gray); C. adiabatic FNE state with even electron distribution (dark gray); D. diabatic transition state with energy gap criterion of ΔE<0.05 eV (dark gray). Ensemble average value of <S2DA> show about one order of magnitude increase in the transition state compared to the reactant or product state.
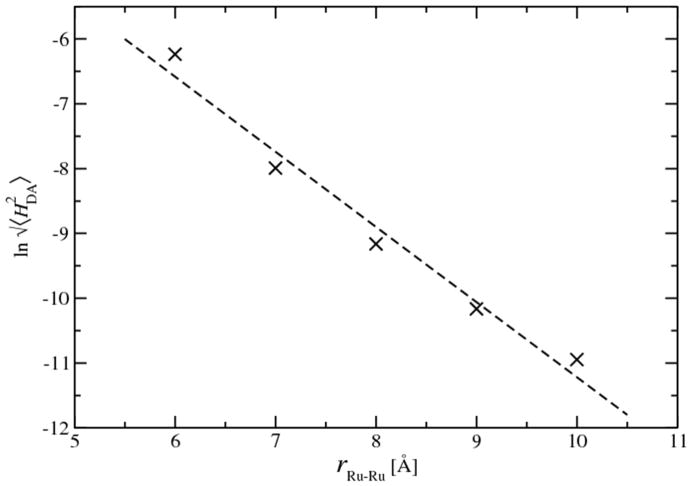
Strictly, the electronic coupling HDA between the donor and acceptor fragments should also be computed at the transition states, the cross region where the energy gap is zero. Thus, only the snapshots with the energy gaps less than 0.05 eV were used to compute the ensemble averages of HDA. The final values of HDA for Ru couple at different separation distances were summarized in Table 1. The distance dependence of HDA was analyzed and fitted to exponential distance dependence|HDA| = Aexp[‒βr/2], with the distance decay constant β/2 = 1.16 Å‒1, as shown in Fig. 8. Previous simulations on the same ET process reported similar values and distance dependent decay rate of HDA.37 The distance decay rate constant in our simulations agrees with the estimation in aqueous Fe2+–Fe3+ self-exchange (β/2=12 Å-1),71 and it is significantly larger than those in protein environments (β/2 = 0.55 Å-1).75 This is not surprising because the Ru2+–Ru3+ self-exchange in aqueous solution does not have a specific “bridge” but dynamic water molecules that mediate the ET,76 hence the ET rate decays much faster when the separation distance increases.
Figure 8.
Distance dependence of HDA (black cross). Linear regression (dashed-line) generates the slope of 1.16, which leads to the decay constant β of 2.32 Å-1 . (6-31+G* basis set is used to calculate HDA.)
4.4 ET rate kET and total reaction rate k of Ru2+–Ru3+ self-exchange
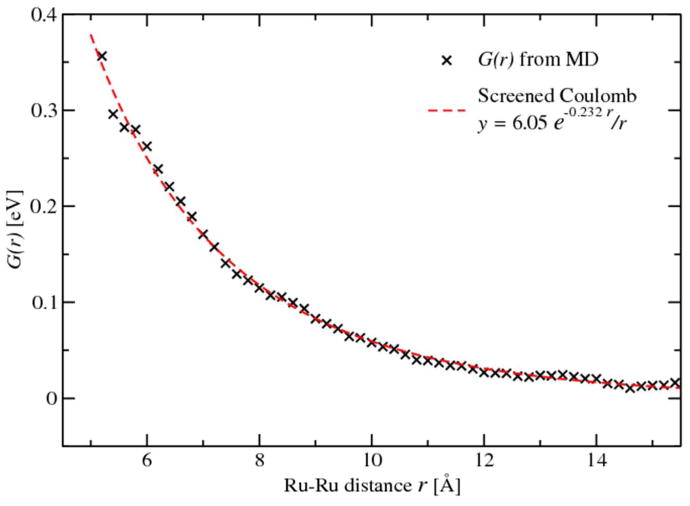
With the redox free energy ΔG, the reorganization energy λ and the electronic coupling HDA obtained individually, we can calculate the ET rate kET according to Eq. 1. The values of kET calculated using both the native and rescaled reorganization energies at different separation distances were summarized in Table 1. The ET rates kET are greatly promoted using the rescaled reorganization energies. With all the distance dependences, we can finally compute the total reaction rate k by integrating the ET rate kET over the space following Eq. 11, where kET are averaged with the Ru–Ru pair distribution e-G(r)/kBT at the corresponding separation distance. The distance dependence of the intermolecular interactions G(r) sampled by classical MD simulations is shown in Fig. 9. The intermolecular interactions G(r) agrees with a previous simulation results37 and fits nicely the screened Coulomb potential shown in dashed line. The baseline of G(r) was offset to zero at r=∞. Spherical integration of the weighted kET generates the total rate constant of the self-exchange ET reaction between Ru2+-Ru3+ couple as k = 0.11 M-1 S-1 . Before we can directly compare the computed rate constant to experimental measurements, the effect of nuclear tunneling over the activation barrier and the ionic strength must be considered. In the aqueous Fe2+–Fe3+ self-exchange, the nuclear tunneling introduces a rate enhancement factor of about 10,2,22,34 based on different water models. This increases the total rate constant k for about one order of magnitude. In addition, the high ionic concentration in acidic solution may increase the measured ET rate. The overall effect of finite ionic strength (5M) was reported to promote the rate by about two orders of magnitude compared to infinite dilution limit.37 Considering the ∼103 enhancement due to the quantum tunneling and ionic strength, the total rate of 0.11 M-1 S-1 in our simulation is scaled to 1×10² and shows good agreements with the experimental observation of 20 M-1 s-1.77
Figure 9.
PMF along Ru-Ru distance from classic MD simulations. Simulation results of the Ru–Ru interaction (black cross) behave like a screened Coulomb potential (fitted as red dashed-line).
5. Conclusions
In this work, we developed the DFI-FNE QM/MM approach to study the full ET reaction. The new method allows us to calculate the redox free energies and reorganization energies of the donor and acceptor simultaneously and generates the redox free energy and diabatic free energy surface of the full ET reaction. Combined with fragment-orbital approach, the electronic couplings between the donor and acceptor can be readily computed by the DFI scheme. As such, the absolute the ET rate constant kET can be obtained without introducing ad hoc parameters using DFI-FNE. This approach should have significant impact on computing the ET rate constants for chemical and biological systems.
To further improve the accuracy, the long-range electrostatic interactions need to be considered. In addition, how to improve the solvent description is also important to obtain accurate reorganization energy. For instance, the MM model in DFI-FNE QM/MM significantly overestimates λ. More importantly, many other factors in electrochemical experiments, e.g. pH dependence, ion strength, interfacial effects, can prevent good agreement between theoretical predictions and experimental measurements. The difference between physiological environment and in vitro experiments introduce further complications in understandings of many important biochemical ET reactions. Further studies related to these issues will be investigated in our group.
Supplementary Material
Acknowledgments
Supports from the National Institute of Health (NIH R01-GM061870 to W.Y.; P50GM067082 to X. H.) are greatly appreciated. X. H. thanks to the UNC EFRC: Solar Fuels and Next Generation Photovoltaics, an Energy Frontier Research Center funded by the U.S. Department of Energy, Office of Science, Office of Basic Energy Sciences under Award Number DE-SC0001011. X.H. thanks the 2010 HPC Advisory Council University Award and personally thanks the helps from Pak Lui. We thank Prof. Spiros S. Skourtis for his helpful comments. We also thank KillDevil computing resources at UNC.
Footnotes
Author Contributions: The manuscript was written through contributions of all authors. All authors have given approval to the final version of the manuscript.
Notes: The authors declare no competing financial interest.
Supporting Information: Figure. S1, S2, S3 and Table S1, S2, S3. This material is available free of charge via the Internet at http://pubs.acs.org.
References
- 1.Marcus RA, Sutin N. Biochimica et Biophysica Acta (BBA) - Reviews on Bioenergetics. 1985;811:265. [Google Scholar]
- 2.Song X, Marcus RA. J Chem Phys. 1993;99:7768. [Google Scholar]
- 3.Han P, Xu RX, Li B, Xu J, Cui P, Mo Y, Yan J Phys Chem B. 2006;110:11438. doi: 10.1021/jp062133y. [DOI] [PubMed] [Google Scholar]
- 4.Newton MD, Sutin N. Annu Rev Phys Chem. 1984;35:437. [Google Scholar]
- 5.Hopfield JJ, Onuchic JN, Beratan DN. Science. 1988;241:817. doi: 10.1126/science.241.4867.817. [DOI] [PubMed] [Google Scholar]
- 6.Beratan DN, Betts JN, Onuchic JN. Science. 1991;252:1285. doi: 10.1126/science.1656523. [DOI] [PubMed] [Google Scholar]
- 7.Onuchic JN, Beratan DN, Winkler JR, Gray HB. Annu Rev Biophys Biomol Struct. 1992;21:349. doi: 10.1146/annurev.bb.21.060192.002025. [DOI] [PubMed] [Google Scholar]
- 8.Beratan DN, Onuchic JN, Betts JN, Bowler BE, Gray HB. J Am Chem Soc. 1990;112:7915. [Google Scholar]
- 9.Beratan D, Onuchic J, Winkler, Gray H. Science. 1992;258:1740. doi: 10.1126/science.1334572. [DOI] [PubMed] [Google Scholar]
- 10.Brown GM, Sutin N. J Am Chem Soc. 1979;101:883. [Google Scholar]
- 11.Brunschwig BS, Logan J, Newton MD, Sutin N. J Am Chem Soc. 1980;102:5798. [Google Scholar]
- 12.Brunschwig BS, Creutz C, Macartney DH, Sham TK, Sutin N. Faraday Discussions of the Chemical Society. 1982;74:113. [Google Scholar]
- 13.Ratner MA. J Phys Chem. 1990;94:4877. [Google Scholar]
- 14.Mujica V, Kemp M, Ratner MA. J Chem Phys. 1994;101:6849. [Google Scholar]
- 15.Davis WB, Wasielewski MR, Ratner MA, Mujica V, Nitzan A. J Chem Phys A. 1997;101:6158. [Google Scholar]
- 16.Segal D, Nitzan A, Davis WB, Wasielewski MR, Ratner MA. J Chem Phys B. 2000;104:3817. [Google Scholar]
- 17.Senthilkumar K, Grozema FC, Guerra CF, Bickelhaupt FM, Lewis FD, Berlin YA, Ratner MA, Siebbeles LDA. J Am Chem Soc. 2005;127:14894. doi: 10.1021/ja054257e. [DOI] [PubMed] [Google Scholar]
- 18.Milischuk AA, Matyushov DV, Newton MD. Chem Phys. 2006;324:172. [Google Scholar]
- 19.Warshel AJ. Phys Chem. 1982;86:2218. [Google Scholar]
- 20.Kuharski RA, Bader JS, Chandler D, Sprik M, Klein ML, Impey RW. J Chem Phys. 1988;89:3248. [Google Scholar]
- 21.Zichi DA, Ciccotti G, Hynes JT, Ferrario M. J Phys Chem. 1989;93:6261. [Google Scholar]
- 22.Bader JS, Kuharski RA, Chandler D. J Chem Phys. 1990;93:230. [Google Scholar]
- 23.Gehlen JN, Chandler D, Kim HJ, Hynes JT. J Phys Chem. 1992;96:1748. [Google Scholar]
- 24.Ando K. J Chem Phys. 2001;114:9470. [Google Scholar]
- 25.Ungar LW, Newton MD, Voth GA. J Chem Phys B. 1999;103:7367. [Google Scholar]
- 26.Li G, Zhang X, Cui Q. J Chem Phys B. 2003;107:8643. [Google Scholar]
- 27.Olsson MHM, Hong G, Warshel A. J Am Chem Soc. 2003;125:5025. doi: 10.1021/ja0212157. [DOI] [PubMed] [Google Scholar]
- 28.Blumberger J, Bernasconi L, Tavernelli I, Vuilleumier R, Sprik M. J Am Chem Soc. 2004;126:3928. doi: 10.1021/ja0390754. [DOI] [PubMed] [Google Scholar]
- 29.Blumberger J, Sprik M. J Phys Chem B. 2005;109:6793. doi: 10.1021/jp0455879. [DOI] [PubMed] [Google Scholar]
- 30.Blumberger J, Klein ML. J Am Chem Soc. 2006;128:13854. doi: 10.1021/ja063852t. [DOI] [PubMed] [Google Scholar]
- 31.Blumberger J, Tavernelli I, Klein ML, Sprik M. J Chem Phys. 2006;124:064507. doi: 10.1063/1.2162881. [DOI] [PubMed] [Google Scholar]
- 32.Blumberger J. Phys Chem Chem Phys. 2008;10:5651. doi: 10.1039/b807444e. [DOI] [PubMed] [Google Scholar]
- 33.Blumberger J. J Am Chem Soc. 2008;130:16065. doi: 10.1021/ja805471a. [DOI] [PubMed] [Google Scholar]
- 34.Blumberger J, Lamoureux G. Mol Phys. 2008;106:1597. [Google Scholar]
- 35.Seidel R, Faubel M, Winter B, Blumberger J. J Am Chem Soc. 2009;131:16127. doi: 10.1021/ja9047834. [DOI] [PubMed] [Google Scholar]
- 36.Oberhofer H, Blumberger J. J Chem Phys. 2009;131:064101. doi: 10.1063/1.3190169. [DOI] [PubMed] [Google Scholar]
- 37.Oberhofer H, Blumberger J. Angewandte Chemie International Edition. 2010;49:3631. doi: 10.1002/anie.200906455. [DOI] [PubMed] [Google Scholar]
- 38.Tipmanee V, Oberhofer H, Park M, Kim KS, Blumberger J. J Am Chem Soc. 2010;132:17032. doi: 10.1021/ja107876p. [DOI] [PubMed] [Google Scholar]
- 39.Oberhofer H, Blumberger J. J Chem Phys. 2010;133:244105. doi: 10.1063/1.3507878. [DOI] [PubMed] [Google Scholar]
- 40.Oberhofer H, Blumberger J. Phys Chem Chem Phys. 2012 doi: 10.1039/c2cp41348e. [DOI] [PubMed] [Google Scholar]
- 41.Sit PHL, Cococcioni M, Marzari N. Phys Rev Lett. 2006;97:028303. doi: 10.1103/PhysRevLett.97.028303. [DOI] [PubMed] [Google Scholar]
- 42.Cascella M, Magistrato A, Tavernelli I, Carloni P, Rothlisberger U. Proc Natl Acad Sci U S A. 2006;103:19641. doi: 10.1073/pnas.0607890103. [DOI] [PMC free article] [PubMed] [Google Scholar]
- 43.Improta R, Barone V, Newton MD. ChemPhysChem. 2006;7:1211. doi: 10.1002/cphc.200600069. [DOI] [PubMed] [Google Scholar]
- 44.Sulpizi M, Raugei S, VandeVondele J, Carloni P, Sprik M. J Chem Phys B. 2007;111:3969. doi: 10.1021/jp067387y. [DOI] [PubMed] [Google Scholar]
- 45.Kamerlin SCL, Haranczyk M, Warshel A. J Chem Phys B. 2008;113:1253. doi: 10.1021/jp8071712. [DOI] [PMC free article] [PubMed] [Google Scholar]
- 46.Cheng J, Sulpizi M, Sprik M. J Chem Phys. 2009;131:154504. doi: 10.1063/1.3250438. [DOI] [PubMed] [Google Scholar]
- 47.Costanzo F, Sulpizi M, Valle RGD, Sprik M. J Chem Phys. 2011;134:244508. doi: 10.1063/1.3597603. [DOI] [PubMed] [Google Scholar]
- 48.Sutin N. Acc Chem Res. 1982;15:275. [Google Scholar]
- 49.Newton MD. Chem Rev (Washington, DC, U S) 1991;91:767. [Google Scholar]
- 50.Warshel A, Parson WW. Annu Rev Phys Chem. 1991;42:279. doi: 10.1146/annurev.pc.42.100191.001431. [DOI] [PubMed] [Google Scholar]
- 51.Barbara PF, Meyer TJ, Ratner MA. J Phys Chem. 1996;100:13148. [Google Scholar]
- 52.Gray HB, Winkler JR. Annu Rev Biochem. 1996;65:537. doi: 10.1146/annurev.bi.65.070196.002541. [DOI] [PubMed] [Google Scholar]
- 53.Nitzan A. Annu Rev Phys Chem. 2001;52:681. doi: 10.1146/annurev.physchem.52.1.681. [DOI] [PubMed] [Google Scholar]
- 54.Beratan DN, Skourtis SS, Balabin IA, Balaeff A, Keinan S, Venkatramani R, Xiao D. Acc Chem Res. 2009;42:1669. doi: 10.1021/ar900123t. [DOI] [PMC free article] [PubMed] [Google Scholar]
- 55.Skourtis SS, Waldeck DH, Beratan DN. Annu Rev Phys Chem. 2010;61:461. doi: 10.1146/annurev.physchem.012809.103436. [DOI] [PMC free article] [PubMed] [Google Scholar]
- 56.Wu Q, Van Voorhis T. J Chem Theory Comput. 2006;2:765. doi: 10.1021/ct0503163. [DOI] [PubMed] [Google Scholar]
- 57.Zeng X, Hu H, Hu X, Cohen AJ, Yang W. J Chem Phys. 2008;128:124510. doi: 10.1063/1.2832946. [DOI] [PMC free article] [PubMed] [Google Scholar]
- 58.Hu H, Lu Z, Yang W. J Chem Theory Comput. 2007;3:390. doi: 10.1021/ct600240y. [DOI] [PMC free article] [PubMed] [Google Scholar]
- 59.Hu H, Lu Z, Parks JM, Burger SK, Yang W. J Chem Phys. 2008;128:034105. doi: 10.1063/1.2816557. [DOI] [PubMed] [Google Scholar]
- 60.Zeng X, Hu H, Hu X, Yang W. J Chem Phys. 2009;130:164111. doi: 10.1063/1.3120605. [DOI] [PMC free article] [PubMed] [Google Scholar]
- 61.Fujimoto K, Yang W. J Chem Phys. 2008;129:054102. doi: 10.1063/1.2958257. [DOI] [PMC free article] [PubMed] [Google Scholar]
- 62.Hu X, Jin Y, Zeng X, Hu H, Yang W. Phys Chem Chem Phys. 2012 doi: 10.1039/c2cp23714h. [DOI] [PMC free article] [PubMed] [Google Scholar]
- 63.Yang W. Phys Rev Lett. 1991;66:1438. doi: 10.1103/PhysRevLett.66.1438. [DOI] [PubMed] [Google Scholar]
- 64.Yang W. Phys Rev A. 1991;44:7823. doi: 10.1103/physreva.44.7823. [DOI] [PubMed] [Google Scholar]
- 65.Parr RG, Yang W. Density-Functional Theory of Atoms and Molecules. Oxford University Press; New York: 1989. [Google Scholar]
- 66.Cohen AJ, Mori-Sánchez P, Yang W. Physical Review B. 2008;77:115123. doi: 10.1103/PhysRevLett.100.146401. [DOI] [PubMed] [Google Scholar]
- 67.Kubar T, Woiczikowski PB, Cuniberti G, Elstner M. J Chem Phys B. 2008;112:7937. doi: 10.1021/jp801486d. [DOI] [PubMed] [Google Scholar]
- 68.Mori-Sánchez P, Cohen AJ, Yang W. Phys Rev Lett. 2008;100:146401. doi: 10.1103/PhysRevLett.100.146401. [DOI] [PubMed] [Google Scholar]
- 69.Cohen AJ, Mori-Sánchez P, Yang W. Science. 2008;321:792. doi: 10.1126/science.1158722. [DOI] [PubMed] [Google Scholar]
- 70.Cohen AJ, Mori-Sánchez P, Yang W. Chem Rev (Washington, DC, U S) 2011;112:289. doi: 10.1021/cr200107z. [DOI] [PubMed] [Google Scholar]
- 71.Logan J, Newton MD. J Chem Phys. 1983;78:4086. [Google Scholar]
- 72.Darden T, York D, Pedersen L. J Chem Phys. 1993;98:10089. [Google Scholar]
- 73.Laino T, Mohamed F, Laio A, Parrinello M. J Chem Theory Comput. 2005;1:1176. doi: 10.1021/ct050123f. [DOI] [PubMed] [Google Scholar]
- 74.Kumar S, Rosenberg JM, Bouzida D, Swendsen RH, Kollman PA. J Comput Chem. 1992;13:1011. [Google Scholar]
- 75.Gray HB, Winkler JR. Proc Natl Acad Sci U S A. 2005;102:3534. doi: 10.1073/pnas.0408029102. [DOI] [PMC free article] [PubMed] [Google Scholar]
- 76.Lin J, Balabin IA, Beratan DN. Science. 2005;310:1311. doi: 10.1126/science.1118316. [DOI] [PMC free article] [PubMed] [Google Scholar]
- 77.Bernhard P, Helm L, Ludi A, Merbach AE. J Am Chem Soc. 1985;107:312. [Google Scholar]
Associated Data
This section collects any data citations, data availability statements, or supplementary materials included in this article.


