Abstract
The design of nanoparticles for surface enhanced Raman scattering (SERS) within suspensions is more involved than simply maximizing the local field enhancement. The enhancement at the nanoparticle surface and the extinction of both the incident and scattered light during propagation act in concert to determine the observed signal intensity. Here we explore these critical aspects of signal generation and propagation through experiment and theory. We synthesized gold nanorods of six different aspect ratios in order to obtain longitudinal surface plasmon resonances that incrementally spanned 600-800 nm. The Raman reporter molecule methylene blue was trap-coated near the surface of each nanorod sample, generating SERS spectra, which were used to compare Raman signals. The average number of reporter molecules per nanorod was quantified against known standards using electrospray ionization liquid chromatography mass spectrometry. The magnitude of the observed Raman signal is reported for each aspect ratio along with the attenuation due to extinction in suspension. The highest Raman signal was obtained from the nanorod suspension with a plasmon resonance blue-shifted from the laser excitation wavelength. This finding is in contrast to SERS measurements obtained from molecules dried onto the surface of roughened or patterned metal substrates where the maximum observed signal is near or red-shifted from the laser excitation wavelength. We explain these results as a competition between SERS enhancement and extinction, at the excitation and scattered wavelengths, on propagation through the sample.
Keywords: Surface-enhanced Raman spectroscopy, extinction, gold nanorods
Surface enhanced Raman scattering (SERS) is a vibrational technique whose promise for chemical sensing has been debated since the 1970s.1 A primary design objective in SERS optimization is to tailor the surface plasmon resonance relative to the laser excitation wavelength. This is because the on-resonance field enhancement at the surface of the plasmon-active material can increase the Raman signal intensity of nearby molecules by several orders of magnitude. In the case of SERS on immobilized silver nanostructures, the maximum signal enhancement was observed if the plasmon band position was red-shifted compared to the laser excitation wavelength.2 Based on these studies, researchers have fabricated rationally designed nanoparticles for biomedical applications3 such as highly sensitive assays4 and multiplexed imaging5 The stable signals and multiplexing capabilities of these nanoparticles offer an attractive alternative to fluorescence-based techniques.6,7 A recent report notes that a SERS-based approach can outperform an enzyme-linked immunosorbent assay (ELISA).8 Nanoparticle-based SERS assays could, thus, provide novel sensing capabilities that complement or improve present technologies and lead to next-generation clinical diagnostics. For example, Moskovits et al. have extended such studies to quantitatively confirm the ratio of cancerous to noncancerous cells in samples with two different reporter molecule-antibody combinations.9 Using labeled nanoparticles as Raman reporters to achieve contrast in deep-tissue measurements is currently an active area of research.10,11
Light scattering, absorption, and fluorescence arising from the tissue limit the choice of Raman excitation wavelengths to the near-infrared (NIR) spectral region.12 In this spectral region (700-1100 nm), gold nanorods13 and nanoshells14 can be used as effective SERS-active nanoparticles as they exhibit a tunable plasmon band15 where tissue has low absorption.12 Additionally, the presence of the nanoparticles dispersed throughout the tissue adds absorption and scattering effects to the Raman measurement as the light propagates. In this way, nanoparticles that would be injected into tissue behave much like in colloidal suspensions.
For suspensions, as opposed to substrates, accounting for light propagation and attenuation is vital. While the resonant plasmon helps to enhance the Raman signal, attenuation by absorption and scattering complicates experimental design and optimization.16 Upon plasmonic excitation for anisotropic shapes like rods, the maximum electric field, on average, is at the tips of the rods; therefore, SERS signals will be dominated by events at the tips of the rods. The overall extinction of the nanorods depends not only on their shape but also on their absolute size: larger nanorods, for the same aspect ratio, lead to more extinction, with little relation to the qualities of the rod tips. Therefore, it is not a surprise that in colloidal solution, SERS and extinction effects need to be unraveled.
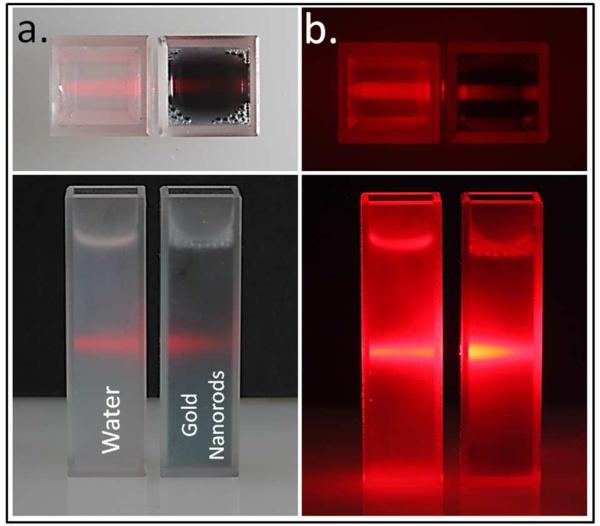
This effect is clearly visible in a solution of nanoparticles. For example, Figure 1 shows a photograph of a laser beam traversing two cuvettes, illustrating extinction effects in solution. The cuvette on the left in both panels, containing water, displays minimal scattering and absorption, resulting in minor attenuation of the laser beam. The cuvette on the right, containing gold nanorods in suspension, shows that the laser beam is unable to penetrate effectively through the cuvette, due to a combination of absorption and scattering of light by the nanorods. Therefore, when performing SERS experiments on such nanorods in solution, Raman-scattered light would be similarly extinguished. Therefore, it is important to understand that there is an antagonistic interplay between extinction and SERS enhancement in the observed Raman signal collected from colloidal suspensions, and therefore in biological sensing.
Figure 1.
Illustrative image demonstrating extinction effects in solution. Upon laser illumination, minimal extinction (scattering + absorption) is observed in water (left cuvette). In contrast, suspensions of gold nanorods in water exhibit extinction under illumination (right cuvette). a) Laser illumination under ambient lighting b) Laser illumination without ambient lighting.
Here we explore the competition between SERS enhancement and extinction on propagation through the sample. We investigate the dependence on plasmon resonance frequency by using gold nanorods of six different aspect ratios which provide longitudinal surface plasmon resonances at wavelengths spanning 600-800 nm. The Raman reporter, methylene blue, was trap-coated with a polyelectrolyte layer near the surface of each nanorod. SERS spectra were acquired using a 785 nm excitation wavelength in transmission mode. In order to compare signals across batches of nanorods, the average number of reporter molecules per nanorod was quantified using electrospray ionization liquid chromatography mass spectrometry (ESI-LC-MS). We report the Raman signal per nanorod as a function of aspect ratio, correcting for the attenuation due to extinction in suspension using methanol as an internal standard.
Results and Discussion
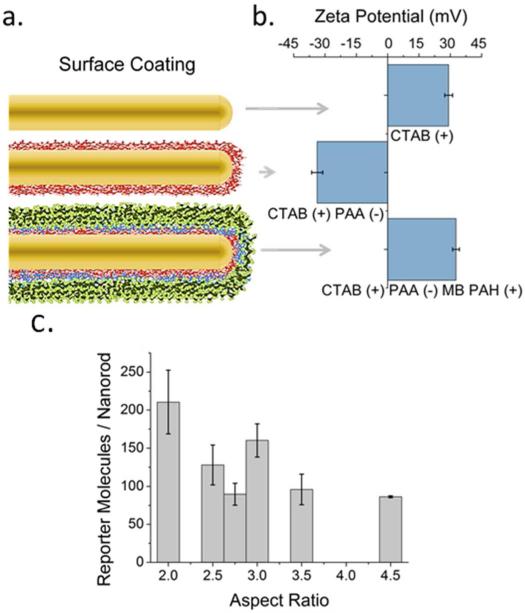
SERS measurements are typically based on Raman reporter molecules attached directly to the surface of the nanoparticles either by covalent or electrostatic interactions.17 Other reports have examined the use of SERS using reporter molecules separated at fixed distances from the surface of the nanoparticles by employing a dielectric silica shell.18 Here, we utilize a polyelectrolyte dielectric layer to wrap gold nanorods of a variety of aspect ratios.19 A schematic of this technique is illustrated in Figure 2a. First, positively-charged CTAB capped gold nanorods were wrapped with negatively charged polyacrylic acid (PAA). We then attached methylene blue reporter molecules by electrostatic interactions. The reporter molecules were then trap-coated by an additional polyallylamine hydrochloride (PAH) polyelectrolyte layer.20 Layer wrapping was confirmed at each step by zeta potential measurements (Figure 2b) and electronic absorption spectra as previously described.21 Shifts in the longitudinal plasmon peak of 5 nm or less are observed as the surface functionalization proceeds (Fig S1). The polyelectrolyte coating also stabilizes the as synthesized CTAB capped gold nanorods from aggregating in polar protic solvents.22 As a rough guide, assuming a 2.5 nm thick CTAB bilayer and 1.5 nm thicknesses for the polyelectrolyte layers,19,21 the Raman reporter dyes should be about 4 nm from the metal surface. There is no apparent aggregation in solution, as suggested by the lack of plasmon band-broadening. In the case that two nanorods are in contact, the spacer layers guarantee that the reporter molecule is approximately 4 nm away from the proximal metal surface and about 12 nm away from the distal metal surface. Although we cannot rigorously prove that there are zero aggregates in solution, these relative distances suggest that the reporter molecules are not expected to lie in hot spots.
Figure 2.
a) Schematic of a gold nanorod with a (red) polyacrylic acid coating, followed by methylene blue reporter molecules (blue) and a polyallylamine hydrochloride (green) trap coat. b) Corresponding zeta potential for aspect ratio 3 gold nanorods as a function of layer coating corresponding to the stages in (a). c) Quantification of the number of methylene blue reporter molecules per gold nanorod as a function of aspect ratio.
The number of reporter molecules per nanorod was quantified for each aspect ratio by ESI-LC-MS.21 We found the average number of reporters per gold nanorod was 100-300 reporter molecules (Figure 2c). These ESI-LC-MS measurements were carried out in triplicate for three independent batches, for each aspect ratio of nanorods. The means of 9 measurements per aspect ratio, with attendant error bars of one standard deviation from the means, are shown in Figure 2c with further details in Figure S2. The values of 100-300 reporters per nanorod are far fewer than monolayer coverage. For example, methylene blue adsorbs to charged surfaces from water with a footprint of 0.66 nm2, 23. A full monolayer of methylene blue, hence, would imply approximately 3000 molecules per nanorod. Therefore, experimental loadings are less than 10% of monolayer coverage. Using these values we compare the experimentally observed SERS signal intensity from each gold nanorod suspension and relate them to theory.
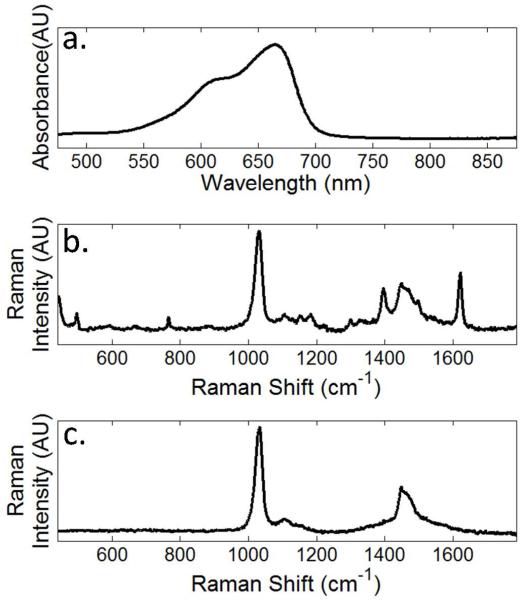
To characterize the observed spectral signatures, we present three reference spectra in Figure 3. The electronic absorption spectrum of methylene blue in methanol is shown in Figure 3a. An absorption maximum can be seen around 670 nm with a shoulder at 650 nm, both of which are blue-shifted from the Raman laser excitation wavelength of 785 nm. This should minimize any chemical resonance effects such as those observed in surface enhanced resonant Raman spectroscopy (SERRS).
Figure 3.
Reference spectra. a) UV/Vis of 15 μM methylene blue in methanol. b) Raman spectrum of 500 μM methylene blue in methanol. c) Raman spectrum of neat methanol.
For Raman measurements, we collected signal from a sample of methylene blue polyelectrolyte coated gold nanorods resuspended in methanol. This approach was first introduced by Kneipp and co-workers24 and has the benefit that the methanol Raman band at 1030 cm−1 25 can serve as an internal standard. For reference, the Raman spectra of methylene blue in methanol and of neat methanol are shown in Figure 3b and Figure 3c.
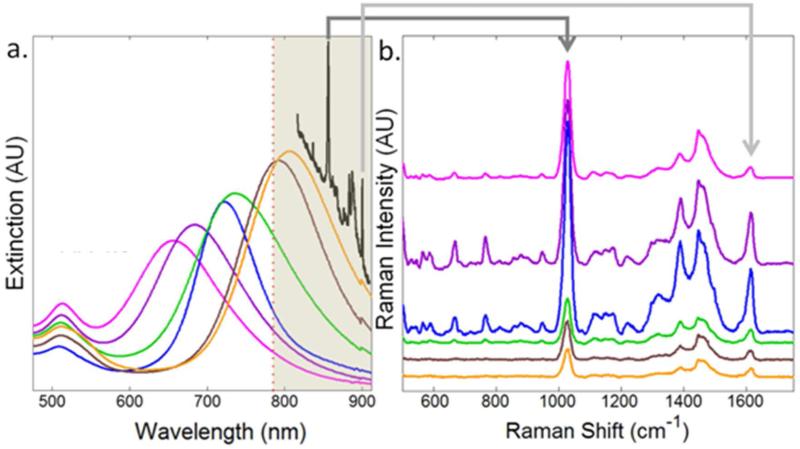
We synthesized gold nanorods with aspect ratios from 2 to 4.5, resulting in a systematic variation of the longitudinal plasmon resonance band. Figure 4a shows the electronic absorption spectra of each of the gold nanorod suspensions after the final PAH polyelectrolyte trap-coating. On the same spectral axes, we also depict the laser excitation wavelength with a red dotted line and the resulting Raman spectrum (black curve) for reference. Traditionally, Raman spectra are reported in terms of Raman shift from an excitation wavelength, as shown in Figure 4b where the spectra are normalized for concentration and the number of reporter molecules per rod and then offset for clarity. From the shaded region in Figure 4a, it is obvious that the extinction profile of higher aspect ratio nanorods in suspension overlaps both the spectral profile of the Raman excitation laser and the wavelengths of Raman scattered photons. The largest Raman signal is observed for nanorods that have a plasmon band blue shifted from the excitation frequency. To quantify the recorded signal, we examined both the reporter Raman signal as well as that of the suspending medium (methanol).
Figure 4.
a) Extinction spectra for gold nanorods (AR 2 - pink, AR 2.5 - purple, AR 2.75 - blue, AR 3 - green, AR 3.5 - brown, and AR 4.5 - orange), normalized to concentration plotted on the same axes as the position of the Raman excitation wavelength (red dots) and the resulting Raman spectrum (black). The spectral region shown in Figure 5b is highlighted by shadow in Figure 5a b) Surface enhanced Raman spectrum of methylene blue attached to six different aspect ratios of gold nanorods bearing PAA polyelectrolyte layer (offset for clarity) normalized for gold nanorods and reporter molecule concentration.
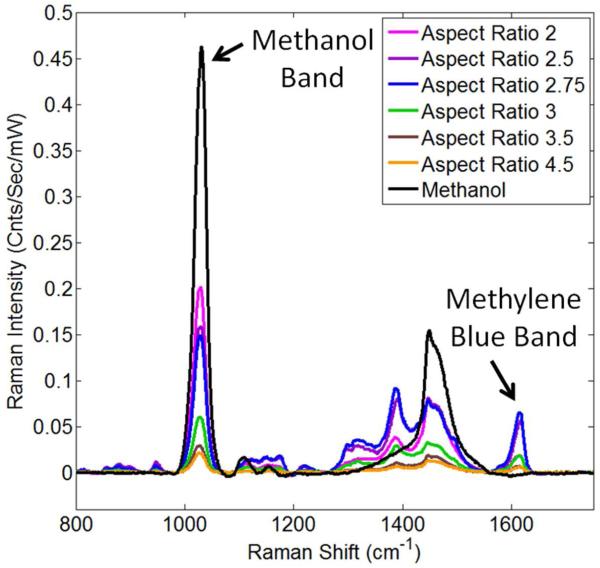
Two spectral features to characterize our suspensions are the Raman band originating from methanol at 1030 cm−1 shift and the Raman band originating from methylene blue at 1616 cm−1 shift (Figure 5).26 The signal intensity at 1030 cm−1 shift should only decrease from extinction of the Raman excitation wavelength since we assume methanol is not enhanced by the gold nanorods. 24 However, the Raman signal from the reporter at 1616 cm−1 shift will be affected by the location of the longitudinal surface plasmon resonance determined by the aspect ratio of the gold nanorod suspensions. By examining these two bands as a function of aspect ratio, we illustrate the effects of the competing physical processes. In addition, we can select an aspect ratio that would provide the largest Raman signal in suspension.
Figure 5.
Comparison of Raman spectra acquired from gold nanorod suspensions bearing polyelectrolyte layers plus methylene blue reporter in methanol. The variation in Raman intensity for the methanol bands is illustrated by the peak at 1030 cm−1 which varies as a function of aspect ratio. Gold nanorod suspensions are normalized for concentration and the number of reporter molecules per gold nanorod.
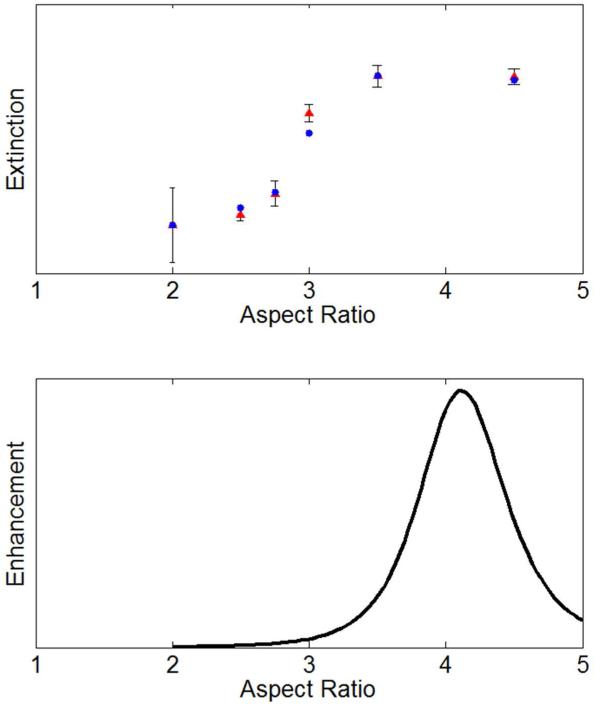
Extinction measurements (Figure 4a) and Raman measurements of the methanol band (Figure 5) provided two estimates of the extinction due to nanorods. This extinction is quantified in Figure 6a. The competing process of SERS electromagnetic enhancement when extinction effects are considered to be negligible (i.e. substrate measurements) is presented in Figure 6b. A prolate-spheroidal approximation for the rods was used to estimate absorption-free electromagnetic enhancement.27 It is clear from Figure 6 that maximum extinction of the Raman excitation occurs near the maximum of electromagnetic enhancement. The collected signal seen in Figure 5 illustrates this competition. reporter molecule quantification.
Figure 6.
a) Blue dots: Experimentally observed extinction of Raman excitation at 785 nm. Red triangles: Difference in Raman band at 1030 cm−1 shift with neat methanol and each aspect ratio of gold nanorods suspended in methanol. b) Predicted electromagnetic enhancement from varying aspect ratios of spheroids in the quasi static limit. Mean-free electron path and depolarization/radiative damping corrections were applied.
As the SERS signal will vary as a function of the nanoparticle concentration and the number of reporter molecules per nanoparticle, it is important to account for these variations in order to understand the spectral data. Using theory we account for these experimental variations between samples. The observed Raman spectra are quantified using the reporter signal at 1616 cm−1 shift for each aspect ratio. These results are shown in Figure 7. The normalized Raman signal in transmission mode from a suspension of gold nanorods can be shown to be equal to:16
| (1) |
where the frequencies ω0 and ω correspond to the incident light and the Stokes’ shifted frequencies, respectively, A is the effective cross-sectional area of the illuminating and collecting beams, R(0) is the raman signal from a single reporter molecule absent the nanorod, ρ is the concentration of the nanorods in the solution, N indicates the number of bound Raman reporter molecules, h is the interaction path length, Cext is the extinction cross-section of the individual nanorods, m is the refractive index of the solution, and 〈GN(ω, ω0)〉 is the ensemble-averaged extinction modified enhancement factor. The ratio in Eq. 1 models the propagation of incident light and Raman scattered light through the suspension and is a form of Beer’s Law. This expression can be simplified if the number of reporter molecules is small, in which case the ensemble-averaged, extinction-modified enhancement factor 〈GN(ω, ω0)〉 can be linearized, i.e., 〈GN(ω, ω0)〉 = 〈G(ω, ω0)N〉 = 〈G(ω, ω0)〉 〈N〉. This allows us to obtain the averaged per particle extinction modified enhancement factor.
| (2) |
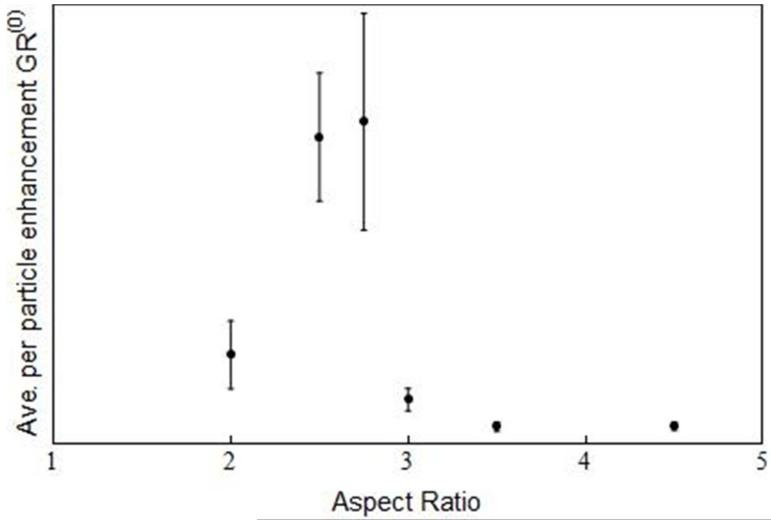
The single-particle, extinction-modified enhancement factor was computed using Eq. (2) and is shown in Figure 7. A maximum per-particle signal enhancement is found at an aspect ratio of 2.75, with 2.5 also within error bounds. This implies that maximum observed signal occurs with gold nanorods blue-shifted from the laser excitation wavelength. This differs from the field enhancement maximum expected at an aspect ratio of 4.
Figure 7.
Determined averaged per particle extinction modified enhancement factor GR(0) (G as a function of aspect ratio) from Eq. 2; some error bars are smaller than the data points.
CONCLUSION
In contrast to SERS experiments of immobilized nanoparticle substrates, where absorption effects are minimal, a significant extinction contribution is realized for SERS particles in suspension. In analyzing the signal generation and recording rigorously, we have demonstrated that Raman-active molecules do not provide monolayer coverage of our polyelectrolyte bearing nanorods as usually assumed. In our experiments, loadings are less than 10% of the expected maximum for monolayer coverage. The calculated ensemble-average signal intensity based on experimentally determined molecular coverage suggests the maximum Raman scattered signal is obtained from that plasmon resonance that is blue-shifted from excitation. This implies the use of nanorods of lower aspect ratios for optimal sensing. Extinction is an important consideration in combination with maximal SERS enhancement when designing tagged Raman probes for suspension applications such as collecting Raman reporter signal through tissue. Efforts toward refining our model by accurately spatially localizing reporter binding sites on the gold nanorods is currently underway in our laboratories.
MATERIALS AND METHODS
Materials
Hydrogen tetrachloroaurate(III) hydrate (HAuCl4I3H2O, > 99.999%), sodium borohydride (NaBH4, 99.99%) and silver nitrate (AgNO3, > 99.0%) were obtained from Aldrich and used as received. Methylene blue (>82%) with the remainder in organic salts, cetyltrimethylammonium bromide (CTAB, > 99 %) and ascorbic acid (C6H8O6, > 99.0%) were obtained from Sigma Chemical and used as received. The polyelectrolytes polyacrylic acid, sodium salt, Mw ~ 15,000 g/mol, (35 wt % solution in H2O) (PAA) and polyallylamine hydrochloride, Mw ~ 15,000 g/mol, (PAH) were obtained from Aldrich and used without further purification. Sodium chloride (NaCl, > 99.0%) was obtained and used as received from Fischer Chemicals. All solutions were prepared using Barnstead E-Pure 18 MΩ-cm water. All glassware used was cleaned with aqua regia and finally rinsed with 18 MΩ-cm water.
Gold Nanorod Synthesis
CTAB coated gold nanorods of aspect ratio (AR) 2, 2.5, 2.75, 3, 3.5 and 4.5 corresponding to dimensions (35 ± 2 nm × 17 ± 1 nm, 39 ± 6 nm × 16 ± 4 nm, 40 ± 5 nm × 14 ± 2 nm, 43 ± 4 nm × 15 ± 1 nm, 45 ± 3 nm × 12 ± 1 nm, 48 ± 3 × 11 ± 1 nm) were synthesized as previously described.28 The gold nanorods were purified twice by centrifugation (8000 RPM, 2 hours).
Polyelectrolyte Layer By Layer (LBL) Coating
We coated the gold nanorods with PAA and PAH using an adapted procedure19 to maintain the nanoparticle concentration throughout each step. For each polyelectrolyte layer we prepared stock aqueous solutions of PAA (−) or PAH (+) at concentrations of 10 mg/ml prepared in 1 mM NaCl and a separate aqueous solution of 10 mM NaCl. To 30 mL aliquots of twice centrifuged CTAB gold nanorods (0.15 nM in particles) we added 6 mL of PAA or PAH (+) solution followed by 3 ml of 10 mM NaCl. The solutions were left to complex overnight (12 – 16 hours) before purification using centrifugation (5000 RPM, 2 hours). We then centrifuged the supernatant and concentrated the two pellets to minimize losses in gold nanorod concentration. Zeta potential measurements and UV-Vis absorption measurements were made between each layering step to confirm successful coating without aggregation of the gold nanorods.
Zeta potential was measured on a Brookhaven ZetaPals instrument. Absorption spectra were recorder on a Cary 500 UV-Vis-NIR spectrometer and transmission electron microscope images were taken on a JEOL 2100 Cryo TEM microscope at a 200 kV accelerating voltage. All TEM grids were prepared by drop-casting 10 μL of purified gold nanorods on a holey Carbon TEM grid (Pacific Grid-Tech). A Thermo Scientific Sorvall Legend X1 centrifuge in a “swinging bucket” orientation was used for purification as detailed below.
Methylene Blue Gold Nanorod Complexation
We used the same initial concentration of gold nanorods (0.15 nM) prior to addition of 10 μL of a stock 1 mM methylene blue solution to 0.99 mL of gold nanorods, to give a final methylene blue concentration of 1 μM during complexation. The mixture was left for an hour before removing excess reporter molecules using centrifugation (2350 RCF, 15 min). The supernatant was also centrifuged and both pellets concentrated to maintain gold nanorod concentration. The concentrated pellet was then re-suspended to 1 mL with DI water before adding 0.2 mL of PAH (10 mg/mL) in 1 mM NaCl and 0.1 mL of 10 mM aqueous NaCl solutions. This mixture was left overnight before purification by centrifugation (2350 RCF, 15 min); again the supernatant was also centrifuged (2350 RCF, 15 min) and the pellets concentrated. For final purification we dialyzed the aqueous solutions in Spectrum Labs 100k MWCO G2 membranes against 4L of Barnstead E Pure (18 MΩ-cm) water for 48 hours. Any remaining unbound methylene blue molecules and excess polyelectrolyte were removed via centrifugation followed by dialysis in a 100 kDa cutoff membrane. By using a membrane pore size 5 times larger than the molecular weight of the polyelectrolyte used, any multi-layer polyelectrolyte bundles that may have formed during synthesis should be removed.
ESI-LC-MS Quantification of Methylene Blue
For electrospray ionization liquid chromatography mass spectrometry (ESI-LC-MS) quantification of the number of methylene blue molecules, we centrifuged the methylene blue complexed polyelectrolyte gold nanorods (2350 RCF, 15 min) and the supernatant again (2350 RCF, 15 min) before concentrating the pellets. We re suspended the pellet in 50 μL of methanol and the gold nanorod cores were then etched by adding 0.010 ml of 1 M KCN and waiting 1 – 2 hours. It was observed that etching had completed once the solution turned colorless. KCN itself does not disturb the mass spectral analysis of methylene blue (see Supporting Information). All data in Figure 2c are the result of triplicate measurements for each of three independent batches of nanorods for each aspect ratio.
The ESI-LC-MS analysis was performed in Metabolomics Center at UIUC with a 5500 QTRAP mass spectrometer (AB Sciex, Foster City, CA) which is equipped with a 1200 Agilent LC. Analyst (version 1.5.1, Applied Biosytems) was used for data acquisition and processing. An Agilent Zorbax SB Aq column (5u, 50 × 4.6mm) was used for the separation. The HPLC flow rate was set at 0.3 mL/min. HPLC mobile phases consisted of A (0.1% formic acid in H2O) and B (0.1% formic acid in acetonitrile). The gradient was: 0–1 min, 98% A; 6–10 min, 2% A; 10.5–17 min, 98% A. The autosampler was kept at 5°C. The injection volume was 1μL. The mass spectrometer was operated with positive electrospray ionization. The electrospray voltage was set to 2500 V, the heater was set at 400 °C, the curtain gas was 35, and GS1 and GS2 were 50, 55, respectively. Quantitative analysis was performed via multiple reaction monitoring (MRM) where m/z 284.2 to m/z 240.1 for methylene blue was monitored. Calibration curves were run on methylene blue standards in the presence of cyanide, from 0.01 μM to 0.1 μM concentrations; our data found 0.029 0.108 μM concentrations. (Fig. S2).
Raman Spectroscopy
For Raman acquisition the dialyzed gold nanorod samples were centrifuged to concentrate the pellets (2350 RCF, 15 min) and the supernatant poured off. The samples were then re-suspended in 2 mL of methanol (HPLC Fischer Scientific > 99.9% purity) and placed in a quartz cuvette. Triplicate samples were synthesized, with seven spectral acquisitions of each sample were collected to minimize the signal-to-noise ratio.
Raman spectra were acquired on liquid samples in transmission mode (LabRAM, Horiba). The excitation wavelength for all measurements was 785 nm with a 30 second acquisition time. The Raman shift from 400-1800 cm−1 was collected at ~9 cm−1 spectral resolution. Laser light was focused through a 1cm path length cuvette with a 40 mm focal length lens and collected with a 125 mm focal length lens to collimate the transmitted light and direct it to the spectrograph. Laser power at the sample was 25mW. Between measurements the cuvette was rinsed with aqua regia (3:1 HCl:HNO3) followed by multiple rinses with Barnstead E-Pure (18 MΩ-cm) water and methanol. For Raman measurements the gold nanorod concentrations were 0.36 nM, 0.36 nM, 0.31 nM, 0.33 nM, 0.33 nM, and 0.29 nM for aspect ratios 2, 2.5, 2.75, 3, 3.5, and 4.5 respectively, necessitating a small correction to the recorded data which did not change the relative trend observed in the Raman spectra between aspect ratios. Electronic absorption spectra were confirmed before and after Raman measurements.
Supplementary Material
ACKNOWLEDGMENTS
STS and BMD acknowledge support from the University of Illinois at Urbana-Champaign from NIH National Cancer Institute Alliance for Nanotechnology in Cancer ‘Midwest Cancer Nanotechnology Training Center’ Grant R25 CA154015A. MVS acknowledges support through the Congressionally Directed Medical Research Program Postdoctoral Fellowship BC101112. We also acknowledge support from a Beckman Institute seed grant, AFOSR Grant Number FA 9550-09-1-0246 and NSF Grant Numbers CHE-1011980 and CHE 0957849. The authors thank the Roy J. Carver Biotechnology Metabolomics Center at the University of Illinois at Urbana-Champaign for mass spectrometry analysis.
Footnotes
SUPPORTING INFORMATION AVAILABLE:
Additional characterization details of mass spectrometry and electronic absorption between synthetic steps. This information is available free of charge via the Internet at http://pubs.acs.org.
REFERENCES
- (1).Haynes CL, McFarland AD, Van Duyne RP. Surface-Enhanced Raman Spectroscopy. Anal. Chem. 2005;77:338A–346A. [Google Scholar]
- (2).McFarland AD, Young MA, Dieringer JA, Van Duyne RP. Wavelength-Scanned Surface-Enhanced Raman Excitation Spectroscopy. J. Phys. Chem. B. 2005;109:11279–11285. doi: 10.1021/jp050508u. [DOI] [PubMed] [Google Scholar]
- (3).Banholzer MJ, Millstone JE, Qin L, Mirkin CA. Rationally Designed Nanostructures for Surface-Enhanced Raman Spectroscopy. Chem. Soc. Rev. 2008;37:885–897. doi: 10.1039/b710915f. [DOI] [PMC free article] [PubMed] [Google Scholar]
- (4).Porter MD, Lipert RJ, Siperko LM, Wang G, Narayanana R. SERS as a Bioassay Platform: Fundamentals, Design, and Applications. Chem. Soc. Rev. 2008;37:1001–1011. doi: 10.1039/b708461g. [DOI] [PubMed] [Google Scholar]
- (5).Kodali AK, Llora X, Bhargava R. Optimally Designed Nanolayered Metal-Dielectric Particles as Probes for Massively Multiplexed and Ultrasensitive Molecular Assays. Proc. Natl. Acad. Sc. U.S.A. 2010;107:13620–13625. doi: 10.1073/pnas.1003926107. [DOI] [PMC free article] [PubMed] [Google Scholar]
- (6).Zavaleta CL, Smith BR, Walton I, Doering W, Davis G, Shojaei B, Natan MJ, Gambhir SS. Multiplexed Imaging of Surface Enhanced Raman Scattering Nanotags in living mice using Noninvasive Raman Spectroscopy. Proc. Natl. Acad. Sc. U.S.A. 2009;106:13511–13516. doi: 10.1073/pnas.0813327106. [DOI] [PMC free article] [PubMed] [Google Scholar]
- (7).Xing Y, Chaudry Q, Shen C, Kong KY, Zhau HE, Wchung L, Petros JA, O’Regan RM, Yezhelyev MV, Simons JW, et al. Bioconjugated Quantum Dots for Multiplexed and Quantitative Immunohistochemistry. Nat. Protoc. 2007;2:1152–1165. doi: 10.1038/nprot.2007.107. [DOI] [PubMed] [Google Scholar]
- (8).Wang G, Lipert RJ, Jain M, Kaur S, Chakraboty S, Torres MP, Batra SK, Brand RE, Porter MD. Detection of the Potential Pancreatic Cancer Marker MUC4 in Serum Using Surface-Enhanced Raman Scattering. Anal.Chem. 2011;83:2554–2561. doi: 10.1021/ac102829b. [DOI] [PMC free article] [PubMed] [Google Scholar]
- (9).Pallaoro A, Braun GB, Moskovits M. Quantitative Ratiometric Discrimination between Noncancerous and Cancerous Prostate Cells based on Neuropilin-1 Overexpression. Proc. Natl. Acad. Sc. U.S.A. 2011;108:16559–16564. doi: 10.1073/pnas.1109490108. [DOI] [PMC free article] [PubMed] [Google Scholar]
- (10).Stone N, Faulds K, Graham D, Matousek P. Prospects of Deep Raman Spectroscopy for Noninvasive Detection of Conjugated Surface Enhanced Resonance Raman Scattering Nanoparticles Buried within 25 mm of Mammalian Tissue. Anal. Chem. 2010;82:3969–3973. doi: 10.1021/ac100039c. [DOI] [PubMed] [Google Scholar]
- (11).Stone N, Kerssens M, Lloyd GR, Faulds K, Graham D, Matousek P. Surface Enhanced Spatially Offset Raman Spectroscopic (SESORS) Imaging - The Next Dimension. Chem. Sci. 2011;2:776–780. [Google Scholar]
- (12).Richards-Kortum R, Sevick-Muraca E. Quantitative Optical Spectroscopy for Tissue Diagnosis. Ann. Rev. Phys. Chem. 1996;47:555–606. doi: 10.1146/annurev.physchem.47.1.555. [DOI] [PubMed] [Google Scholar]
- (13).Huang X, El-Sayed IH, Qian W, El-Sayed MA. Cancer Cells Assemble and Align Gold Nanorods Conjugated to Antibodies to Produce Highly Enhanced, Sharp, and Polarized Surface Raman Spectra: A Potential Cancer Diagnostic Marker. Nano Lett. 2007;7:1591–1597. doi: 10.1021/nl070472c. [DOI] [PubMed] [Google Scholar]
- (14).Lal S, Grady NK, Kundu J, Levin CS, Lassiter JB, Halas NJ. Tailoring Plasmonic Substrates for Surface Enhanced Spectroscopies. Chem. Soc. Rev. 2008;37:898–911. doi: 10.1039/b705969h. [DOI] [PubMed] [Google Scholar]
- (15).Jain PK, Huang X, El-Sayed IH, El-Sayed MA. Noble Metals on the Nanoscale: Optical and Photothermal Properties and Some Applications in Imaging, Sensing, Biology, and Medicine. Acc. Chem. Res. 2008;41:1578–1586. doi: 10.1021/ar7002804. [DOI] [PubMed] [Google Scholar]
- (16).Van Dijk T, Sivapalan ST, DeVetter BM, Yang TK, Schulmerich MV, Murphy CJ, Bhargava R, Carney PS. Optimal Methods for Nanoparticle-Enhanced Raman Sensing. submitted [Google Scholar]
- (17).Guerrini L, Jurasekova Z, Domingo C, Perez-Mendez M, Leyton P, Campos-Vallette M, Garcia-Ramos JV, Sanchez-Cortes S. Importance of Metal-Adsorbate Interactions for the Surface-Enhanced Raman Scattering of Molecules Adsorbed on Plasmonic Nanoparticles. Plasmonics. 2007;2:147–156. [Google Scholar]
- (18).Li JF, Huang YF, Ding Y, Yang ZL, Li SB, Zhou XS, Fan FR, Zhang W, Zhou ZY, Wu DY, et al. Shell-Isolated Nanoparticle-Enhanced Raman Spectroscopy. Nature. 2010;464:392–395. doi: 10.1038/nature08907. [DOI] [PubMed] [Google Scholar]
- (19).Gole A, Murphy CJ. Polyelectrolyte-Coated Gold Nanorods: Synthesis, Characterization and Immobilization. Chem. Mater. 2005;17:1325–1330. [Google Scholar]
- (20).Huang JY, Jackson KS, Murphy CJ. Polyelectrolyte Wrapping Layers Control Rates of Photothermal Molecular Release from Gold Nanorods. Nano Lett. 2012;12:2982–2987. doi: 10.1021/nl3007402. [DOI] [PubMed] [Google Scholar]
- (21).Sivapalan ST, Vella JH, Yang TK, Dalton MJ, Swiger RN, Haley JE, Cooper TM, Urbas AM, Tan LS, Murphy CJ. Plasmonic Enhancement of the Two Photon Absorption Cross Section of an Organic Chromophore Using Polyelectrolyte-Coated Gold Nanorods. Langmuir. 2012;28:9147–9154. doi: 10.1021/la300762k. [DOI] [PubMed] [Google Scholar]
- (22).Alkilany AM, Thompson LB, Murphy CJ. Polyelectrolyte Coating Provides a Facile Route to Suspend Gold Nanorods in Polar Organic Solvents and Hydrophobic Polymers. ACS Appl. Mater. & Interfac. 2010;2:3417–3421. doi: 10.1021/am100879j. [DOI] [PubMed] [Google Scholar]
- (23).Hahner G, Marti A, Spencer ND, Caseri WR. Orientation and Electronic Structure of Methylene Blue on Mica: A Near Edge X-ray Absorption Fine Structure Spectroscopy Study. J.Chem. Phys. 1996;104:7749–7757. [Google Scholar]
- (24).Kneipp K, Dasari RR, Wang Y. Near-Infrared Surface-Enhanced Raman Scattering (NIR SERS) on Colloidal Silver and Gold. Appl. Spectrosc. 1994;48:951–957. [Google Scholar]
- (25).Dixit S, Poon WCK, Crain J. Hydration of Methanol in Aqueous Solutions: A Raman Spectroscopic Study. J. Phys.Cond. Matter. 2000;12:L323–L328. [Google Scholar]
- (26).Naujok RR, Duevel RV, Corn RM. Fluorescence and Fourier-Transform Surface-Enhanced Raman-Scattering Measurements of Methylene-Blue Adsorbed onto a Sulfur-Modified Gold Electrode. Langmuir. 1993;9:1771–1774. [Google Scholar]
- (27).Schatz GC, Van Duyne RP. Handbook of Vibrational Spectroscopy. Vol. 1. John Wiley & Sons, Ltd; Chichester: 2002. Electromagnetic Mechanism of Surface-Enhanced Spectroscopy; pp. 759–774. [Google Scholar]
- (28).Sau TK, Murphy CJ. Seeded High Yield Synthesis of Short Au Nanorods in Aqueous Solution. Langmuir. 2004;20:6414–6420. doi: 10.1021/la049463z. [DOI] [PubMed] [Google Scholar]
Associated Data
This section collects any data citations, data availability statements, or supplementary materials included in this article.


