Abstract
A signal quality estimate of a physiological waveform can be an important initial step for automated processing of real-world data. This paper presents a new generic point-by-point signal quality index (SQI) based on adaptive multichannel prediction that does not rely on ad hoc morphological feature extraction from the target waveform. An application of this new SQI to photoplethysmograms (PPG), arterial blood pressure (ABP) measurements, and ECG showed that the SQI is monotonically related to signal-to-noise ratio (simulated by adding white Gaussian noise) and to subjective human quality assessment of 1361 multichannel waveform epochs. A receiver-operating-characteristic (ROC) curve analysis, with the human “bad” quality label as positive and the “good” quality label as negative, yielded areas under the ROC curve of 0.86 (PPG), 0.82 (ABP), and 0.68 (ECG).
Index Terms: Adaptive filtering, intensive care, multichannel waveforms, physiological signals, signal quality, signal quality index (SQI)
I. Introduction
Noise from any of a wide variety of sources may corrupt physiological signals; therefore, signal quality estimation should be an important initial step in automation of clinical decision support. Signal quality estimates can be useful in suppressing false alarms [1], detecting sensor misplacement, allocating resources efficiently in telehealth settings [2], [3], or selecting regions for the accurate or robust extraction of clinically relevant features [4]–[7]. Estimating signal quality in an ICU represents a particular set of challenges: signals from patients may have clean but unusual wave morphologies because of medical conditions, medication, or some form of external stimulus (such as intubation or pacemaker). Under such delicate conditions, however, multichannel waveforms are commonly recorded, and the relationships among such physiological signals as ECG, photoplethysmograms (PPG), and arterial blood pressure (ABP) present an opportunity to confirm what is observed in any single channel.
Several algorithms have been developed that rely on specific statistical or morphological waveform features for estimating quality of common physiological signals observed in an ICU setting. In particular, estimation of signal quality from ECG waveforms has been explored by several studies. For instance, Wang [1] used the normalized area differences from successive QRS wavelets to generate a quality index. Li et al. [6] used comparison of multiple beat detection algorithms within and across several leads as well as statistical properties of the ECG such as kurtosis and power spectra over a reference range in order to obtain a quality index. Also relying on beat-by-beat analysis, Bartolo et al. [8] used weighted cross correlation with a QRS template for an estimate of noise level in the signal. Allen and Murray [9] used ECG power spectra over predefined frequency bands and a preset limit on the ECG amplitude (with bandwidths chosen based on typical monitoring conditions). More recently, in 2011 PhysioNet and Computing in Cardiology [10] hosted a competition on quality estimation of 12-lead ECG signals recorded for diagnostic purposes [2]. Approaches from the top competitors included amplitude thresholds and heuristically derived decision trees [11]–[13], auto-and cross-correlational analysis [14], QRS features (such as amplitude to baseline ratio) [12], [15], and comparison across multiple QRS detectors along with general signal statistics [15].
For PPG signals, on the other hand, Sukor et al. [4] used specific morphological features of the signal that were thought to be correlated with quality (such as pulse amplitude, trough depth differences between successive troughs, and pulse width). Following a different route, Gil et al. [16] used Hjorth parameters to derive a PPG artifact detector (where the first Hjorth parameter was compared to that of a reference ECG signal). While Deshmane [17] modified the approach in [16] in order to generate an adaptive artifact detector which would also be valid under arrhythmia alarms. Other PPG signal quality studies used bispectral analysis along with skewness and kurtosis measures of the physiological waveform [18], [19].
Similarly, for ABP signals, Zong et al. [20] used a beat-by-beat fuzzy implementation based on ABP pulse detection and ABP features such as systolic, diastolic, mean, and maximum blood pressures. Sun et al. [21] also used systolic, diastolic, and mean blood pressures to generate an abnormality index based on a priori physiological bounds. The ABP indices in [20] and [21] led to two other studies, [6], [7], which combined them in order to generate an improved beat-by-beat ABP quality estimator. For respiratory signals, Chen et al. [22] developed a method to estimate waveform quality based on breath detection over varying baseline values.
While these specialized algorithms obtained promising results, the focus of this paper is on the development of a more general and continuous signal quality index (SQI) that is based on concurrent multichannel information and is applicable to a wide variety of signals observed in the ICU. We propose a new point-by-point SQI estimation algorithm that does not rely on specific clinical waveform features, beat-by-beat analysis, or a priori imposed ranges such as QRS wavelets in electrocardiograms, pulse widths in ABP, or constrained slope ranges in normal PPGs. Our SQI algorithm works on multichannel records based on the coupling information estimated from concurrent waveforms. To estimate the degree of coupling between the desired channel and other concurrent waveforms, we use the multichannel adaptive filter (MCAF) [23] originally developed for the 2010 PhysioNet Challenge [24]. This filter utilizes a combination of linear adaptive filters to predict the desired signal using the other concurrent channels. Using the MCAF, we derived an SQI based on the explicit assumption that “good” quality signals will yield a low MCAF tracking error, whereas “bad” quality signals will yield a high MCAF tracking error. The dataset and the human annotations are available on PhysioNet [10] for those who wish to compare or develop different methods (http://physionet.org/physiobank/database/mimic2wdb/signal-quality/).
II. Methods
A. Dataset and Human-Annotated Signal Quality
The waveform dataset for this study was extracted from MIMIC-II [25], a public database consisting of thousands of ICU waveforms collected at the Beth Israel Deaconess Medical Center (Boston, MA). Each multichannel epoch (a 10-min interval) was represented as an N × M measurement matrix
| (1) |
where each column xi represents a N × 1 vector (a single signal of N samples). The channel to be predicted was defined as the target channel xT and the total number of available channels (signals) is M.
The total number of epochs for this study was 1361, and a maximum of eight concurrent waveform channels were available in each epoch. Each available channel was evaluated for quality, so each epoch had multiple quality labels. The available channels in each epoch were decided by the clinical staff. Each epoch included a subset of the following waveform types: respiration (RESP), PPG, ABP, central venous pressure (CVP), pulmonary arterial pressure, right atrial pressure, umbilical arterial pressure, and the following ECG leads: I, II, III, V, AVR, and modified chest lead (MCL). The ECG leads in MIMIC-II designate any of the standard (V) or modified (MCL) chest leads (V1–V6). Each epoch had a sampling frequency of 125 Hz (N = 75 000) and 10-bit resolution. The end time of an epoch (see Fig. 1), which was the region to be analyzed for signal quality, coincided with a critical ventricular tachycardia or asystole alarm triggered by an ICU bedside monitor (Component Monitoring System Intellivue MP-70; Philips Healthcare, Andover, MA). These regions were chosen because of the potential for an accurate signal quality estimate to suppress false arrhythmia alarms; detected ventricular tachycardia and asystole were purposely included in the study. Moreover, most of the alarms were triggered because of signal changes in the monitored ECG leads; thus, the selected regions for analysis in this study were likely to include nonstationary statistics. The SQI algorithm, therefore, was being tested under realistic clinical conditions.
Fig. 1.
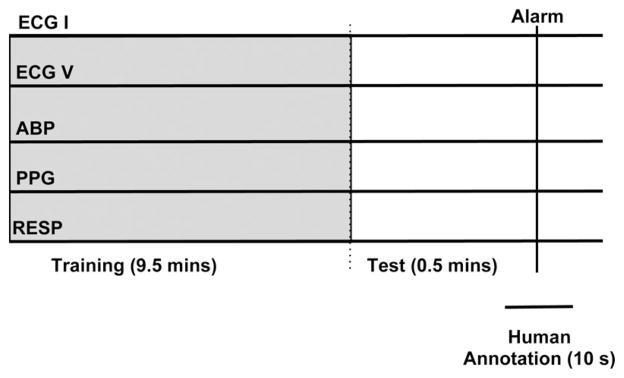
Schematic illustration of the annotation process. No actual signals are shown. The epochs were chosen based on the triggering of an arrhythmia alarm. The human annotators rated the quality of the epoch around the alarm time. A 10-min segment prior and up to the alarm was used by the algorithm.
In order to create a gold standard of signal quality assessment, two human annotators analyzed the signal quality of a target channel at the end of each epoch by classifying it into one of three categories: “good,” “maybe,” or “bad.” The “good” label indicated that the signal was clean and that the timing of the waveform peaks were consistent across channels. The “bad” label indicated that the signal was highly corrupted by noise and no discernible peaks existed within a channel, or that the timing of the waveform peaks was not consistent across channels. The “maybe” label meant that the peaks of the waveform within a channel were marginally visible but still coincided with peaks in other channels. A third human annotator adjudicated disagreements between the two initial annotators. The third annotator had more experience in ECG signal analysis than the other two annotators, and his assessment overruled theirs. The annotators assigned a signal quality value based on a few seconds before the end of the 10-min epoch mark. They were also able to see a few seconds of the waveforms following the end of the epoch (see Fig. 1).
The following common signal types were annotated by the two human experts: PPG (1313 epochs), ABP (905 epochs), and all ECG leads (3758 epochs). This resulted in a total of 11 952 waveform annotations (5976 annotations per person, not including the adjudicator). In order to assess the inter-rater variability of the two annotators, the following statistics were calculated: probability of agreement P (A), Kappa score (κ) [26], and the AC1 score [27]. The AC1 inter-rater variability score was computed as an alternative to κ due to the known large variations in the κ statistic [27], [28]. The κ and the AC1 scores were generalized from their binary forms in order to account for the three different labels used by the annotators.
B. Adaptive Filtering and Prediction Overview
The MCAF prediction algorithm consisted of a bank of M gradient adaptive Laguerre lattice (GALL) filters [29] followed by a Kalman filter [30] that combined the individual responses to generate a final estimate (see Fig. 2). The Kalman filter covariance matrix was set to the identity matrix, assuming equal “state” noise levels on the output of the individual GALL estimates. The first 9.5 min of the epoch were used to optimize the forgetting factor for all the filters (including the Kalman filter) and the single pole location of the GALL filters. The mean square difference between the target signal and the Kalman estimate was used as a cost function. The channel to be tracked was defined as the target channel, and the input to the Tth GALL filter was a 30-s delayed version of the target signal xTS. This 30-s delay was selected based on the original algorithm and on the assumption that it would yield a sufficiently long delay that samples 30 s apart are uncorrelated. The purpose of the delayed target channel was to provide at least one channel for robust signal estimation in case other channels were (or became) absent, or if the other concurrent channels had different spectral characteristics from the target channel. Thus, the inclusion of the delayed channel allowed for a graceful degradation in performance, where the MCAF collapses into a standard linear autoregressive predictor. The settings of the MCAF algorithm were exactly the same as described in [23]. The decision to use a 9.5 min time interval for training was based on the tradeoff between computation time and a sufficiently long time segment to characterize nonstationary behavior and any long-term coupling between the different signals. This time was also the one proposed by the original PhysioNet challenge [24].
Fig. 2.
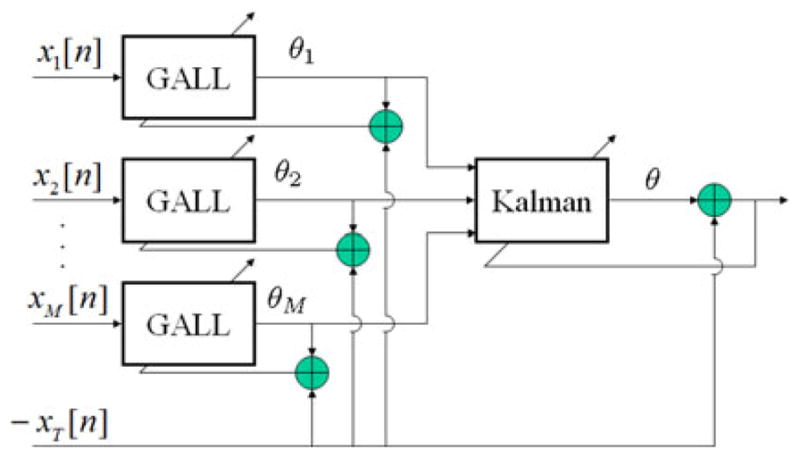
Overview of MCAF prediction. Note that the estimates θi are scalars on a sample-by-sample basis. The MCAF consists of a bank of GALL filters, in which individual channels attempt to predict the target channel. These individual predictions θi are then linearly combined through a Kalman filter for the final estimate.
1) Individual Reconstructions
The GALL filter was selected to reconstruct the target signal from the input channels for several reasons. Some of the desired properties of the GALL filter are fast convergence, stability (if the pole is chosen to be stable), a forgetting factor that allows for changing conditions, and ability to model a long impulse response (or a bandpass or low-pass system with rolloff spectrum) with relatively few parameters [29], [30]. The last two points are crucial for biomedical signals in particular because using a forgetting factor can make the system more robust to nonstationary conditions and biological signals are known to have bandpass or low-pass spectra [31]–[33].
The GALL adaptive filter consists of orthogonalizing sections and joint sections (see Fig. 3), in which delays are replaced by Laguerre transfer functions
Fig. 3.
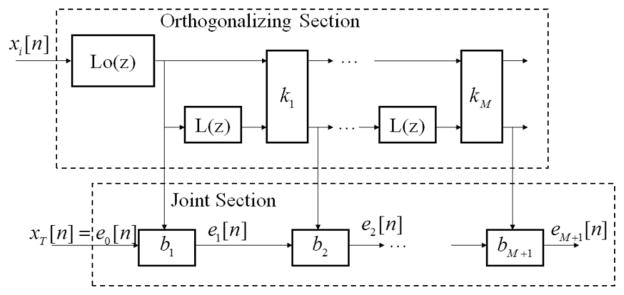
Overview of the GALL filter. The GALL filter is similar to a standard gradient adaptive lattice filter, but with delays replaced by Laguerre functions.
| (2) |
where the transfer function’s pole a is constant across the entire filter. For a = 0, the Laguerre transfer function becomes a simple unit delay z−1. Note that the first Laguerre transfer function in the GALL filter (described in detail in [29]) is actually an infinite impulse response filter with a pole located at a. The input to the GALL filter was any of the M channels (with xT replaced by its 30-s shifted version xTS), and the filter’s desired response was set to xT.
The algorithm for training the GALL filter consisted of three major design parameters: P (the number of lattice stages), a (the pole location), and λ (the forgetting factor). The number of lattice stages P was set to 35 and held fixed for all measurements and all signals (this value of P was the one used for the original challenge, [23]). The two other parameters λ and a were jointly optimized per signal and per record using the following cost function:
| (3) |
where rmse() is the root mean square error. The minimization was performed over a predefined discrete set of values: for λ, this set was [0.5 0.8415 0.9749 0.9960 0.9994 0.9999], and for a, this set was 1 − 0.0005qi where qi was linearly varied between 0 and 1 in 20 steps (these were the same sets used in the original algorithm). The optimization function (3) was calculated over the penultimate 30 s (N − 7500 ≤ n ≤ N − 3750) so that this optimization was performed individually over all records. The joint optimization of (3) was by far the most computationally demanding aspect of the algorithm, taking on average about 3 min for each 10-min multichannel record. It was implemented in a parallel fashion using an eight core 2.0 GHz multiprocessor machine.
After the GALL’s three major design parameters had been selected, the adaptive parameters of the filter (the filter coefficients) were allowed to adapt to the desired response xT. All of the filters’ trained parameters were frozen at n = N − 3750 (last training sample) in order to generate the individual reconstructions for the missing section (N − 3750 < n ≤ N).
2) Combined Reconstructions
The second and final stage of the reconstruction algorithm consisted of combining the individual sample-by-sample reconstructions θm [n], in order to generate an improved sample-by-sample final estimate of the missing signal θ[n]. These M × 1 sample-by-sample reconstructions were used as inputs to an unforced Kalman filter [30], [34] where the vector of M × 1 weights w was defined as the filter’s states:
| (4) |
| (5) |
| (6) |
The weight updates of the Kalman filter were calculated using the following equations:
| (7) |
| (8) |
| (9) |
| (10) |
where λK is a scalar forgetting factor between 0 and 1 for the Kalman filter, K[n] is the M × M state error correlation matrix, g[n] is the M × 1 Kalman gain, and u[n] is the M × 1 vector of inputs. The filter design parameter λK was determined by finding the optimal λK in exactly the same way as the λ from the individual GALL reconstructions, as described in Section II-B1. All of the Kalman filter’s adaptive weights were frozen at n = N − 3750 (last training sample) in order to generate the final reconstruction for the missing section (N − 3750 < n ≤ N). Note that the overall amount of optimization consisted of tuning at most 17 parameters (for eight-channel epochs), which were the eight poles and the eight forgetting factors for the GALL section and one forgetting factor for the Kalman section.
C. Estimating Signal Quality
The SQI for a single channel was estimated in two steps. In the first step, a preliminary point-by-point SQI SQIp [n] was derived from the predicted MCAF signal θ as
| (11) |
The form of the function SQIp [n] was chosen with the constraint that it should be a monotonic function of the prediction error and be bounded between 0 and 1. The second and final step consisted of gating SQIp [n] with a masking function defined by
| (12) |
The gating function is 0 in regions where the first derivative of xT [n] is 0, which is likely to occur with clipping artifacts, absence of a signal, or a constant dc output. All these cases were defined a priori as low quality. The product of SQIp [n] with the masking function (12) was then low-pass filtered using a 5 s moving average filter to yield the sample-by-sample SQI value SQI[n]
| (13) |
The choice of using a 5 s moving average filter was based on the ANSI regulation that a commercial alarm should be triggered within 10 s of an arrhythmia [35]. The last sample of the SQI curve, SQI[75 000], was used as the SQI estimate of that epoch when comparing with the human annotations.
D. Gaussian Noise Simulation
For the first experiment, we used simulations to validate our choice of the SQI equation (13) with an objective measure of quality. We compared the estimated SQI with the signal-to-noise ratio (SNR) for an additive white Gaussian noise source on the PPG channel. We chose Gaussian noise as the additive noise model because of the Central Limit Theorem [36], and because there are no appropriate additive noise models for PPG signals (white noise simulations have also been previously used for PPG signals as in [16] and [37]). Real-world noise testing may have noise that is nonadditive and correlated across channels, which would violate the original assumptions under which we attempted to test the algorithm. In the second experiment, we included real noise and human annotations in an attempt to validate the algorithm under more challenging conditions.
The computer simulations were generated by adding stationary white Gaussian noise to a PPG signal labeled by the annotators as “good.” This particular record had the following channels: ABP, CVP, RESP, ECG II, ECG III, and ECG AVR in addition to the target PPG channel. Noise was added only to the PPG channel. White Gaussian noise was added to the entire target signal at the following SNR levels: −30, −20, −10, −5, 0, 5, 10, 20, and 30 dB. The original noise-free PPG waveform was never used by the MCAF algorithm.
E. Comparison Between SQI and Human Signal Quality Assessment
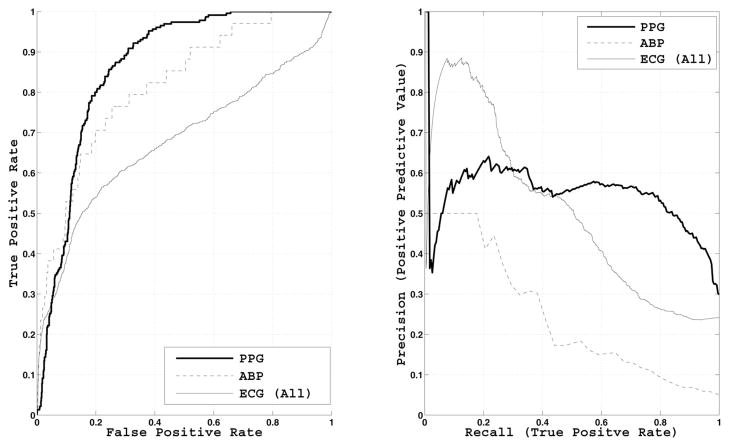
We compared the estimated SQI and human annotations using two different methods. In the first method, we conditioned and analyzed statistics of the estimated SQI, mean and standard error, on the three label categories. In the second method, we computed receiver operating characteristic (ROC) and precision–recall (PR) curves and their areas. The ROC was generated using the human labels as the gold standard. Because of the binary nature of ROC and PR analysis, we chose to use only the two extreme labels, ignoring the “maybe” class. The PR analysis was conducted in order to control for the imbalance between the “bad” and “good” classes [38] (see Table I). In both ROC and PR analyses, the “good” labels were negative and the “bad” labels were positive.
TABLE I.
Human-Annotated Signal Quality Statistics
| Bad (%) | Maybe (%) | Good (%) | Total | |
|---|---|---|---|---|
| PPG | 17 | 20 | 63 | 1313 |
| ABP | 4 | 6 | 90 | 905 |
| ECG (All) | 21 | 12 | 67 | 3758 |
| ECG I | 18 | 10 | 72 | 195 |
| ECG II | 21 | 12 | 67 | 1361 |
| ECG III | 11 | 7 | 82 | 186 |
| ECG V | 19 | 12 | 69 | 896 |
| ECG MCL | 30 | 11 | 59 | 166 |
| ECG AVR | 24 | 13 | 63 | 954 |
III. Results
Table I shows the signal quality statistics of the dataset as determined by the human annotators, as well as the number of epochs that contained each signal type. The “ECG (All)” class is the superset of all ECG leads that could be present in any different combination within an epoch. The ICU staff decided on which ECG leads were utilized. Overall, the “good” class was consistently larger than the “bad” class across signal channels. ABP exhibited the best signal quality, and this is expected given that ABP is the most invasive measurement (requiring an arterial line and carrying a high risk of infection [39]). Among the ECG leads, ECG III yielded the highest percentage of good-quality labels and lowest percentage of bad-quality labels. On the other hand, ECG MCL resulted in the lowest percentage of good-quality labels and the highest percentage of bad-quality labels. In terms of prevalence, ECG II was available in all 1361 epochs and the second and third most common ECG leads were AVR and V. PPG was available in most epochs and ABP was less frequently recorded than PPG.
The agreement between the two expert annotators on the 5976 annotations was 82.6% (κ = 0.57 and AC1 = 0.80). Without the “maybe” label (using “bad” and “good” labels only), the inter-rater variability statistics are higher, yielding an agreement of 90.4% (κ = 0.73 and AC1 = 0.90). The third expert (the adjudicator) labeled about 17.4% of the annotations. Of the 5976 annotations per expert, the two initial experts disagreed on 1036. The third expert agreed with expert 1 about 95% of the time, and with expert 2 about 2% of the time. All three experts disagreed only on 28 annotations.
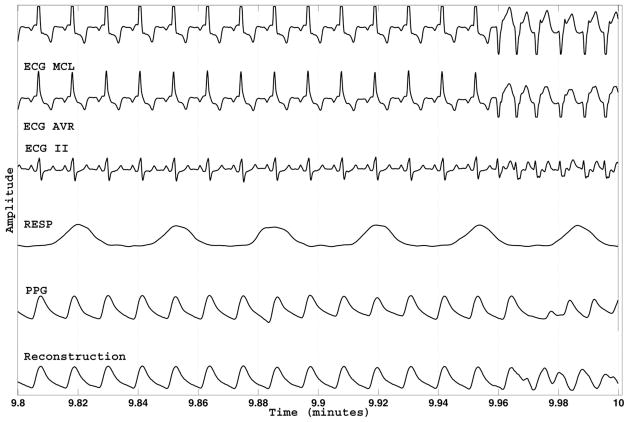
Fig. 4 illustrates an example of point-by-point SQI estimates with PPG as the target waveform. All available signals as well as the predicted PPG signal are shown. Note that the quality of the PPG signal varies and is tracked by the SQI time series. The predicted PPG signal seems sensible given the information in ECG II.
Fig. 4.
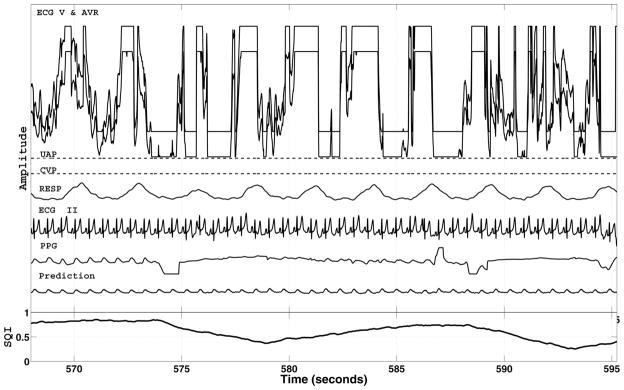
Example of the MCAF prediction and estimated point-by-point SQI using the PPG signal as target. Because of filtering, there is a 5-s delay in the SQI. The SQI is based on the error between the recorded PPG signal and its MCAF reconstruction, labeled as “Prediction.” All recorded channels (including those which are badly corrupted) were used as inputs to the MCAF filter. The MCAF filter adaptively selects the best channels for prediction.
The result of the Gaussian noise simulation at −10 dB is depicted in Fig. 5, with PPG as target. The corrupted PPG signal has visually indiscernible peaks, but the MCAF algorithm is able to predict the original PPG signal very well. The complete results from the Gaussian noise simulation across all SNR levels are shown in Fig. 6. The estimated SQI is a monotonic function of SNR, yielding values less than 0.9 for SNRs less than 0 dB.
Fig. 5.
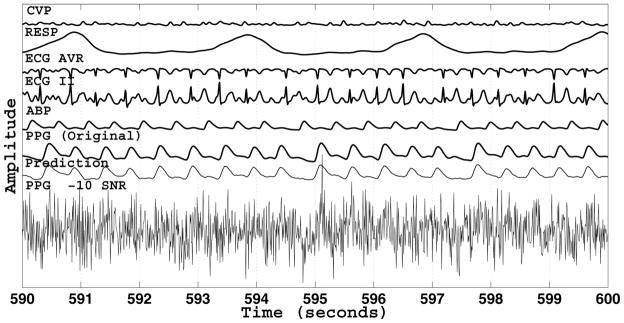
Result of the Gaussian noise simulation at a SNR of − 10 dB. The noise was added to the entire PPG signal. That is, “PPG − 10 SNR” was always the target signal. The original uncorrupted PPG signal is displayed for comparison purposes and was not used by the MCAF algorithm for prediction.
Fig. 6.
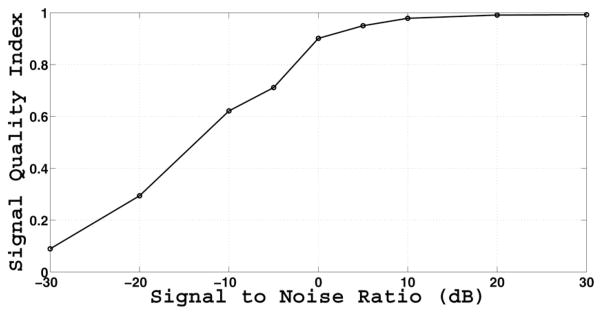
Estimated SQI as a function of SNR simulated with additive white Gaussian noise. The PPG signal is the target. The SQI is a monotonic function of SNR, and asymptotically approaches 0 and 1.
The statistics of the SQI estimates on the entire dataset are tabulated in Table II, stratified by the three human labels. In general, there is an increasing trend from “bad” to “maybe” and from “maybe” to “good”. Fig. 7 pictorially describes the results in Table II without those for the individual ECG leads.
TABLE II.
Estimated SQI Stratified by Human Labels Shown in Mean and Standard Error
| Bad | Maybe | Good | |
|---|---|---|---|
| PPG | 0.56 (0.01) | 0.74 (0.01) | 0.82 (0.01) |
| ABP | 0.51 (0.05) | 0.61 (0.04) | 0.80 (0.02) |
| ECG (All) | 0.57 (0.01) | 0.74 (0.01) | 0.78 (0.00) |
| ECG I | 0.59 (0.05) | 0.80 (0.06) | 0.90 (0.01) |
| ECG II | 0.57 (0.01) | 0.74 (0.01) | 0.78 (0.00) |
| ECG III | 0.52 (0.07) | 0.60 (0.08) | 0.73 (0.01) |
| ECG V | 0.65 (0.02) | 0.78 (0.01) | 0.77 (0.00) |
| ECG MCL | 0.46 (0.03) | 0.52 (0.05) | 0.72 (0.01) |
| ECG AVR | 0.60 (0.02) | 0.75 (0.02) | 0.78 (0.00) |
Fig. 7.
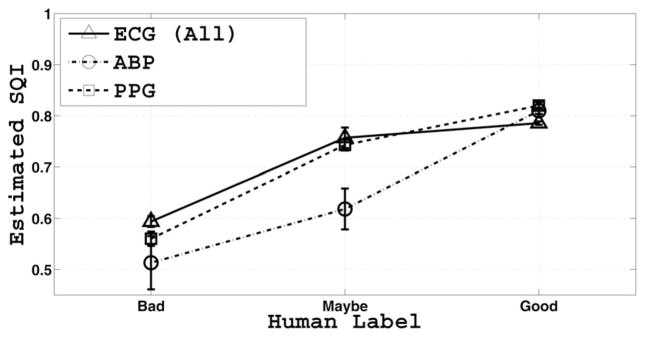
Mean and standard error of SQI values as a function of expert labels. The SQI is a monotonic function of expert label.
The ROC and PR curves based on “good” and “bad” quality waveforms, omitting individual ECG leads, are shown in Fig. 8. The areas under the ROC and PR curves, denoted area under the curve (AUC)-ROC and AUC-PR, respectively, are shown in Table III. The best AUC-ROC of 0.86 was achieved for PPG, and the AUC-ROC for ABP was close at 0.82. The overall ECG AUC-ROC was much lower (0.68), while AUC-ROC for the individual ECG leads ranged from 0.59 to 0.83. AUC-PR ranged from 0.23 to 0.70.
Fig. 8.
ROC and PR curves of estimated SQI for ABP, ECG (All), and PPG waveforms with human signal quality assessment as gold standard. The areas under the curves are tabulated in Table III.
TABLE III.
ROC and PR Curve Statistics, Based on “Bad” (positive) and “Good” (Negative) Human Labels
| AUC-ROC | AUC-PR | |
|---|---|---|
| PPG | 0.86 | 0.54 |
| ABP | 0.82 | 0.23 |
| ECG (All) | 0.68 | 0.50 |
| ECG I | 0.83 | 0.60 |
| ECG II | 0.72 | 0.54 |
| ECG III | 0.67 | 0.36 |
| ECG V | 0.59 | 0.39 |
| ECG MCL | 0.82 | 0.70 |
| ECG AVR | 0.63 | 0.51 |
IV. Discussion
We propose a novel SQI algorithm based on adaptive filtering of all available signal channels from multichannel waveform records. In a Gaussian noise simulation, we have shown that the proposed SQI is a monotonic function of SNR, resembling a logistic sigmoid function. Furthermore, the proposed SQI covers a wide dynamic range (over 60 dB), asymptotically reaching its limits of 0 and 1. The SQI at 0.5 roughly corresponds to an SNR of −15 dB and the SQI at 0.9 roughly corresponds to an SNR of 0 dB. The results of the SNR simulation at −10 dB (see Fig. 5), with an estimated SQI close to 0.6, show that the peaks in the PPG signal are indiscernible and, thus, have the potential to affect the dynamic range of any SQI algorithm that relies on beat-by-beat comparisons.
The proposed SQI also exhibits promising agreement with human assessment of signal quality under nonstationary conditions (caused by the triggering of arrhythmia alarms). The performance of the algorithm measured through AUC-ROCs was of 0.86, 0.82, and 0.68 for PPG, ABP, and ECG, respectively. The performance measured through the AUC-PR was of 0.54, 0.23, and 0.5 for PPG, ABP, and ECG, respectively. This is in agreement with the expectation that PR curves represent more stringent criteria when dealing with highly skewed datasets [38]. The information contained in both ROC and PR curves is sufficient to characterize any confusion matrix for a classifier given a set of two performance values (for instance, specifying a positive predictive value and a false alarm rate). A fair quantitative comparison between published algorithms is very difficult, in part because of the use of different datasets. The dataset used in this study, however, is being made available at PhysioNet [10] in order to facilitate future comparisons.
One major advantage of the proposed algorithm is that it presents a universal approach to different signal types and does not require supervised fine tuning when the source of the target signal changes. While there is no dependence on physiologically motivated parameters, it may be possible to achieve further improvement in performance by applying such constraints or using the proposed SQI in conjunction with other algorithms, such as those found in [2], [4], [6], [20], and [31]. For instance, imposing prior ad hoc bounds on amplitude, first derivative (slope), and/or higher derivatives could help deal with MCAF stability and tracking issues. The ability to gradually add boundary constraints allows for tradeoffs between a generic versus a physiologically specific (i.e., based on ad hoc bounds), but more accurate estimation. Good tracking performance of the MCAF is not always guaranteed (an example of inaccurate tracking under clean conditions but with a physiological change is demonstrated in Fig. 9). This is of particular concern for false alarm reduction algorithms. Under some conditions, the MCAF error can be quite high despite good signal quality because the filters are not able to adapt quickly enough to changes in the system. However, the MCAF filter is sometimes capable of tracking a target signal under genuine physiological changes, as shown in Fig. 10 and the AUC results in Table III. A possible approach to validate the MCAF tracking and stability could be a beat rhythm comparison with an independent channel (as done by [6]) when the MCAF error drops below a certain threshold.
Fig. 9.
Example of the MCAF tracking when the signals are clean and a genuine change in physiological condition occurs. Although the estimated SQI is still high (> 0.7), suggestions for improving and validating the MCAF tracking are mentioned in the text.
Fig. 10.
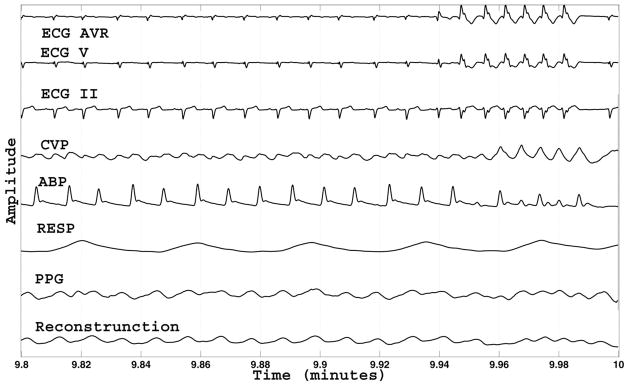
Another example of the MCAF tracking when the signals are clean and a genuine change in physiological condition occurs. In this case, the tracking on the PPG signal yields reasonable results.
Overall, the proposed SQI algorithm performed better on PPG and ABP than ECG. Two possible explanations for this are the broadband nature of the ECG signal and physiological causality. Due to the broadband nature of the ECG signal, the performance of linear prediction of ECGs from PPG and ABP might be limited by the narrow-band spectrum of the PPG and ABP signals. On the physiological causality constraint, note that the ABP follows ECG, and that PPG (if measured at a finger tip) follows ABP (if measured at the radial artery) and ECG. While these signals may seem quasi-periodic, there are significant variations in their rates of peaks (jitter) so that the sequence of peak intervals can be modeled as an independently distributed processes [40], [41]. This variability can be amplified under the nonstationary conditions as in the case of this study because the arrhythmia alarms used were likely due to motion artifact or a true ventricular tachycardia/asystole arrhythmia. While the heart-rate variability may not be perceptible to a human, a delay error of a few milliseconds on the prediction of an ECG wavelet can yield a fairly large root mean square error due to the high values and sharp onset time of the R wave. Hence, it is expected to be an easier task to predict future PPG and ABP given ECG than to predict ECG given PPG or ABP. Perhaps, modifying the cost function for ECG signals so that the QRS complex is weighted less, low-pass filtering (i.e., blurring) the ECG, or adding independent quality factors (such as signal kurtosis and skewness), can help ameliorate this ECG tracking issue. Note, however, that the presence of an ABP signal is not a necessary condition for accurate prediction of PPG, as shown from the limited ABP set (see Table I) and the example in Fig. 5. Accurate PPG predictions can be obtained from ECG leads alone because of the causality condition and the broadband nature of the ECG signals [23], [24].
It might be feasible to implement the SQI algorithm in real time. The MCAF filter would need to be trained for each patient, when signals are first recorded and perhaps intermittently as well, to adapt to changing patient condition. The 9.5-min training time used in this study was chosen to be sufficiently long to ensure that the MCAF filter parameters stabilize. A separate investigation could elucidate the optimal training duration and facilitate a more useful real-time implementation, in particular investigating the degradation in performance as training time is reduced from 9.5 min to several seconds. It might also be possible to eliminate or significantly minimize training by picking a predefined set of values for the poles and forgetting factors, or by making them adaptive as suggested in [30] and [42]–[44].
While the SQI algorithm described in this paper shows promising results, it is also important to highlight its key assumptions. In particular, the algorithm assumes that the MCAF and its predictions are consistent and stable in the 30 s forecast window [23]. An unstable (or poor) prediction could be due to the MCAF algorithm rather than the signal quality in the target channel per second. Thus, the ability to detect instability of the MCAF prediction can be useful for improving the quality estimation. Another important assumption of the algorithm is the lack of correlation between noise in the target channel and noise in the other channels. Under some circumstances, such as in intense movements or when applying the MCAF SQI algorithm to other channels, the assumption of uncorrelated signals may not be valid. In particular, when predicting SQI on ECG channels, removal of all other ECGs as inputs into the MCAF filter might be required.
V. Conclusion
This paper presents a new SQI for physiological waveforms based on adaptive multichannel processing. The quality index was found to be monotonically related to both simulated SNR and human quality perception of 1361 waveforms. A recursive (i.e., online) implementation of this signal quality algorithm may also make it more attractive for real-time applications such as false alarm reduction, robust estimation of clinical vital signs, and filtering of telehealth data.
Acknowledgments
The authors would like to thank Y. Gocke for help with the human labeling of the signals. The authors are grateful to K. Pierce, D. J. Scott, and the two anonymous reviewers for valuable feedback on the paper.
This research was supported by grant R01-EB001659 and cooperative aggreement U01-EB-008577 from the National Institute of Biomedical Imaging and Bioengineering (NIBIB) of the National Institutes of Health (NIH).
Biographies
 Ikaro Silva (M’10) received the M.Sc. degree in electrical and computer engineering in 2004 and the Ph.D. degree in computer and electrical engineering both from Northeastern University, Boston, MA.
He is currently a Postdoctoral Fellow in the Laboratory for Computational Physiology, Harvard-MIT Division of Health Sciences and Technology. His research focuses on the National Institutes of Health-funded project “Research Resource for Complex Physiologic Signals (PhysioNet).” He was with The MathWorks, Natick, MA, for two years. His research interests include adaptive filtering, statistical signal processing, detection and estimation theory, telemedicine, biosignal processing, and nonstationary analysis.
 Joon Lee (M’11) received the B.A.Sc. degree in electrical engineering from the University of Waterloo, Waterloo, ON, Canada, and the Ph.D. degree from the Biomedical Group, Department of Electrical and Computer Engineering, University of Toronto, Toronto, ON.
He is currently a Postdoctoral Fellow in the Laboratory for Computational Physiology, Harvard-MIT Division of Health Sciences and Technology. He also holds a Postdoctoral Fellowship from the Natural Sciences and Engineering Research Council of Canada. His research interests include the domains of medical informatics, biomedical signal processing, machine learning, pattern recognition, and data mining, with a motivation to make the current healthcare system more efficient and cost-effective. His current main research focus is on the National Institutes of Heath-funded research program “Integrating Data, Models, and Reasoning in Critical Care.” His research activities range from retrospective clinical studies to development of automated clinical decision support algorithms.
 Roger G. Mark (F’08) received the S.B. and Ph.D. degrees in electrical engineering from the Massachusetts Institute of Technology (MIT), Cambridge, MA, and the M.D. degree from Harvard Medical School, Boston, MA.
He is currently a Distinguished Professor of Health Sciences and Technology, and a Professor of electrical engineering at MIT. He trained in internal medicine at the Harvard Medical Unit, Boston City Hospital, and then spent two years in the Medical Corps, United States Air Force, studying the biological effects of laser radiation. In 1969, he joined the faculty of the Department of Electrical Engineering, MIT, and also the faculty of the Department of Medicine, Harvard Medical School. He is investigating techniques to utilize the enormous volumes of clinical and physiologic data generated by patients in ICUs in order to track and possibly predict their pathophysiological state. The techniques being explored include multiparameter real-time signal processing, system identification and modeling, and expert systems. The goal is to solve the problem of information overload in the ICU, improve clinician–machine interface, decrease false alarm rates, and support clinical decision making. His research interests include physiological signal processing and database development, cardiovascular modeling, and intelligent patient monitoring.
Dr. Mark is a fellow of the American College of Cardiology, and a founding fellow of the American Institute of Medical and Biological Engineering.
Footnotes
Color versions of one or more of the figures in this paper are available online at http://ieeexplore.ieee.org.
Contributor Information
Ikaro Silva, Email: ikaro@mit.edu.
Joon Lee, Email: joonlee@mit.edu.
Roger G. Mark, Email: rgmark@mit.edu.
References
- 1.Wang JY. A new method for evaluating ECG signal quality for multi-lead arrhythmia analysis. Comput Cardiol. 2002;29:85–88. [Google Scholar]
- 2.Silva I, Moody G, Celi L. The physionet/computing in cardiology challenge 2011 : Improving the quality of ECGs collected using mobile phones. Comput Cardiol. 2011;38:273–276. [Google Scholar]
- 3.Lovell NH, Redmond SJ, Basilakis J, Celler BG. Biosignal Quality Detection: An Essential Feature for Unsupervised Telehealth Applications. Proc 12th IEEE Int Conf e-Health Netw Appl Services. 2010:81–85. [Google Scholar]
- 4.Sukor JA, Redmond SJ, Lovell NH. Signal quality measures for pulse oximetry through waveform morphology analysis. Physiol Meas. 2011;32(3):369–384. doi: 10.1088/0967-3334/32/3/008. [DOI] [PubMed] [Google Scholar]
- 5.Baura G. System Theory and Practical Applications of Biomedical Signals. Piscataway, NJ: IEEE Press; 2002. [Google Scholar]
- 6.Li Q, Mark RG, Clifford GD. Robust heart rate estimation from multiple asynchronous noisy sources using signal quality indices and a Kalman filter. Physiol Meas. 2008;29(1):15–32. doi: 10.1088/0967-3334/29/1/002. [DOI] [PMC free article] [PubMed] [Google Scholar]
- 7.Li Q, Mark RG, Clifford GD. Artificial arterial blood pressure artifact models and an evaluation of a robust blood pressure and heart rate estimator. BioMed Eng Online. 2009;8(1):13–28. doi: 10.1186/1475-925X-8-13. [DOI] [PMC free article] [PubMed] [Google Scholar]
- 8.Bartolo A, Clymer BD, Burgess RC, Turnbull JP, Golish JA, Perry MC. An arrhythmia detector and heart rate estimator for overnight polysomnography studies. IEEE Trans Biomed Eng. 2001 May;48(5):513–521. doi: 10.1109/10.918590. [DOI] [PubMed] [Google Scholar]
- 9.Allen J, Murray A. Assessing ECG signal quality on a coronary care unit. Physiol Meas. 1996;17(4):249–258. doi: 10.1088/0967-3334/17/4/002. [DOI] [PubMed] [Google Scholar]
- 10.Goldberger AL, Amaral LA, Glass L, Hausdorff JM, Ivanov PC, Mark RG, Mietus JE, Moody GB, Peng CK, Stanley HE. Physiobank, physiotoolkit, and physionet: Components of a new research resource for complex physiologic signals. Circulation. 2000;101(23):E215–E220. doi: 10.1161/01.cir.101.23.e215. [DOI] [PubMed] [Google Scholar]
- 11.Moody BE. Rule-based methods for ECG quality control. Comput Cardiol. 2011;38:361–363. [Google Scholar]
- 12.Hayn D, Jammerbund B, Schreier G. ECG quality assessment for patient empowerment in mhealth applications. Comput Cardiol. 2011;38:353–356. [Google Scholar]
- 13.Chudacek V, Zach L, Kuzilek J, Spilka J, Lhotska L. Simple scoring system for ECG quality assessment on android platform. Comput Cardiol. 2011;38:449–451. [Google Scholar]
- 14.Xia H, Garcia GA, McBride JC, Sullivan A, Bock TD, Bains J, Wortham DC, Zhao X. Computer algorithms for evaluating the quality of ECGs in real time. Comput Cardiol. 2011;38:369–372. [Google Scholar]
- 15.Clifford GD, Lopez D, Li Q, Rezek I. Signal quality indices and data fusion for determining acceptability of electrocardiograms collected in noisy ambulatory environments. Comput Cardiol. 2011;38:285–288. [Google Scholar]
- 16.Gil E, Mariavergara J, Laguna P. Detection of decreases in the amplitude fluctuation of pulse photoplethysmography signal as indication of obstructive sleep apnea syndrome in children. Biomed Signal Process Control. 2008;3(3):267–277. [Google Scholar]
- 17.Deshmane AV. PhD dissertation. Massachusetts Institute of Technology, Dept. Electr. Eng., Comput. Sci; Cambridge, MA: 2009. False arrhythmia alarm suppression using ECG, ABP, and photoplethysmogram. [Google Scholar]
- 18.Krishnan R, Natarajan B, Warren S. Analysis and detection of motion artifact in photoplethysmographic data using higher order statistics. Proc IEEE Int Conf Acoust Speech Signal Process. 2008:613–616. [Google Scholar]
- 19.Krishnan R, Natarajan B, Warren S. Two-stage approach for detection and reduction of motion artifacts in photoplethysmographic data. IEEE Trans Biomed Eng. 2010 Aug;57(8):1867–1876. doi: 10.1109/TBME.2009.2039568. [DOI] [PubMed] [Google Scholar]
- 20.Zong W, Moody GB, Mark RG. Reduction of false arterial blood pressure alarms using signal quality assessment and relationships between the electrocardiogram and arterial blood pressure. Med Biol Eng Comput. 2004 Sep;42(5):952–960. doi: 10.1007/BF02347553. [DOI] [PubMed] [Google Scholar]
- 21.Sun JX, Reisner AT, Mark RG. A signal abnormality index for arterial blood pressure waveforms. Comput Cardiol. 2006;33:13–16. [Google Scholar]
- 22.Chen L, McKenna T, Reisner A, Reifman J. Algorithms to qualify respiratory data collected during the transport of trauma patients. Physiol Meas. 2006;27(9):797–816. doi: 10.1088/0967-3334/27/9/004. [DOI] [PubMed] [Google Scholar]
- 23.Silva I. Physionet 2010 challenge: A robust multi-channel adaptive filtering approach to the estimation of physiological recordings. Comput Cardiol. 2010;37:5–8. [PMC free article] [PubMed] [Google Scholar]
- 24.Moody GB. The physionet/computing in cardiology challenge 2010: Mind the gap. Comput Cardiol. 2010;37:305–308. [PMC free article] [PubMed] [Google Scholar]
- 25.Saeed M, Villarroel M, Reisner AT, Clifford G, Lehman LW, Moody G, Heldt T, Kyaw TH, Moody B, Mark RG. Multiparameter intelligent monitoring in intensive care II (MIMIC-II): A public-access intensive care unit database. Crit Care Med. 2011;39(5):952–960. doi: 10.1097/CCM.0b013e31820a92c6. [DOI] [PMC free article] [PubMed] [Google Scholar]
- 26.Cohen J. A coefficient of agreement for nominal scales. Educ Psychol Meas. 1960;20(1):37–46. [Google Scholar]
- 27.Gwet KPD. Inter-rater reliability: Dependency on trait prevalence and marginal homogeneity. Statist Methods InterRater Reliab Assess. 2002;2(2):1–9. [Google Scholar]
- 28.Haley D, Thomas P. Using a new inter-rater reliability statistic. System. 2008:1–24. [Google Scholar]
- 29.Fejzo Z, Lev-Ari H. Adaptive Laguerre-lattice filters. IEEE Trans Signal Process. 1997 Dec;45(12):3006–3016. [Google Scholar]
- 30.Haykin S. Adaptive Filter Theory. 4. Englewood Cliffs, NJ: Prentice Hall; 2001. [Google Scholar]
- 31.Clifford GD, Azuaje F, McSharry PE. Advanced Methods and Tools for ECG Data Analysis. Norwood, MA: Artech House; 2006. [Google Scholar]
- 32.Sörnmo L, Laguna P. In: Bioelectrical Signal Processing in Cardiac and Neurological Applications. Sornmo L, Laguna P, editors. New York: Academic; 2005. [Google Scholar]
- 33.Rangayyan RM. Biomedical Signal Analysis: A Case-Study Approach. New York: Wiley-IEEE Press; 2001. [Google Scholar]
- 34.Kalman RE. A new approach to linear filtering and prediction problems. J Basic Eng. 1960;82:35–45. [Google Scholar]
- 35.American National Standard, Association for the Advancement of Medical Instrumentation. Arlington, VA: ANSI/AAMI EC13; 2002. [Google Scholar]
- 36.Athanasios P, Pillai US. Probability, Random Variables, and Stochastic Processe (Series in Electrical and Computer Engineering) 4. New York: McGraw-Hill; 2002. [Google Scholar]
- 37.Gil E, Monasterio V, Laguna P, Maria Vergara J. Pulse photopletismography amplitude decrease detector for sleep apnea evaluation in children. Proc Int Conf IEEE Eng Med Biol Soc. 2005;3:2743–2746. doi: 10.1109/IEMBS.2005.1617039. [DOI] [PubMed] [Google Scholar]
- 38.Davis J, Goadrich M. The relationship between precision-recall and ROC curves. Proc 23rd Int Conf Mach Learning. 2006:233–240. [Google Scholar]
- 39.Marino PL. The ICU book. 2. Baltimore, MD: Williams and Wilkins; 1998. [Google Scholar]
- 40.Stanley GB, Poolla K, Siegel RA. Threshold modeling of autonomic control of heart rate variability. IEEE Trans Biomed Eng. 2000 Sep;47(9):1147–1153. doi: 10.1109/10.867918. [DOI] [PubMed] [Google Scholar]
- 41.Barbieri R, Matten EC, Alabi AA, Brown EN. A point-process model of human heartbeat intervals: New definitions of heart rate and heart rate variability. Amer J Physiol Heart Circulatory Physiol. 2005;288(1):H424–H435. doi: 10.1152/ajpheart.00482.2003. [DOI] [PubMed] [Google Scholar]
- 42.Cerrutti S, Marchesi C. Advanced Methods of Biomedical Signal Processing. Vol. 11. Piscataway, NJ: IEEE Press; 2011. pp. 265–268. [Google Scholar]
- 43.Silva TO. On the adaptation of the pole of Laguerre-lattice filters. Proc Eur Signal Process Conf. 1996:1239–1242. [Google Scholar]
- 44.Boukis C, Mandic DP, Constantinides AG, Polymenakos LC. A novel algorithm for the adaptation of the pole of Laguerre filters. IEEE Signal Process Lett. 2006 Jul;13(7):429–432. [Google Scholar]


