

Abstract
Background
Diagnosis of intestinal ischemia remains a clinical challenge. The aim of the present study was to use a metabolomic protocol to identify upregulated and downregulated small molecules (Mr < 500) in the serum of mice with intestinal ischemia. Such molecules could have clinical utility when evaluated as biomarkers in human studies.
Methods
A mouse model for intestinal ischemia was established and validated using histology and serum tumor necrosis factor α concentrations. A second mouse model of peritoneal sepsis was used as a positive control. Serial serum samples were collected from these and from sham-operated animals. Sera were analyzed by gas chromatography–mass spectrometry for 40 small molecules as their trimethylsilyl and O-methyloxime derivatives. Peak areas were normalized against an internal standard and resultant peak area ratios subjected to multivariate data analysis using unsupervised principal components analysis and supervised orthogonal projection to latent structures–discriminant analysis. Upregulated and downregulated serum molecules were identified from their correlation to the orthogonal projection to latent structures–discriminant analysis model.
Results
Three highly significantly upregulated (fold-change) serum molecules in intestinal ischemia were inorganic phosphate (2.4), urea (4.3), and threonic acid (2.9). Five highly significantly downregulated (fold-change) serum molecules were stearic acid (1.7), arabinose (2.7), xylose (1.6), glucose (1.4), and ribose (2.2). Lactic acid remained unchanged in intestinal ischemia.
Conclusions
Distinct molecular changes are reported here for the first time in intestinal ischemia. They reveal impairments of gut microbiota metabolism, intestinal absorption, and renal function, together with increased oxidative stress. In contrast to other reports, lactic acid was not significantly changed. These molecular signatures may now be evaluated in clinical studies.
Keywords: Metabolomics, Intestinal ischemia, Peritoneal sepsis, Metabolite profiling, Gas chromatography–mass spectrometry, Biomarkers
1. Introduction
Despite surgical research and progress in patient care over the last decades, intestinal ischemia remains a life-threatening disease associated with high mortality, typically because early diagnosis is often difficult or not possible [1]. Early diagnosis of bowel ischemia remains a clinical dilemma as current diagnostic markers have a low sensitivity and specificity [2]. For a number of years, researchers have attempted to identify biomarkers of gut ischemia from among the effluent of proteins and metabolites that gain access to the peripheral circulation. Such biomarkers are conceived as being useful for the early detection of ischemia and its differential diagnosis. To be of practical clinical utility, such biomarkers should have high reproducibility, specificity, and sensitivity; and these conditions, in most cases, have not been met. Lactate is the most prominent and widely used marker for intestinal ischemia because of cell death and associated metabolic acidosis in response to intestinal ischemia. Clinical studies reveal conflicting results regarding sensitivity of lactate as a diagnostic marker [2]. Other putative biomarkers are proteins and peptides that include fatty acid binding proteins [2–4], ischemia-modified albumin [5], D-dimer [6,7], adrenomedullin [8], adrenomedullin binding protein-1 [8], and procalcitonin [9]. A list of some 25 enzymes, peptides, and proteins as biomarkers of intestinal ischemia has been published [10]. All of these, however, lack sufficient sensitivity and specificity.
In critically ill patients, novel biomarkers for noninvasive blood tests are required in order to identify early signs of bowel ischemia. Toward this end, we have employed gas chromatography–mass spectrometry (GCMS)-based metabolomics in a mouse model of intestinal ischemia. As a positive control for the metabolomic analysis, peritoneal sepsis was employed, also in a mouse model. Metabolomics is the global unbiased determination of the complement of small molecules (<1 kDa) in a biological fluid, tissue, organ, or organism [11,12]. Here we report a number of serum biomarkers of intestinal ischemia discovered using metabolomics in the mouse.
2. Materials and methods
2.1. Animals
All procedures were carried out in accordance with the National Institutes of Health guidelines for the care and use of experimental animals and the study was approved by the Animal Care Committee of the Canton of Bern, Switzerland. Animals used were 8–10-wk-old wild-type C57/BL6 mice, which were obtained from Harlan Animal Research Laboratories Boxmeer, The Netherlands or from the Animal Facility of the University of Bern. The animals were housed at 22°C in the University Animal Facility with a 12-h light/dark cycle. For ethical reasons, a pilot study in a small group of animals was first performed without committing a larger number of animals to the surgical procedures until it was clear that a metabolomic result would be found.
For the generation of an intestinal ischemia mouse model, a midline laparotomy was performed under general anesthesia with inhalation of isoflurane. Intestinal ischemia was created by ligation and transection of three segmental branches of the superior mesenteric vessels with consequential ischemia of the intestine for 2 or 4 h. After laparotomy, the intestine was manipulated without affecting the vascular structures in a group of sham-operated animals that served as negative controls. During the operation the intestine was rinsed with saline to avoid drying out. Finally, the abdomen was closed with two running sutures of the musculature and the skin. Postoperative analgesia therapy with buprenorphine (Reckitt Benckiser AG, Wallisellen, Switzerland) was administered subcutaneously. At the time of sacrifice, mice were anesthetized and blood was taken from the inferior vena cava and centrifuged to obtain serum, which was frozen at −80°C until analysis. In the pilot study, serum (50 μL) was collected from five sham-operated animals and at 2 h and 4 h post-ischemia from five and four surviving animals, respectively. In the principal study, serum (50 μL) was collected from 10 sham-operated animals and at 2 h and 4 h post-ischemia from 10 animals at both time points. Ten animals were used in each of these two groups. One of the ischemia group mice died due to bleeding shortly after creation of intestinal ischemia.
As a positive control for the metabolomic analysis, a group of animals was used to generate peritoneal sepsis. A midline laparotomy was again performed under general anesthesia with inhalation of isoflurane. To induce peritoneal sepsis, a cecal ligation and puncture method was used, as previously described [13]. Briefly, the cecum was exposed and the distal 8–10 mm was ligated, followed by a double puncture using a G18 needle. After expelling a small amount of stool, the cecum was replaced into the abdominal cavity and the animals were harvested after 12 h. In the pilot study, serum (50 μL) was collected from three surviving animals. In the principal study, serum (50 μL) was collected from eight surviving animals, two mice having died prior to sample collection.
2.2. Histologic examination of the small intestine
During harvest of the animals the intestine was removed and the macroscopically altered ischemic part was prepared for cryostat section using the “Swiss Roll” technique, as previously described [14]. Tissue sections of 8-μm thickness were deparaffinized with xylol and counterstained with hematoxylin-eosin for histologic assessment by Chiu score [15].
2.3. Chemicals and reagents
4-Chlorophenylacetic acid was obtained from Sigma-Aldrich Chemie GmbH (Buchs, Switzerland) and pyridine (purity ≥ 99.5%) from Merck KGaA (Darmstadt, Germany). Solvents and inorganic reagents were of the highest available purity.
2.4. Measurement of tumor necrosis factor α by enzyme-linked immunosorbent assay
The serum concentration of tumor necrosis factor α (TNF-α) was examined using an immunoassay kit (PeproTech Inc., Rocky Hill, NJ) according to the vendor’s recommended protocol.
2.5. Gas chromatography–mass spectrometry
Mouse serum samples first underwent an extraction procedure to create an organic and aqueous phase as follows: To serum (30 μL) was added aqueous internal standard solution (1.00 mL, containing 200 μM 4-chlorophenylacetic acid as internal standard), followed by methanol/chloroform (3:1 vol/vol; 1.00 mL) and 0.9% sodium chloride solution (500 μL). Tubes were shaken horizontally for 20 min, centrifuged, and the upper aqueous phase transferred (3 × 200 μL) and blown down in 1.0-mL Reacti-Vials (Thermo-Fischer Scientific [Schweiz] AG, Basel, Switzerland) under a gentle steam of N2. To ensure complete removal of water, anhydrous pyridine (25 μL) was added to each triplicate and the samples blown to dryness under N2. A two-step derivatization procedure involving methoxamine hydrochloride and BSTFA/TMCS (N,O-bis[trimethylsilyl] trifluoroacetamide/trimethylchlorosilane) was employed as described [16]. Triplicates were subjected to GCMS analysis under exact conditions, as described previously, with a total run time of 70.5 min and a cycle time of approximately 80 min [16]. Additionally, blank samples and various standards were interspersed within the analytical samples.
2.6. Identification of metabolites
We chose not to preprocess raw chromatographic data with peak alignment and normalization, but rather to first identify as many metabolites as possible in the chromatograms, calculate the relative concentration (peak area/peak area of internal standard) of each, and use these data for multivariate data analysis. The RTE integrator of the Agilent instrument Chem-Station software (Agilent Technologies, Basel, Switzerland)was used to integrate the 100 most abundant peaks from the 135 (95% CI, 130–140) peaks detected in each chromatogram. The smallest of these peaks represented ~0.02% of the total ion current. Identification of analytes was achieved by comparison of their mass spectra with the ~575,000 spectra in the NIST Mass Spectral Database (NIST/EPA/NIH Mass Spectral Library version 2.0, National Institute of Standards and Technology, Gaithersburg, MD) using both an in-built algorithm and visual inspection, and, where available, authentic standards.
2.7. Determination of relative concentrations
Aggregation and manipulation of chromatographic data was first performed in Excel (Microsoft Corporation, Redmond, WA). The first process was to sum the areas of peaks that were derived from the same analyte due to differential derivatization, as occurred for arabinose and glucose (see below). The second process was to calculate relative concentrations for all analytes by dividing each peak area obtained from the Chem-Station software by the peak area of the internal standard, thus generating peak area ratios, which are relative concentrations. The third process was to inspect each triplicate and remove any outlying values, which occurred in ~5% of cases for the 44 quantitated peaks. Relative concentrations for each analyte were then averaged and these mean values exported for multivariate data analysis, statistical analysis, and graphical representation. These tasks were performed manually.
2.8. Multivariate data analysis
All data were exported from Excel, Pareto-scaled, and further analyzed by principal components analysis (PCA) and orthogonal projection to latent structures–discriminant analysis (OPLS-DA) employing SIMCA-P+ software (version 12) from Umetrics AB (Umeå, Sweden). For OPLS-DA, the samples were classified according to their group membership as sham-operated (class 0; y = 0), 2-h ischemia (class 1; y = 1), 4-h ischemia (class 2; y = 2), and sepsis (class 3; y = 3). Biomarkers were selected according to their contribution and correlation to the OPLS-DA model, as previously described [17], provided that they showed statistical significance (2-tailed Mann-Whitney U test; P < 0.006, due to Bonferroni correction for multiple comparisons) between sham-operated and ischemia or sepsis groups.
2.9. Statistical analysis
Data were exported from Excel into GraphPad Prism (version 5, GraphPad Software, Inc, La Jolla, CA) and first inspected visually. Statistical evaluation of each biomarker between sham-operated and 4-h post-ischemia was made in Prism using a 2-tailed Mann-Whitney U test with Bonferroni correction for multiple comparisons.
3. Results
3.1. Quantitative evaluation of intestinal ischemia
Histologic evaluation of the small intestine was performed on the sham-operated mice, together with the 2-h and 4-h ischemia mice. Typical histologies are shown in Figure 1. Control animals revealed a normal intestinal histology with intact mucosal villi without any necrosis or inflammatory infiltrations, whereas after 2 h of intestinal ischemia there was an influx of inflammatory cells to the lamina propria with beginning of epithelial lifting and disintegration of mucosal villi structure (Fig. 1A and B). Long-term ischemia of the intestine was associated with a complete digestion and disintegration of the lamina propria, with ulceration and loss of mucosal villi structure (Fig. 1C). Analysis of histology using the Chiu score revealed a significantly higher score after 2 and 4 h of intestinal ischemia in comparison with control animals (Fig. 2). Finally, there was a significant increase of TNF-α in the serum in septic animals and animals with intestinal ischemia compared with control animals (Fig. 3). There was no further increase of TNFα after long-term ischemia in comparison with sepsis or short term of intestinal ischemia. The presence of small bowel ischemia was therefore clearly established at both 2 h and 4 h.
Fig. 1.

Representative histologic pictures of hematoxylin-eosin staining of the terminal ileum in control animals (A) and after 2 h (B) and 4 h (C) of intestinal ischemia, showing an influx of inflammatory cells and progressive destruction of intestinal mucosal structure. (Color version of figure is available online.)
Fig. 2.
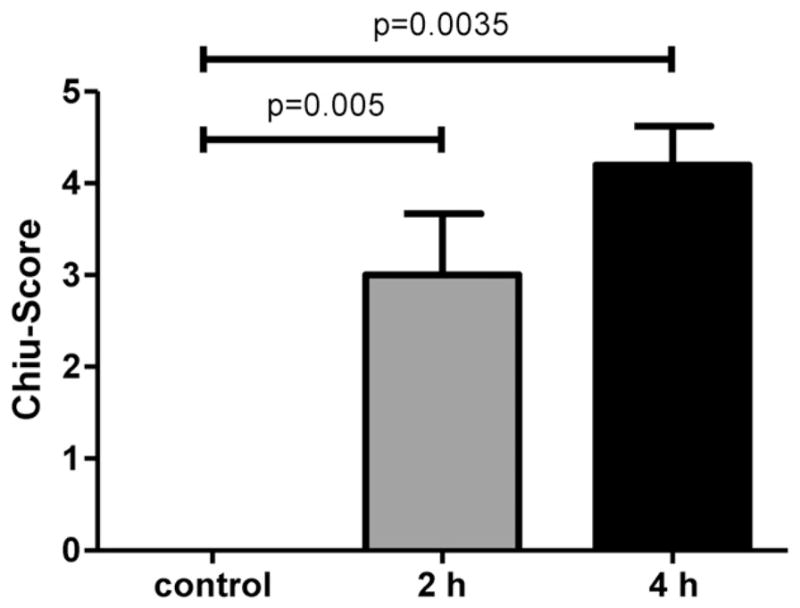
Histologic assessment of intestinal ischemia by Chiu score of the terminal ileum revealed a significant increase during ischemic damage of the small intestine.
Fig. 3.
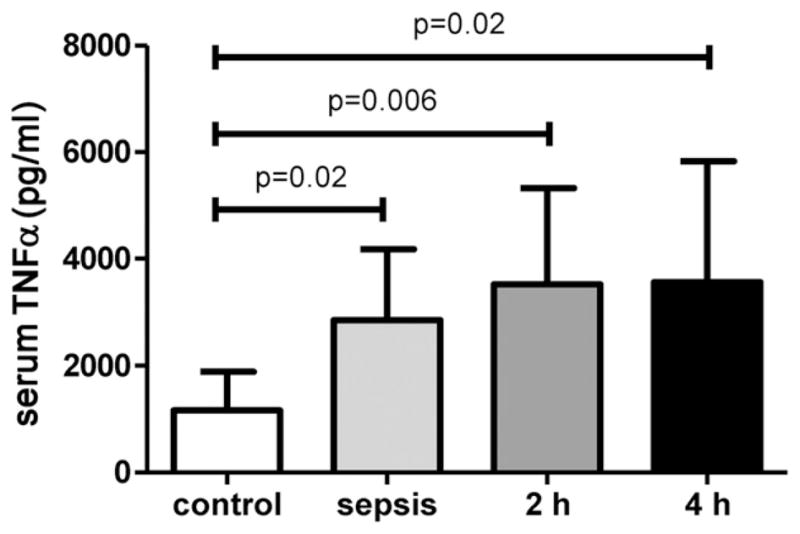
Serum TNF-α levels (pg/mL) showed a significant increase after sepsis and intestinal ischemia in comparison to control animals.
3.2. Detection and relative quantitation of metabolites
Of the 100 integrated peaks per chromatogram, 44 could be identified by matching with library spectra (Table). One of these was the internal standard, and arabinose and glucose ran as three and two resolvable peaks, respectively. In the case of arabinose, this was due to arabinose forming three structurally isomeric trimethylsilyl derivatives; in the case of glucose, the N-methoxyoxime derivative existed as cis- and trans- isomers that chromatographed separately. In these two cases, relative concentrations for multivariate data analysis were calculated by summation of the respective peak area ratios. The total number of analytes that could be evaluated in this study as relative concentrations was therefore 40. This number compares well with published metabolomic studies of the human plasma metabolome [18,19]. The identified serum constituents comprised eight carboxylic acids, seven amino acids, nine sugars, four polyols, six saturated monoglycerides, two gut microbiota metabolites (benzoic acid and benzyl alcohol), inorganic phosphate, creatinine, urea, and ethanolamine.
Table.
Identification of analytes by GCMS.
| RT (min) | Peak identity | TMS | MOX |
|---|---|---|---|
| 12.11 | Valeric acid (pentanoic acid) | 1 | 0 |
| 14.87 | Lactic acid | 2 | 0 |
| 15.18 | Caproic acid (hexanoic acid) | 1 | 0 |
| 15.35 | Glycolic acid (2-hydroxyethanoic acid) | 2 | 0 |
| 16.33 | Alanine | 2 | 0 |
| 18.12 | Benzyl alcohol | 1 | 0 |
| 18.33 | β-Hydroxybutyric acid (3-hydroxybutanoic acid) | 2 | 0 |
| 20.36 | Valine | 2 | 0 |
| 20.97 | Urea | 2 | 0 |
| 21.37 | Benzoic acid | 1 | 0 |
| 21.12 | Ethanolamine (2-aminoethanol) | 3 | 0 |
| 22.40 | Leucine | 2 | 0 |
| 22.43 | Inorganic phosphate | 3 | 0 |
| 23.06 | Isoleucine | 2 | 0 |
| 23.50 | Glycine | 3 | 0 |
| 26.27 | Threonine | 3 | 0 |
| 26.99 | Homocysteine | 3 | 0 |
| 29.12 | 4-Chlorophenylacetic acid (internal standard) | 1 | 0 |
| 30.69 | Malonic acid (enol) | 3 | 0 |
| 30.89 | Creatinine (enol) | 3 | 0 |
| 31.82 | Erythronic acid | 4 | 0 |
| 33.24 | Xylopyranose (xylose ring –opened) | 4 | 0 |
| 33.35 | Arabinofuranose (arabinose 5-membered ring) | 4 | 0 |
| 33.48 | Arabinose (ring-opened) | 4 | 0 |
| 34.05 | Arabinopyranose (arabinose 6-membered ring) | 4 | 0 |
| 34.38 | Ribose | 4 | 0 |
| 36.50 | Xylitol | 5 | 0 |
| 39.87 | 2-Deoxygalactopyranose (2-deoxygalactose) | 4 | 0 |
| 40.63 | Fructose | 5 | 1 |
| 40.99 | Mannitol | 6 | 0 |
| 41.37 | Glucose (ring-opened) | 5 | 1 |
| 41.79 | Glucose (ring-opened) | 5 | 1 |
| 42.29 | Gluconic acid | 6 | 0 |
| 43.02 | Galactonic acid | 6 | 0 |
| 43.15 | Glucopyranose (glucose 6-membered ring) | 5 | 0 |
| 43.73 | Ribitol | 5 | 0 |
| 44.06 | Palmitic acid (hexadecanoic acid) | 1 | 0 |
| 45.88 | myo-Inositol | 6 | 0 |
| 51.81 | 1-Myristoylglycerol | 2 | 0 |
| 54.89 | 2-Palmitoylglycerol | 2 | 0 |
| 55.54 | 1-Palmitoylglycerol | 2 | 0 |
| 58.77 | 2-Stearoylglycerol | 2 | 0 |
| 59.51 | 1-Stearoylglycerol | 2 | 0 |
| 62.99 | 1-Eicosanoylglycerol | 2 | 0 |
RT = retention time; TMS = number of trimethylsilyl groups; MOX = number of methoxamine groups.
3.3. Identification of biomarkers using multivariate data analysis
Figure 4A shows a PCA scores plot for the pilot study data. PCA, as a first step, shows the internal structure of the data set. As an unsupervised analysis, PCA has the advantage of revealing if there is clustering of, and separation between, subsets of the data. When this was performed on the pilot data, two sham samples fell outside the Hotelling’s ellipse; thus, they were removed and the PCA analysis repeated with only three sham samples. It can be seen that samples from the sham-operated animals and the 2-h ischemia samples clustered together, suggesting minimal metabolite profile differences between these two data sets. This is not an issue of sensitivity of the GCMS assay; rather, this means that there are minimal metabolite profile differences between the sham and 2-h ischemia samples. However, it can be seen that the 4-h ischemia samples cluster distinctly from the sham and 2-h samples. Moreover, the peritoneal sepsis samples deployed as a positive control showed a major shift from the sham controls in component 1 of the variance. This finding in a small number of mice encouraged us to undertake a bigger study. When such a study was undertaken, two sera from the 4-h ischemia group and two sera from the sepsis group fell outside the Hotelling ellipse (data not shown), and so these outliers were removed and the PCA run again. The resulting pattern in the PCA scores plot (Fig. 4C) replicated the pilot study scores plot (Fig. 4A), with sham and 2-h ischemia samples clustering together and distinctly different 4-h ischemia samples and peritoneal sepsis samples. When sham and 4-h ischemia alone were analyzed by PCA, a clear separation of the data into two clusters was obtained (Fig. 4D). Examination of the loadings using an OPLS-DA model and an S-plot graphical presentation of the metabolites responsible for the group separation of sham and 4-h ischemia (Fig. 4E) revealed a number of metabolites that were highly correlated to the OPLS-DA model, with correlations above 0.7 (associated with sham samples) or below −0.7 (associated with 4-h ischemia samples).
Fig. 4.

(A,B) Pilot study. (A) PCA scores plot for three sham-operated negative control animals (
 ) and four intestinal ischemia animals at 2 h (
 ) and at 4 h (
 ) together with three peritoneal sepsis–positive control animals (
 ). Note that the sham controls and 2-h ischemia animals clustered together, but that the 4-h ischemia and peritoneal sepsis animals clustered separately from the other two groups. (B) PCA scores plot for sham versus 4-h ischemia. Symbol key as above. (C,D) Principal study. (C) PCA scores plot for 10 sham-operated negative control animals and 10 intestinal ischemia animals at 2 h and at 4 h together with 8 peritoneal sepsis–positive control animals. Note that, as in the pilot study, the sham controls and 2-h ischemia animals clustered together, but that the 4-h ischemia and peritoneal sepsis animals clustered separately from the other two groups. (D) PCA scores plot for sham versus 4-h ischemia. Symbol key as above. (E) OPLS-DA loadings S-plot showing five markers highly significantly associated with sham-operated animals (
 ) (downregulated in ischemia) and three markers highly significantly associated with 4-h intestinal ischemia (
 ) (upregulated in ischemia). Markers were chosen on the basis of a correlation value > 0.7 or < −0.7. (Color version of figure is available online.)
Five metabolites were found to be associated with the sham-operated animals, that is, downregulated in intestinal ischemia at 4 h. Three metabolites were found to be associated with 4-h intestinal ischemia animals, that is, upregulated in ischemia. Figure 5 depicts mean ± SD values for each of these metabolites and the scales of relative concentrations for each metabolite. Because of the nonequivalence in variances, group comparisons were made using a nonparametric 2-tailed Mann-Whitney U test with Bonferroni correction for multiple comparisons (n = 8). The differences in the case of each metabolite were highly statistically significant. One fatty acid and four sugars were downregulated in intestinal ischemia and the vitamin C metabolite, threonic acid, together with urea and inorganic phosphate were upregulated in intestinal ischemia (Fig. 5). The average change in these markers was approximately 2.5-fold, or 250%. It should be noted that lactic acid was unaltered in intestinal ischemia in our experiments.
Fig. 5.

The top eight metabolites responsible for the separation between sham-operated sera and intestinal ischemia 4-h sera. Downregulated metabolites were stearic acid, arabinose, xylose, glucose, and ribose. Upregulated metabolites were threonic acid, urea, and inorganic phosphate. Ordinate values are peak area ratios (PAR), i.e., relative concentrations (area of peak/area of internal standard peak × 1000) of each metabolite. Bars represent mean ± standard deviation. S denotes sham; 4 denotes intestinal ischemia 4-hour sample. *** denotes P < 0.001 and ** denotes P = 0.002, by 2-tailed Mann-Whitney U test with Bonferroni correction for multiple comparisons (n = 8).
4. Discussion
TNF-α levels were significantly elevated after intestinal ischemia, reflecting an inflammatory process during ischemia and damage of the intestine. This inflammatory reaction was comparable to the abdominal sepsis and was due not only to the surgical intervention but also to the destruction of intestinal tissue. The model of intestinal ischemia used in this study was highly efficient, as histology revealed a distinct morphologic change in intestinal structure and influx of inflammatory cells to the site of cell damage. The previously introduced histologically based Chiu score during intestinal ischemia and reperfusion models showed an explicit increase of damage during progression of intestinal ischemia in this study that was already seen macroscopically in the smaller intestine.
Using gas chromatography–mass spectrometry-based metabolomics on mouse serum, we have reported here both upregulated and downregulated endogenous metabolites in a mouse model for intestinal ischemia. Serum samples drawn 2 h after the surgical initiation of intestinal ischemia could not be distinguished from sera taken from sham-operated mice on the basis of their PCA scores, either in the pilot study group (3 sham versus 5 ischemic) or in the principal study group (10 sham versus 10 ischemic). It was therefore decided to compare sham with 4-h ischemia in the search for serum metabolites that might be informative of intestinal ischemia. Eight such metabolites have been identified here and provide a window into the biochemical mechanisms associated with bowel ischemia.
Four monosaccharides, arabinose, xylose, glucose, and ribose, were all downregulated in the 4-h serum of mice with intestinal ischemia. Arabinose is produced by hydrolysis of dietary fiber such as wheat bran and ispaghula husk by the gut microbiota [20]. Both xylose and glucose can also be produced from these dietary fiber sources in the colon [20]. Other studies show that glucose, xylose, and arabinose [21], and also ribose [22], are major products of the digestion of dietary fiber. It is possible that the results obtained here reflect a reduced production by the colonic microbiota of absorbable monosaccharides from dietary fiber under conditions of experimental bowel ischemia. However, it is also likely that reduced transport of sugars from the intestinal lumen occurred as a result of intestinal ischemia.
The observation that stearic acid serum concentrations were highly significantly reduced in intestinal ischemia is of interest. This saturated fatty acid appears to be mainly of dietary origin and its principal role would appear to be as a substrate of stearoyl–CoA desaturase-1 in the synthesis of oleic acid in the liver [23]. However, experiments incubating the polyunsaturated fatty acid linoleic acid with human fecal homogenates under anaerobic conditions led to the reductive conversion of linoleic acid into stearic acid by colonic bacteria [24]. As with the aforementioned monosaccharides, decreased serum stearic acid may be part of a metabolic signature reflecting decreased colonic microbiota metabolism in the ischemic bowel.
The greater than 4-fold increase in serum urea is presumably a reflection of hypovolemia and/or reduced glomerular filtration rate. It is extremely unlikely that elevated blood urea nitrogen would go unnoticed and uncorrected in the critical care patient. This finding is unlikely to be of value in clinical studies. The elevation in serum phosphate is presumably also a reflection of an acute change in renal function. It is known that hyperphosphatemia may exacerbate renal function [25], but presumably not in an acute setting. Phosphate homeostasis is complex and involves phosphate transport across the intestine [26]. There have been old reports that blood phosphate levels rise in acute mesenteric ischemia [27,28], and our observations are consistent with these. It was suggested that the phosphate arises due to the sloughing of intestinal mucosa [28].
We report here an approximately 3-fold increase in serum threonic acid 4 h after commencement of intestinal ischemia in the mouse. L-Threonic acid ([2R,3S]-2,3,4-trihydroxybutanoic acid) is formed by the oxidative degradation of ascorbic acid [29]. However, this is unlikely to occur in the presence of ischemia. More likely is a mechanism involving an ischemic effect on mitochondrial respiration, which has been reported to generate elevated reactive oxygen species in studies of ischemic heart muscle [30]. The oxidation of endogenous/dietary ascorbic acid under conditions of oxidative stress, as has been observed in intestinal ischemia [31], occurs perhaps via an inflammatory cascade involving the production of TNF-α by colonic myocytes in response to ischemia [32]. Interestingly, we observed significant increases in circulating TNF-α in this study (Fig. 3). The production of elevated L-threonic acid may be the most specific metabolic signal that could be evaluated in translational studies.
We did not detect changes in lactic acid in our investigation. It had been reported that D-lactic acid, but not L-lactic acid, was a useful diagnostic marker for intestinal ischemia [2]. In addition, D-lactic acid in peritoneal fluid, but not plasma, of pigs with experimental high-grade intestinal ischemia reflected the ischemia. Our assay did not distinguish between D- and L-lactic acid, but a rise in D-lactic acid, unless it was at the expense of L-lactic acid, should have been detected by our methodologies; however, it was not.
This investigation was a proof-of-concept study to establish whether or not metabolomic biomarkers could be established for intestinal ischemia. Nevertheless, the study had some limitations, particularly with respect to the animal modeling of intestinal ischemia in humans. Our mouse model took no account of reperfusion injury that is commonplace in many other experimental models [33,34]. The gut microbiota has been implicated in the systemic inflammatory response to intestinal ischemia [10], but we made no determinations on the gut microbiota during our experiments. Finally, a question about the validity of the extrapolation of our findings to patients might be raised, but this was merely a proof-of-principle study. Our approach can now be applied in patients with suspected intestinal ischemia.
We have reported here a number of novel biochemical changes that are visible by the GCMS-based metabolomic analysis of mouse serum in animals with ischemia. These findings form the basis of future studies in patients with acute intestinal ischemia and may advance our ability to diagnose both better and noninvasively the presence of this condition in patients under critical care.
Acknowledgments
J.R.I. acknowledges the Hassan Badawi Foundation Against Liver Cancer and NIH (NIAID) grant number U19 AI067773-06/-07 for financial support.
References
- 1.Debus ES, Muller-Hulsbeck S, Kolbel T, et al. Intestinal ischemia. Int J Colorectal Dis. 2011;26:1087. doi: 10.1007/s00384-011-1196-6. [DOI] [PubMed] [Google Scholar]
- 2.Evennett NJ, Petrov MS, Mittal A, et al. Systematic review and pooled estimates for the diagnostic accuracy of serological markers for intestinal ischemia. World J Surg. 2009;33:1374. doi: 10.1007/s00268-009-0074-7. [DOI] [PubMed] [Google Scholar]
- 3.Pelsers MM, Hermens WT, Glatz JF. Fatty acid-binding proteins as plasma markers of tissue injury. Clin Chim Acta. 2005;352:15. doi: 10.1016/j.cccn.2004.09.001. [DOI] [PubMed] [Google Scholar]
- 4.Thuijls G, van Wijck K, Grootjans J, et al. Early diagnosis of intestinal ischemia using urinary and plasma fatty acid binding proteins. Ann Surg. 2011;253:303. doi: 10.1097/SLA.0b013e318207a767. [DOI] [PubMed] [Google Scholar]
- 5.Gunduz A, Turkmen S, Turedi S, et al. Time-dependent variations in ischemia-modified albumin levels in mesenteric ischemia. Acad Emerg Med. 2009;16:539. doi: 10.1111/j.1553-2712.2009.00414.x. [DOI] [PubMed] [Google Scholar]
- 6.Block T, Nilsson TK, Bjorck M, et al. Diagnostic accuracy of plasma biomarkers for intestinal ischaemia. Scand J Clin Lab Invest. 2008;68:242. doi: 10.1080/00365510701646264. [DOI] [PubMed] [Google Scholar]
- 7.Kulacoglu H, Kocaerkek Z, Moran M, et al. Diagnostic value of blood D-dimer level in acute mesenteric ischaemia in the rat: an experimental study. Asian J Surg. 2005;28:131. doi: 10.1016/S1015-9584(09)60277-3. [DOI] [PubMed] [Google Scholar]
- 8.Carrizo GJ, Wu R, Cui X, et al. Adrenomedullin and adrenomedullin-binding protein-1 downregulate inflammatory cytokines and attenuate tissue injury after gut ischemia-reperfusion. Surgery. 2007;141:245. doi: 10.1016/j.surg.2006.05.017. [DOI] [PubMed] [Google Scholar]
- 9.Markogiannakis H, Memos N, Messaris E, et al. Predictive value of procalcitonin for bowel ischemia and necrosis in bowel obstruction. Surgery. 2011;149:394. doi: 10.1016/j.surg.2010.08.007. [DOI] [PubMed] [Google Scholar]
- 10.Kinross J, Warren O, Basson S, et al. Intestinal ischemia/reperfusion injury: defining the role of the gut microbiome. Biomark Med. 2009;3:175. doi: 10.2217/bmm.09.11. [DOI] [PubMed] [Google Scholar]
- 11.Idle JR, Gonzalez FJ. Metabolomics. Cell Metab. 2007;6:348. doi: 10.1016/j.cmet.2007.10.005. [DOI] [PMC free article] [PubMed] [Google Scholar]
- 12.Mamas M, Dunn WB, Neyses L, et al. The role of metabolites and metabolomics in clinically applicable biomarkers of disease. Arch Toxicol. 2011;85:5. doi: 10.1007/s00204-010-0609-6. [DOI] [PubMed] [Google Scholar]
- 13.Bouchon A, Facchetti F, Weigand MA, et al. TREM-1 amplifies inflammation and is a crucial mediator of septic shock. Nature. 2001;410:1103. doi: 10.1038/35074114. [DOI] [PubMed] [Google Scholar]
- 14.Moolenbeck C, Ruitenberg EJ. The ‘Swiss Roll’. A simple technique for histological studies of the rodent intestine. Lab Anim. 1981;15:57. doi: 10.1258/002367781780958577. [DOI] [PubMed] [Google Scholar]
- 15.Chiu CJ, McArdle AH, Brown R, et al. Intestinal mucosal lesion in low-flow states. I. A morphological, hemodynamic, and metabolic reappraisal. Arch Surg. 1970;101:478. doi: 10.1001/archsurg.1970.01340280030009. [DOI] [PubMed] [Google Scholar]
- 16.Lanz C, Patterson AD, Slavik J, et al. Radiation metabolomics. 3. Biomarker discovery in the urine of gamma-irradiated rats using a simplified metabolomics protocol of gas chromatography-mass spectrometry combined with random forests machine learning algorithm. Radiat Res. 2009;172:198. doi: 10.1667/RR1796.1. [DOI] [PMC free article] [PubMed] [Google Scholar]
- 17.Tyburski JB, Patterson AD, Krausz KW, et al. Radiation metabolomics. 1. Identification of minimally invasive urine biomarkers for gamma-radiation exposure in mice. Radiat Res. 2008;170:1. doi: 10.1667/RR1265.1. [DOI] [PMC free article] [PubMed] [Google Scholar]
- 18.Jiye A, Trygg J, Gullberg J, et al. Extraction and GC/MS analysis of the human blood plasma metabolome. Anal Chem. 2005;77:8086. doi: 10.1021/ac051211v. [DOI] [PubMed] [Google Scholar]
- 19.Lawton KA, Berger A, Mitchell M, et al. Analysis of the adult human plasma metabolome. Pharmacogenomics. 2008;9:383. doi: 10.2217/14622416.9.4.383. [DOI] [PubMed] [Google Scholar]
- 20.Andersen JR, Bukhave K, Hojgaard L, et al. Decomposition of wheat bran and ispaghula husk in the stomach and the small intestine of healthy men. J Nutr. 1988;118:326. doi: 10.1093/jn/118.3.326. [DOI] [PubMed] [Google Scholar]
- 21.Slavin JL, Marlett JA, Neilson MJ. Determination and apparent digestibility of neutral detergent fiber monosaccharides in women. J Nutr. 1983;113:2353. doi: 10.1093/jn/113.11.2353. [DOI] [PubMed] [Google Scholar]
- 22.McAllan AB, Knight R, Sutton JD. The effect of free and protected oils on the digestion of dietary carbohydrates between the mouth and duodenum of sheep. Br J Nutr. 1983;49:433. doi: 10.1079/bjn19830052. [DOI] [PubMed] [Google Scholar]
- 23.Sampath H, Ntambi JM. The fate and intermediary metabolism of stearic acid. Lipids. 2005;40:1187. doi: 10.1007/s11745-005-1484-z. [DOI] [PubMed] [Google Scholar]
- 24.Howard FA, Henderson C. Hydrogenation of polyunsaturated fatty acids by human colonic bacteria. Lett Appl Microbiol. 1999;29:193. doi: 10.1046/j.1365-2672.1999.00616.x. [DOI] [PubMed] [Google Scholar]
- 25.Loghman-Adham M. Role of phosphate retention in the progression of renal failure. J Lab Clin Med. 1993;122:16. [PubMed] [Google Scholar]
- 26.Civitelli R, Ziambaras K. Calcium and phosphate homeostasis: concerted interplay of new regulators. J Endocrinol Invest. 2011;34:3. [PubMed] [Google Scholar]
- 27.Jamieson WG, Taylor BM, Troster M, et al. The significance of urine phosphate measurements in the early diagnosis of intestinal infarction. Surg Gynecol Obstet. 1979;148:334. [PubMed] [Google Scholar]
- 28.Taylor BM, Jamieson WG, Durand D. Preinfarction diagnosis of acute mesenteric ischemia by simple measurement of inorganic phosphate in body fluids. Can J Surg. 1979;22:40. [PubMed] [Google Scholar]
- 29.Knafo L, Chessex P, Rouleau T, et al. Association between hydrogen peroxide-dependent byproducts of ascorbic acid and increased hepatic acetyl-CoA carboxylase activity. Clin Chem. 2005;51:1462. doi: 10.1373/clinchem.2005.050427. [DOI] [PubMed] [Google Scholar]
- 30.Chen Q, Moghaddas S, Hoppel CL, et al. Ischemic defects in the electron transport chain increase the production of reactive oxygen species from isolated rat heart mitochondria. Am J Physiol Cell Physiol. 2008;294:C460. doi: 10.1152/ajpcell.00211.2007. [DOI] [PubMed] [Google Scholar]
- 31.Eleftheriadis E, Kotzampassi K, Papanotas K, et al. Gut ischemia, oxidative stress, and bacterial translocation in elevated abdominal pressure in rats. World J Surg. 1996;20:11. doi: 10.1007/s002689900002. [DOI] [PubMed] [Google Scholar]
- 32.Jarry A, Bach-Ngohou K, Masson D, et al. Human colonic myocytes are involved in postischemic inflammation through ADAM17-dependent TNFalpha production. Br J Pharmacol. 2006;147:64. doi: 10.1038/sj.bjp.0706449. [DOI] [PMC free article] [PubMed] [Google Scholar]
- 33.Masuko T, Funayama Y, Naito H, et al. Measurement of phosphatidylcholine hydroperoxide in mild ischemia-reperfusion injury in rat intestine. Tohoku J Exp Med. 2002;198:223. doi: 10.1620/tjem.198.223. [DOI] [PubMed] [Google Scholar]
- 34.Zhang F, Wu R, Zhou M, et al. Human adrenomedullin combined with human adrenomedullin binding protein-1 is protective in gut ischemia and reperfusion injury in the rat. Regul Pept. 2009;152:82. doi: 10.1016/j.regpep.2008.09.007. [DOI] [PMC free article] [PubMed] [Google Scholar]