Abstract
Objective
Recent reports suggest that ghrelin regulation may differ by ethnicity and age. This study was designed to examine circulating ghrelin among overweight African American females across different age groups.
Methods
Eleven overweight peri-pubertal girls, 17 overweight pubertal girls, and a control group of 18 overweight AA premenopausal women ingested a standard liquid meal following an overnight fast. Blood samples were obtained before the meal and for 4 hours post-challenge. Participants rated appetite by a visual analog scale.
Results
Peri-pubertal girls demonstrated higher postprandial ghrelin and lesser ghrelin suppression compared to adults (p<0.05), corresponding with greater desire to eat across the test period (p=0.017). Fasting ghrelin tended to be inversely related to fasting estradiol (r=−0.264, p=0.076).
Conclusion
Compared to overweight African American women, peri-pubertal girls had higher ghrelin as well as greater appetite after a standard meal. These results may suggest a dysregulation in ghrelin reflective of demands of growth.
Keywords: Ghrelin, hunger, African American, puberty, estradiol
INTRODUCTION
Ghrelin is a peptide hormone produced mainly in the stomach (1). Although first recognized as a secretagogue of growth hormone (2), it is now well-established that ghrelin binding to receptors in the hypothalamus also stimulates hunger and food intake (3). Recent evidence suggests that susceptibility for obesity and weight loss recidivism may relate to inappropriate regulation of gut hormones such as ghrelin (4), and ghrelin’s orexigenic properties have sparked interest in potential diet and pharmaceutical interventions that would counteract its effects on appetite (5). However, for such interventions to be efficacious, it is important to first identify factors that affect ghrelin secretion and to discern whether ghrelin regulation may differ among different populations.
To date, ghrelin has been best characterized among European American adults. However, limited evidence suggests that circulating ghrelin levels may be higher in European Americans compared to individuals of other ethnicities (6-8), and lesser ghrelin suppression has been shown among African Americans compared to European Americans (9, 10). It is plausible that ethnic differences in circulating ghrelin relate to differences in other hormones. For instance, insulin (11, 12) and estradiol (13, 14) have been reported to decrease circulating ghrelin, and prior studies have reported higher blood concentrations of both insulin (15, 16) and estradiol (17) among African American vs European American females, independent of body weight.
Given inverse associations between ghrelin and estradiol, it seems likely that circulating ghrelin would decrease after females reach reproductive maturation; however, there is a gap in the research evaluating changes in ghrelin with age. One study among boys and girls (ages 5-18 years) in the United Kingdom reported that ghrelin was inversely associated with age and pubertal stage (18). Another comparison of Italian children (ages 8.5 + 1.3 years) to adults showed similar fasting ghrelin in both groups, but children had higher ghrelin levels following a standard meal (19). In light of the influence of estradiol on ghrelin, such analyses of males and females together may not adequately identify factors underlying ghrelin secretion. To our knowledge, no studies have investigated changes in ghrelin among African American females from peri-puberty through child-bearing age. Considering their greater insulin and estradiol concentrations, investigation among African American females in particular may provide novel insight into hormonal regulation of ghrelin.
The primary aims of this study were to compare fasting ghrelin and ghrelin response to a standard meal among overweight African American girls and premenopausal women. Secondary aims were to: 1) determine whether circulating ghrelin would relate to insulin and estradiol, and 2) compare ghrelin concentrations to ratings of subjective hunger. We hypothesized that levels of ghrelin and hunger would be highest among peri-pubertal girls, corresponding to lower levels of estradiol and insulin.
METHODS
Participants
This cross-sectional investigation was ancillary to 25-week weight loss interventions among African American girls and adults, and involved only the baseline data (before the intervention). Participants were 28 overweight girls and 18 overweight premenopausal women. By self-report, all participants were African American. Pubertal status of children was classified by a pediatrician using the criteria of Marshall and Tanner (20), and girls were categorized as peri-pubertal (Tanner stages II-IV) or pubertal (Tanner stage V).
Inclusion criteria for adults required body mass index (BMI) >25 kg/m2, stable weight over the previous 6 months within + 2.3 kg. Exclusion criteria included diabetes or any other medical condition or medication known to affect body composition or glucose metabolism (including contraceptives, cholesterol medications, or blood pressure medications). Inclusion and exclusion criteria were similar for girls, with the exception that BMI percentile was used to determine weight status. All girls were overweight defined by > 85th age-specific BMI percentile. Details about menstrual cycles of pubertal girls and adults were obtained during phone screens to ensure participants had regular menstrual cycles, and testing was performed during the follicular phase of the menstrual cycle.
Verbal and written consent was obtained from each adult participant. Assent was obtained from children with parents providing consent. The study was approved by the Institutional Review Board for Human Use at the University of Alabama at Birmingham (UAB).
Protocol
Participants were provided with all food for a standard diet (55% carbohydrate, 18% protein, 27% fat) for 3 days prior to testing. Energy needs were calculated by the General Clinical Research Center (GCRC) Bionutrition Unit using the Harris Benedict formula (21) with activity factors of 1.30 - 1.35. Following a 12-hour overnight fast, each participant completed a liquid meal test. Fasting blood samples were obtained to determine concentrations of total ghrelin, insulin, glucose, and estradiol. Participants then consumed a standard liquid meal (Carnation Instant Breakfast and whole milk; 7 kcal/kg or 1.75 g carbohydrate/kg lean mass; 58.6% carbohydrate, 17.4% protein, 24% fat) within a 5-minute period, and blood was sampled at minutes 15, 60, 90, 120, 180, and 240 for serum ghrelin, insulin, and glucose. At each time point, participants were asked to mark visual analog scales (VAS) to assess subjective hunger, fullness, quantity they could eat, and desire to eat. Each VAS was presented as a 100mm line anchored between two extreme statements. Continuous variables for VAS measures were obtained by measuring the distance in mm to the mark (22).
Weight was measured by an electronic scale, and height was measured to the nearest centimeter with a wall-mounted stadiometer. Percent body fat (%Fat) was quantified by dual-energy X-ray absorptiometry (Lunar iDXA; GE Healthcare, Madison, WI; software version 12.3).
Assays
All analyses were performed in the Core Laboratories of UAB’s GCRC, Nutrition Obesity Research Center (NORC), and Diabetes Research Training Center (DRTC). Serum total ghrelin was measured in duplicate 20 μl aliquots by enzyme-linked immunoabsorbent assay (ELISA; Millipore Corporation; Billerica, MA). Serum samples were pretreated with DDP-IV protease inhibitor (Millipore Corporation; Billerica, MA) and Pefabloc protease inhibitor (Roche Diagnostics; Mannheim, Germany). Mean intra-assay coefficient of variation (CV) was 7.10%, and mean interassay CV was 5.98% for this assay. Insulin was measured in 50 μl aliquots by immunofluorescence (TOSOH AIA-600II analyzer; TOSOH Corporation; South San Francisco, CA). Mean intra-assay CV was 1.49%, and interassay CV was 4.42%. Fasting glucose was measured in 3 μL sera by a glucose oxidase method (Stanbio Sirrus analyzer; Stanbio Laboratory, Boerne, TX). Mean intra-assay CV was 1.21%, and mean interassay CV was 3.065%. Fasting estradiol was measured in 75 μl aliquots by immunofluorescence (TOSOH AIA-II analyzer; TOSOH Corporation; South San Francisco, CA). This assay has a sensitivity of 25 pg/ml and an inter-assay CV of 12.89%.
Statistical Analysis
Continuous variables were log transformed for normality as appropriate (weight, insulin, and glucose). Incremental area under the curve (AUC) was calculated by the trapezoidal method (23) for ghrelin, insulin, glucose, and each VAS score. Absolute ghrelin suppression was calculated as the difference from fasting concentration at each time point. Nonparametric Kruskal Wallis and Mann-Whitney U tests were used to compare estradiol between age groups due to non-normal distribution despite log transformation. Analysis of variance (ANOVA) with Bonferroni adjustment was used to identify differences between age groups for other variables and all AUC composites. Differences in ghrelin, insulin, and glucose over the course of the meal test and between groups were also determined by repeated-measures ANOVA with Bonferroni corrections. Spearman correlation coefficients were calculated to evaluate relationships between fasting estradiol, ghrelin, insulin, and glucose. Pearson correlation analyses were used to examine associations between AUC composites. Statistical tests were performed with SPSS software (version 19.0; Chicago, IL) and GraphPad Prism (version 5.0; La Jolla, CA). All tests were two-sided with a Type I error rate of 0.05.
RESULTS
Participant characteristics and fasting hormone levels are displayed by age group as mean + SD in Table 1. Peri-pubertal girls weighed less than the others, but BMI z-scores and % body fat were similar between the 3 groups. Estradiol was significantly lower among peri-pubertal girls compared to pubertal girls (p<0.001) and women (p=0.001).
Table 1.
Participant characteristics (mean ± SD)
| Peri-pubertal Girls (Tanner II-IV) (n=11) |
Pubertal Girls (Tanner V) (n=17) |
Adults (n=18) |
P-value* | |
|---|---|---|---|---|
| Age (y) | 10.7 ± 0.5a | 13.3 ± 0.3a | 34.1 ± 2.1b | <0.001 |
| Weight (kg) | 71.2 ± 3.8a | 96.9 ± 6.0b | 90.7 ± 3.9b | 0.002 |
| BMI z-score | −0.3 ± 0.2 | 0.4 ± 0.3 | −0.3 ± 0.2 | 0.079 |
| Percent Fat (%) | 44.6 ± 2.0 | 44.1 ± 1.3 | 45.0 ± 1.1 | 0.893 |
| Estradiol (pg/ml) | 32.1 ± 3.6a | 84.1 ± 11.5b | 65.6 ± 8.4b | 0.001 |
| Fasting insulin (μU/ml) | 12.6 ± 1.5a,b | 15.5 ± 2.0b | 9.6 ± 1.8a | 0.014 |
| Fasting glucose (mg/dl) | 94.0 ± 2.2 | 97.0 ± 2.0 | 95.0 ± 2.2 | 0.616 |
| Fasting ghrelin (pg/ml) | 741.7 ± 81.6 | 588.5 ± 66.4 | 573.4 ± 53.0 | 0.197 |
BMI = body mass index
p-value for main effect of age group;
significant group differences at p<0.05
significant group differences at p<0.05
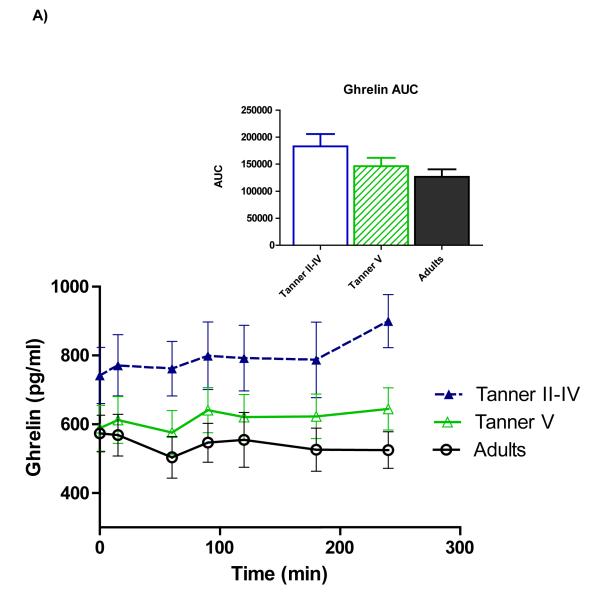
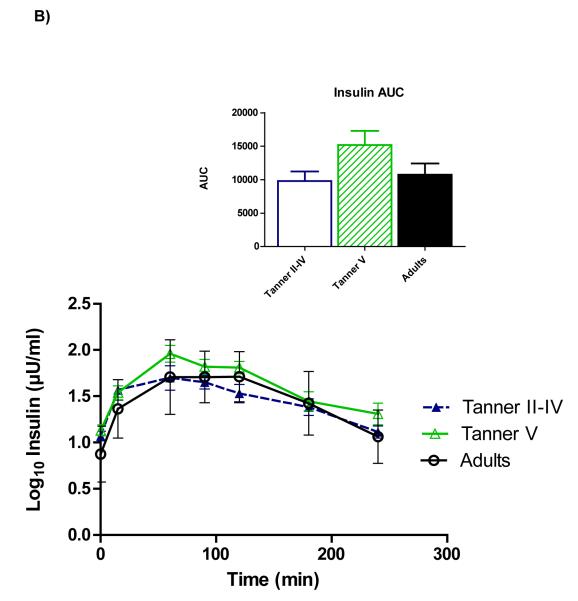
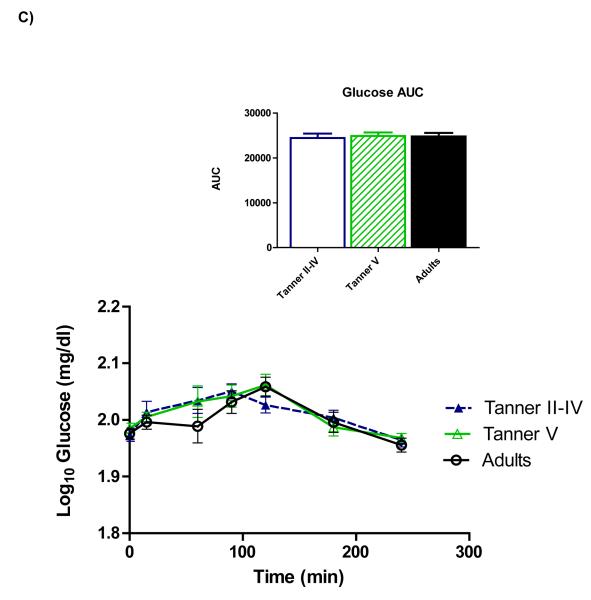
Figure 1 shows time courses of serum ghrelin, insulin, and glucose. Repeated-measures ANOVA showed a main effect of age on ghrelin (p=0.028), and pairwise comparisons revealed that the age group difference reflected higher ghrelin among peri-pubertal girls compared to adults (p=0.027)(panel A). Total AUC also tended to be higher among peri-pubertal girls vs. adults (p=0.082). Upon completion of the test (hour 4), ghrelin in adults remained lower than fasting concentrations (p=0.026), whereas ghrelin in pubertal girls wasn’t different from fasting levels, and 4-hour ghrelin tended to be higher than fasting among pre-pubertal girls (p=0.056).
Figure 1.
Time courses and areas under the curve (AUC) for serum total ghrelin (A), insulin (B), and glucose (C). Repeated-measures ANOVA revealed higher ghrelin among peri-pubertal girls compared to adults (p=0.027 for main effect of age). A trend for higher ghrelin AUC among peri-pubertal girls compared to adults was also observed (p=082). Postprandial insulin and glucose did not differ between groups.
A significant effect of time was observed for insulin (panel B), indicating a change in insulin from fasting levels over the duration of the meal test. Although pubertal girls had higher fasting insulin than adults (p=0.015), no main effect of age group across the meal test was identified, nor did total insulin AUC differ between age groups. No differences for serum glucose (Panel C) nor any time*group interactions were observed.
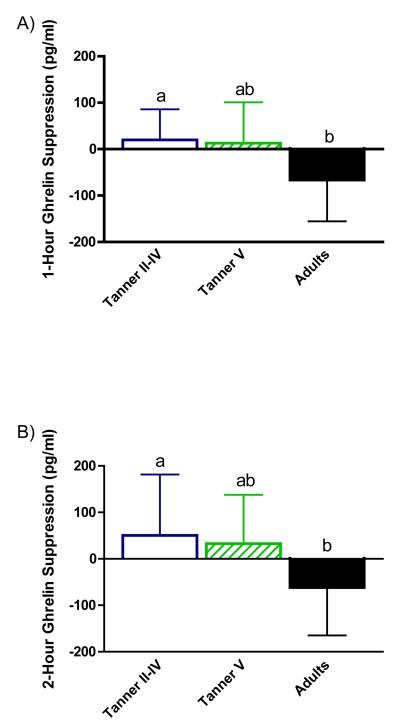
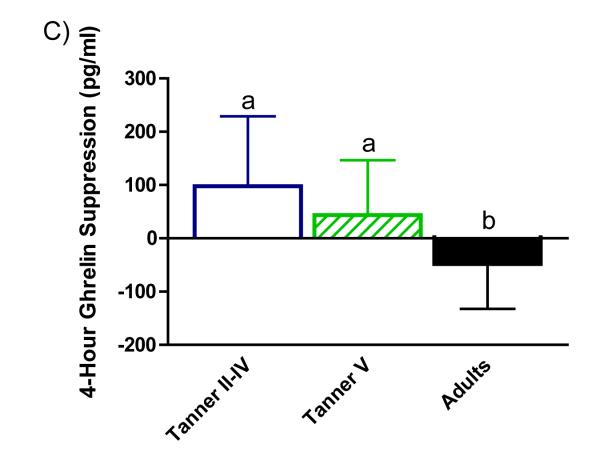
Absolute ghrelin suppression by age group at 1 hour (panel A), 2 hours (panel B), and 4 hours (panel C) after the test meal is illustrated in Figure 2. Suppression was greater among adults relative to peri-pubertal girls at 1, 2, and 4 hours (p=0.003, p=0.037, and p=0.003, respectively) and pubertal girls at hour 4 (p=0.037).
Figure 2.
Absolute ghrelin suppression (calculated as change from fasting concentration at each time point). Women showed greater ghrelin suppression than peri-pubertal girls at hour 1(panel A) and hour 2 (panel B). Suppression in women was greater than peri-pubertal and pubertal girls at 4 hours (panel C); mean ± SEM; a,bp<0.05.
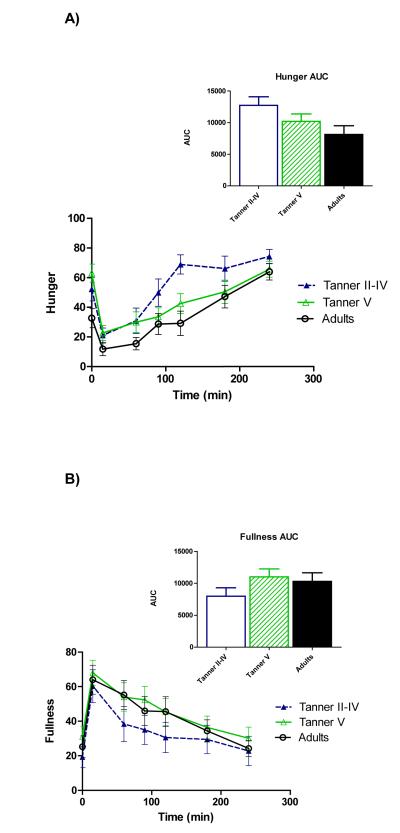
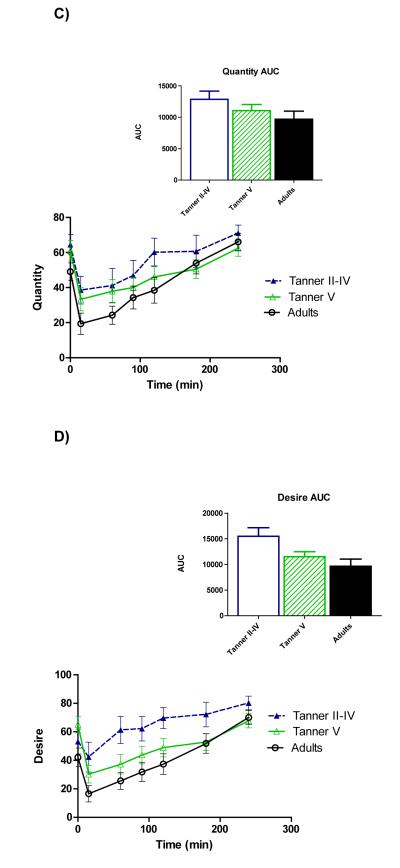
Figure 3 illustrates time course profiles for subjective hunger (panel A), fullness (panel B), quantity of food that could be consumed (Panel C), and desire to eat (panel D). Comparisons of AUC demonstrated a trend for greater hunger (p=0.073) as well as greater desire to eat (p=0.017) among peri-pubertal girls compared to adults.
Figure 3.
Time courses and areas under the curve (AUC) for serum total hunger (A), fullness (B), quantity of food that could be consumed (C), and desire to eat (D). AUC was higher among peri-pubertal girls vs. adults for hunger (p=0.073) and desire to eat (0.017).
Among all subjects, a trend was observed for an inverse association between fasting estradiol (r=−0.264, p=0.076). Ghrelin AUC was positively correlated with hunger (r=0.369, p=0.012), quantity of food that could be consumed (r=0.409, p=0.005), and desire to eat (r=0.469, p=0.001).
DISCUSSION
Most studies examining factors that influence circulating ghrelin have involved adults of European descent; however, recent evidence suggests that ghrelin may be regulated differently among those of different ethnicities, with European Americans exhibiting greater fasting levels (6-8) and greater postprandial suppression than other ethnic groups (9, 10). Little is known about whether stage in the life course influences fasting or postprandial ghrelin secretion. Because ghrelin regulation may relate to propensity for obesity and weight regain (4), this study was designed to characterize age group differences in total serum ghrelin among a cohort of African American females, an understudied group with a high rate of obesity (24, 25). The primary finding of this analysis was higher postprandial ghrelin among peri-pubertal girls compared to adult women. Moreover, the typical postprandial decline in ghrelin (26), was observed among adults but not among the girls. For all participants, ghrelin response to the standard meal was positively correlated with subjective measures of hunger. In addition, higher ghrelin levels in the peri-pubertal girls corresponded to reports of greater hunger and desire to eat by that group as well. Physiologic differences in ghrelin across the life course may have tremendous implications for establishment of satiety response.
Reasons for higher ghrelin and greater hunger in peri-pubertal girls are not clear, but may be due in part to their lower estradiol. Within our cohort, ghrelin tended to be inversely correlated with estradiol. Ghrelin levels also appeared to decrease across the pubertal transition into adulthood, and ghrelin concentrations among the pubertal girls with higher estradiol were not significantly different than adults. In a prior study of ovariectomized rats, administration of estradiol decreased synthesis and secretion of ghrelin in the rat stomach (14). Although this represented a supraphysiological dose, it is akin to the influx of estradiol characteristic of puberty. In addition, estradiol administration is known to inhibit food intake in rats and mice, and ovariectomized animals typically exhibit hyperphagia (27, 28). Analogous studies in humans are limited, and results are equivocal with evidence for both decreased (13) and increased (29) circulating ghrelin in response to estradiol therapy. To our knowledge, the relationship between ghrelin and physiologic exposure to increased estradiol at puberty has not previously been investigated. Thus, although our data and that of animal studies suggest that higher ghrelin levels among peri-pubertal girls may relate to lower circulating estradiol, additional studies are needed to further explore this hypothesis.
Although previous studies have not found ghrelin to be associated with linear growth (18, 30), is plausible that higher ghrelin levels among the girls before puberty reflect a normal response to the demands of growth at that age. In addition to its action as an orexigen, ghrelin stimulates growth hormone secretion (31), and growth hormone is known to be a crucial regulator of somatic growth and growth velocity in children (32).
In light of reported inverse associations between insulin and ghrelin (11, 12, 33), we also examined the possibility that differences in insulin contributed to differences in ghrelin between age groups. However, postprandial insulin didn’t differ with age, and inverse associations between ghrelin and insulin among this cohort did not reach significance. Although our data do not support a role for insulin in mediating higher ghrelin in peri-pubertal girls vs women, further study could be advantageous. Taking into account known transient insulin resistance associated with puberty (32), it is possible that dynamics of the insulin cycle confounded results.
Strengths of this study included careful control of food intake for 3 days prior to the meal test and robust measures of body composition to ensure that the groups were similar except for age. The study was limited by cross-sectional design, modest sample size, and inclusion of only overweight/obese participants of African American ethnicity. This study was a first step in characterizing ghrelin among age and ethnic groups. Logical next steps would include comparisons of females of other ethnicities and across different body habitus, with further exploration of different dietary habits between groups.
In conclusion, we identified higher postprandial serum ghrelin, a potent orexigen, among peri-pubertal African American girls compared to adult African American women. Understanding underlying determinants of food intake among African American females is important and clinically relevant as African American girls (25) and women (24) have higher rates of obesity than other groups. This disparity becomes apparent before puberty (25), and obesity established in childhood tends to persist into adulthood (34). Higher ghrelin levels among peri-pubertal girls corresponded to greater appetite. Further study is warranted to determine whether higher ghrelin observed among these girls represents a dysregulated satiety response or a physiologically appropriate condition of active growth. If higher ghrelin in peri-pubertal girls influence patterns of food intake that affect long-term body composition trajectories, then future diet interventions to offset the orexigenic effects of ghrelin by improving satiety may be one strategy to counteract metabolic programming of obesity into adulthood.
ACKNOWLEDGEMENTS
The authors are grateful to Michelle Cardel and Laura Lee Goree for study coordination, Maryellen Williams and Cindy Zeng for laboratory analyses, Suzanne Choquette for menu development, and Betty Darnell for management of the GCRC Bionutrition Unit.
SOURCES OF SUPPORT This work was supported by R01DK67538, M01RR00032 (GCRC), UL1RR025777 (CTSA), P30-DK56336 (NORC), P60DK079626 (DRTC), DK99-083333, Thrasher Research Fund, and The University of Alabama at Birmingham’s Women’s Center for Reproductive Health.
Footnotes
This study is registered on www.clinicaltrials.gov (ClinicalTrials.gov ID: NCT00726908)
REFERENCES
- 1.Ueno H, Shiiya T, Nakazato M. Translational research of ghrelin. Ann N Y Acad Sci. 2010;1200:120–7. doi: 10.1111/j.1749-6632.2010.05509.x. [DOI] [PubMed] [Google Scholar]
- 2.Cordido F, Isidro M, Nemiña R, Sangiao-Alvarellos S. Ghrelin and growth hormone secretagogues, physiological and pharmacological aspect. Curr Drug Discov Technol. 2009;6(1):34–42. doi: 10.2174/157016309787581048. [DOI] [PubMed] [Google Scholar]
- 3.De Vriese C, Perret J, Delporte C. Focus on the short- and long-term effects of ghrelin on energy homeostasis. Nutrition. 2010;26(6):579–84. doi: 10.1016/j.nut.2009.09.013. [DOI] [PubMed] [Google Scholar]
- 4.Sumithran P, Prendergast LA, Delbridge E, Purcell K, Shulkes A, Kriketos A, et al. Long-term persistence of hormonal adaptations to weight loss. N Engl J Med. 2011;365(17):1597–604. doi: 10.1056/NEJMoa1105816. [DOI] [PubMed] [Google Scholar]
- 5.Patterson M, Bloom SR, Gardiner JV. Ghrelin and appetite control in humans-Potential application in the treatment of obesity. Peptides. 2011;11:2290–4. doi: 10.1016/j.peptides.2011.07.021. [DOI] [PubMed] [Google Scholar]
- 6.Matsunaga-Irie S, Ueshima H, Zaky WR, Kadowaki T, Evans RW, Okamura T, et al. Serum ghrelin levels are higher in Caucasian men than Japanese men aged 40-49 years. Diabetes Obes Metab. 2007;9(4):591–3. doi: 10.1111/j.1463-1326.2006.00627.x. [DOI] [PMC free article] [PubMed] [Google Scholar]
- 7.Salbe A, Tschöp M, DelParigi A, Venti C, Tataranni P. Negative relationship between fasting plasma ghrelin concentrations and ad libitum food intake. J Clin Endocrinol Metab. 2004;89(6):2951–6. doi: 10.1210/jc.2003-032145. [DOI] [PubMed] [Google Scholar]
- 8.Tschöp M, Weyer C, Tataranni PA, Devanarayan V, Ravussin E, Heiman ML. Circulating ghrelin levels are decreased in human obesity. Diabetes. 2001;50(4):707–9. doi: 10.2337/diabetes.50.4.707. [DOI] [PubMed] [Google Scholar]
- 9.Bacha F, Arslanian S. Ghrelin and peptide YY in youth: are there race-related differences? J Clin Endocrinol Metab. 2006;91(8):3117–22. doi: 10.1210/jc.2005-2448. [DOI] [PubMed] [Google Scholar]
- 10.Brownley K, Light K, Grewen K, Bragdon E, Hinderliter A, West S. Postprandial ghrelin is elevated in black compared with white women. J Clin Endocrinol Metab. 2004;89(9):4457–63. doi: 10.1210/jc.2004-0607. [DOI] [PubMed] [Google Scholar]
- 11.Möhlig M, Spranger J, Otto B, Ristow M, Tschöp M, Pfeiffer AF. Euglycemic hyperinsulinemia, but not lipid infusion, decreases circulating ghrelin levels in humans. J Endocrinol Invest. 2002;25(11):RC36–8. doi: 10.1007/BF03344062. [DOI] [PubMed] [Google Scholar]
- 12.Saad MF, Bernaba B, Hwu CM, Jinagouda S, Fahmi S, Kogosov E, et al. Insulin regulates plasma ghrelin concentration. J Clin Endocrinol Metab. 2002;87(8):3997–4000. doi: 10.1210/jcem.87.8.8879. [DOI] [PubMed] [Google Scholar]
- 13.Chu MC, Cosper P, Nakhuda GS, Lobo RA. A comparison of oral and transdermal short-term estrogen therapy in postmenopausal women with metabolic syndrome. Fertil Steril. 2006;86(6):1669–75. doi: 10.1016/j.fertnstert.2006.04.043. [DOI] [PubMed] [Google Scholar]
- 14.Matsubara M, Sakata I, Wada R, Yamazaki M, Inoue K, Sakai T. Estrogen modulates ghrelin expression in the female rat stomach. Peptides. 2004;25(2):289–97. doi: 10.1016/j.peptides.2003.12.020. [DOI] [PubMed] [Google Scholar]
- 15.Frazier B, Hsiao CW, Deuster P, Poth M. African Americans and Caucasian Americans: differences in glucocorticoid-induced insulin resistance. Horm Metab Res. 2010;42(12):887–91. doi: 10.1055/s-0030-1265131. [DOI] [PubMed] [Google Scholar]
- 16.Albu J, Kovera A, Allen L, Wainwright M, Berk E, Raja-Khan N, et al. Independent association of insulin resistance with larger amounts of intermuscular adipose tissue and a greater acute insulin response to glucose in African American than in white nondiabetic women. Am J Clin Nutr. 2005;82(6):1210–7. doi: 10.1093/ajcn/82.6.1210. [DOI] [PMC free article] [PubMed] [Google Scholar]
- 17.Casazza K, Goran M, Gower B. Associations among insulin, estrogen, and fat mass gain over the pubertal transition in African-American and European-American girls. J Clin Endocrinol Metab. 2008;93(7):2610–5. doi: 10.1210/jc.2007-2776. [DOI] [PMC free article] [PubMed] [Google Scholar]
- 18.Whatmore AJ, Hall CM, Jones J, Westwood M, Clayton PE. Ghrelin concentrations in healthy children and adolescents. Clin Endocrinol (Oxf) 2003;59(5):649–54. doi: 10.1046/j.1365-2265.2003.01903.x. [DOI] [PubMed] [Google Scholar]
- 19.Bellone S, Castellino N, Broglio F, Rapa A, Vivenza D, Radetti G, et al. Ghrelin secretion in childhood is refractory to the inhibitory effect of feeding. J Clin Endocrinol Metab. 2004;89(4):1662–5. doi: 10.1210/jc.2003-031207. [DOI] [PubMed] [Google Scholar]
- 20.Marshall W, Tanner J. Variations in pattern of pubertal changes in girls. Arch Dis Child. 1969;44(235):291–303. doi: 10.1136/adc.44.235.291. [DOI] [PMC free article] [PubMed] [Google Scholar]
- 21.Harris J, Benedict F. A Biometric Study of Human Basal Metabolism. Proc Natl Acad Sci U S A. 1918;4(12):370–3. doi: 10.1073/pnas.4.12.370. [DOI] [PMC free article] [PubMed] [Google Scholar]
- 22.Flint A, Raben A, Blundell JE, Astrup A. Reproducibility, power and validity of visual analogue scales in assessment of appetite sensations in single test meal studies. Int J Obes Relat Metab Disord. 2000;24(1):38–48. doi: 10.1038/sj.ijo.0801083. [DOI] [PubMed] [Google Scholar]
- 23.Matthews JN, Altman DG, Campbell MJ, Royston P. Analysis of serial measurements in medical research. BMJ. 1990;300(6719):230–5. doi: 10.1136/bmj.300.6719.230. [DOI] [PMC free article] [PubMed] [Google Scholar]
- 24.Flegal KM, Carroll MD, Ogden CL, Curtin LR. Prevalence and trends in obesity among US adults, 1999-2008. JAMA. 2010;303(3):235–41. doi: 10.1001/jama.2009.2014. [DOI] [PubMed] [Google Scholar]
- 25.Ogden CL, Carroll MD, Curtin LR, Lamb MM, Flegal KM. Prevalence of high body mass index in US children and adolescents, 2007-2008. JAMA. 2010;303(3):242–9. doi: 10.1001/jama.2009.2012. [DOI] [PubMed] [Google Scholar]
- 26.Cummings D, Purnell J, Frayo R, Schmidova K, Wisse B, Weigle D. A preprandial rise in plasma ghrelin levels suggests a role in meal initiation in humans. Diabetes. 2001;50(8):1714–9. doi: 10.2337/diabetes.50.8.1714. [DOI] [PubMed] [Google Scholar]
- 27.Brown LM, Clegg DJ. Central effects of estradiol in the regulation of food intake, body weight, and adiposity. J Steroid Biochem Mol Biol. 2010;122(1-3):65–73. doi: 10.1016/j.jsbmb.2009.12.005. [DOI] [PMC free article] [PubMed] [Google Scholar]
- 28.Butera PC. Estradiol and the control of food intake. Physiol Behav. 2010;99(2):175–80. doi: 10.1016/j.physbeh.2009.06.010. [DOI] [PMC free article] [PubMed] [Google Scholar]
- 29.Kellokoski E, Pöykkö SM, Karjalainen AH, Ukkola O, Heikkinen J, Kesäniemi YA, et al. Estrogen replacement therapy increases plasma ghrelin levels. J Clin Endocrinol Metab. 2005;90(5):2954–63. doi: 10.1210/jc.2004-2016. [DOI] [PubMed] [Google Scholar]
- 30.Camurdan MO, Bideci A, Demirel F, Cinaz P. Serum ghrelin, IGF-I and IGFBP-3 levels in children with normal variant short stature. Endocr J. 2006;53(4):479–84. doi: 10.1507/endocrj.k05-167. [DOI] [PubMed] [Google Scholar]
- 31.Kojima M, Kangawa K. Ghrelin: more than endogenous growth hormone secretagogue. Ann N Y Acad Sci. 2010;1200:140–8. doi: 10.1111/j.1749-6632.2010.05516.x. [DOI] [PubMed] [Google Scholar]
- 32.Casazza K, Hanks LJ, Alvarez JA. Role of various cytokines and growth factors in pubertal development. Med Sport Sci. 2010;55:14–31. doi: 10.1159/000321969. [DOI] [PubMed] [Google Scholar]
- 33.Flanagan DE, Evans ML, Monsod TP, Rife F, Heptulla RA, Tamborlane WV, et al. The influence of insulin on circulating ghrelin. Am J Physiol Endocrinol Metab. 2003;284(2):E313–6. doi: 10.1152/ajpendo.00569.2001. [DOI] [PubMed] [Google Scholar]
- 34.Freedman DS, Khan LK, Serdula MK, Dietz WH, Srinivasan SR, Berenson GS. The relation of childhood BMI to adult adiposity: the Bogalusa Heart Study. Pediatrics. 2005;115(1):22–7. doi: 10.1542/peds.2004-0220. [DOI] [PubMed] [Google Scholar]


