Abstract
Recent studies show a limited capacity for neural repair after stroke, which includes remapping of sensorimotor functions and sprouting of new connections. However, physiologic and connectional plasticity of sensory maps during long-term functional recovery in the mouse have not been determined. Using a photothrombotic stroke model, we targeted the motor cortex, which we show results in lasting behavioral deficits on the grid-walking and in the cylinder tasks out to 8 weeks after stroke. Mice recovered performance in a skilled reaching task, showing no deficit from week 2 after stroke. Long-term optical intrinsic signal imaging revealed functional reorganization of sensory cortical maps for both forelimb and hindlimb, with more diffuse sensory physiologic maps. There was a small but significant increase in motor neuron projections within the areas of functional cortical reorganization as assessed using the neuroanatomic tracer biotinylated dextran amine. These findings show that the sensorimotor cortex undergoes remapping of cortical functions and axonal sprouting within the same regions during recovery after stroke. This suggests a linked structural and physiologic plasticity underlying recovery. Combined long-term structural and functional mapping after stroke in the mouse is practical and provides a rich data set for mechanistic analysis of stroke recovery.
Keywords: behavior, optical imaging, sprouting, stroke recovery, stroke repair
Introduction
Stroke is the leading cause of adult disability. Studies in stroke patients have identified a remapping of sensory–motor functions in peri-infarct and connected cortical areas that are associated with functional recovery. Sensorimotor stimulation during motor recovery after stroke is associated with the activation of functional cortical networks that expand to include premotor and prefrontal areas—a process not seen in normal subjects.1 Sensorimotor stimulation also activates ectopic sites in the peri-infarct cortex adjacent to the stroke in recovering stroke patients. In parallel with these studies, treatments that enhance motor recovery after stroke, such as constraint-induced therapies, produce a distinct remapping of the sensorimotor function in the peri-infarct cortex.2 These data in the human suggest that stroke induces a process of neuroplasticity in the peri-infarct cortex that leads to changes in motor and sensory maps and recovery of function.3
Animal studies indicate that remapping of the sensorimotor function in the peri-infarct cortex after stroke may be associated with the formation of new connections. In primates, motor cortex lesions induce long-distance axonal sprouting.4 Small strokes in the forelimb somatosensory cortex induce an expanded and ectopic mapping of forelimb sensory representation in adjacent cortical areas, associated with axonal sprouting from distant retrosplenial cortex.5 Similarly, small somatosensory cortex strokes induce axonal sprouting in neighboring areas in rodents.6, 7 These data show that axonal sprouting accompanies the physiologic process of motor and sensory remapping. Importantly, peri-infarct cortex is the critical locus for motor recovery in the photothrombotic stroke model.8 Here we set about to determine directly the process of cortical map plasticity and axonal sprouting specifically within the recovering motor cortex of the same animals, so as to determine cellular events that may underlie recovery. We supplemented conventional behavioral and histologic techniques with a novel combination of quantitative connectional mapping and optical intrinsic signaling (OIS) imaging to provide measures of both structural and functional remapping after stroke.
Materials and Methods
Animals
Male C57BL/6 mice (28 to 32 g) were housed under a 12-hour light/dark cycle with ad libitum access to food and water. All procedures described in this study were performed in accordance with guidelines on the care and use of laboratory animals set out by the University of California, Los Angeles Animal Research Committee and the Guide for Care and Use of Laboratory Animals (NIH Publication No. 85-23, 1996). All procedures were approved by the University of California, Los Angeles Animal Research Committee before commencing any of the studies.
Photothrombosis
Focal stroke was induced by photothrombosis.8, 9 Stroke was induced in 2- to 4-month-old anesthetized C57BL/6 male mice by illuminating the brain through the intact skull with a cold-light source for either 15 or 18 minutes in separate cohorts.
Behavioral Assessment
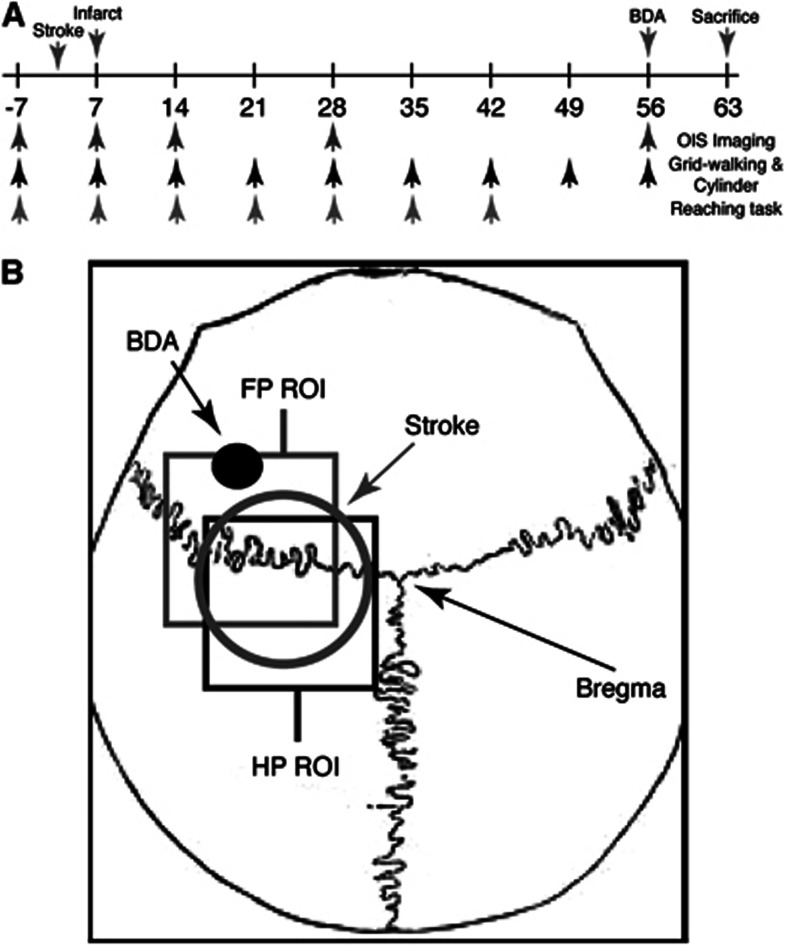
Animals (10 per group) were tested once on both the grid-walking and cylinder tasks 1 week before surgery to establish baseline performance levels. For the reaching task, mice were trained for a period of 14 days and subsequently tested on day 15 to establish a baseline reading. For all of the studies, animals were tested weekly for 8 weeks after stroke at approximately the same time (Figure 1). Assessment on both the grid-walking and cylinder tasks were performed as described previously.8, 9 To assess fine motor control associated with grasping, the single pellet skilled reaching task was used.8 All behaviors were scored by observers who were masked to the treatment group of the animals.8, 9
Figure 1.
Schematic of experimental procedures. Schematic showing the timeline of experimental procedures (A). Schematic image showing location of stroke (circle), biotinylated dextran amine (BDA) injection (black dot), and regions where forepaw (FP) and hindpaw (HP) optical intrinsic signaling (OIS) images were taken, relative to bregma (B). ROI, region of interest.
Biotinylated Dextran Amine Injection and Infarct Size
At 8 weeks after stroke, animals underwent microinjection of the forelimb motor cortex just anterior to the stroke (0.5 mm anterior, 1.75 mm lateral, 0.75 mm ventral to bregma; Figure 1)8, 10 with the neuroanatomic tracer biotinylated dextran amine (BDA) (10%, 300 nL).
For histologic assessment of infarct size, brains were processed 7 days after stroke using cresyl violet.8, 9 Four animals per group were used for histologic assessments.
Optical Intrinsic Signaling Imaging
Mice (5 per group) were imaged 7 days before and then 7, 14, 28, and 56 days after 15-minute stroke (Figure 1A). Mice were anesthetized with enflurane and temperature maintained at 37°C. Images were obtained through the intact skull under red light using a cooled 16-bit CCD camera (PhotonMax 512-B; Roper Scientific, Trenton, NJ, USA) connected to a tandem lens (Cosmicar Pentax 25 mm f/0.95, mounted front-to-front; field of view: 6.6 mm; pixel size: 0.016 mm). The cortical surface vessels of the left hemisphere and bony landmarks (bregma and lambda) served as anatomic references. Images were acquired at 2 Hz with a 400 ms exposure time using two red-orange LED lights (Lumiled Luxeon, 617 nm; full-width at half-maximum 18 nm). The lights were positioned in each experiment to achieve an even illumination over the whole field, at approximately 60% of the camera's dynamic range.
To generate functional maps, electrical stimulation (50 Hz, 0.001 seconds pulse width, 0.14 to 0.22 mA) was generated by a pulse stimulator (Master 8, A.M.P.I., Jerusalem, Israel), connected to a stimulus isolator (Iso-Flex, A.M.P.I., Jerusalem, Israel), and delivered to the tissue through a pair of subdermal needle electrodes (27 GA; Rochester Electro-Medical, Tampa, FL, USA), which were inserted 2 mm apart under the proximal and distal walking pads of either the right forepaw (FP) and hindpaw (HP).11 A 1-second stimulation was delivered 5 seconds after the start of each trial and the total duration of one trial was 25 seconds.
For image analysis, a square region of interest of 2.00 mm was centered 1.75 mm lateral and 0.48 mm posterior to bregma for HP, and 2.12 mm lateral and 0.04 mm anterior to bregma for FP (Figure 1B), based on expected FP and HP cortex locations.12 Trials were normalized to baseline, averaged, and processed with a Gaussian filter (half-width, 3 pixels) to remove high-frequency noise. Maps were generated by thresholding at 50% of the maximal response. All the significant pixels in the region of interest were summed and then converted to millimeter2 to obtain the activated area, which was normalized to prestroke values for comparison. Image analysis was performed using either plugins or custom routines written for ImageJ (NIH, Bethesda, MD, USA).
Registration of Maps
Neuronal motor cortex projections were quantified7, 8, 10 from five animals per group. Biotinylated dextran amine-positive processes were marked in every sixth section in x/y coordinates relative to the center of the injection site by an observer who was masked to the treatment conditions. The x/y projection plots of each brain from each experimental group were registered about the injection site and coregistered with functionally relevant anatomic regions, produced by the staining of the mouse somatosensory body map in cytochrome oxidase, to generate a composite projection map for each treatment condition. Biotinylated dextran amine injection sites and OIS regions of interest are both defined as coordinates relative to bregma. Therefore, OIS functional maps and quantitative projection maps can be coregistered in equivalent coordinate space. Directionality of axonal sprouting was determined by converting the x–y coordinate of every BDA-positive process to an equivalent polar coordinate relative to the injection site as center (r, θ). The location of each process was transferred to common polar space and a mean projection vector was computed for each treatment group. The projection vector was defined by the angle of projection from the injection site (θ) and distance (length of vector, r) from the center of the injection site (forelimb motor cortex).
Statistics
All data is expressed as mean±standard error of the mean (s.e.m.). For behavioral testing, differences between treatment groups were analyzed using two-way analysis of variance with repeated measures and Newman–Keuls' multiple pairwise comparisons for post hoc comparisons. Optical intrinsic signaling data was compared using one-way analysis of variance followed by Tukey's test for post hoc comparisons. Biotinylated dextran amine projection profiles between controls and experimental groups were analyzed using Hotelling's t-test and Watson's U-test.7, 8, 10 The level of significance was set at <0.05.
Results
Stroke Volume
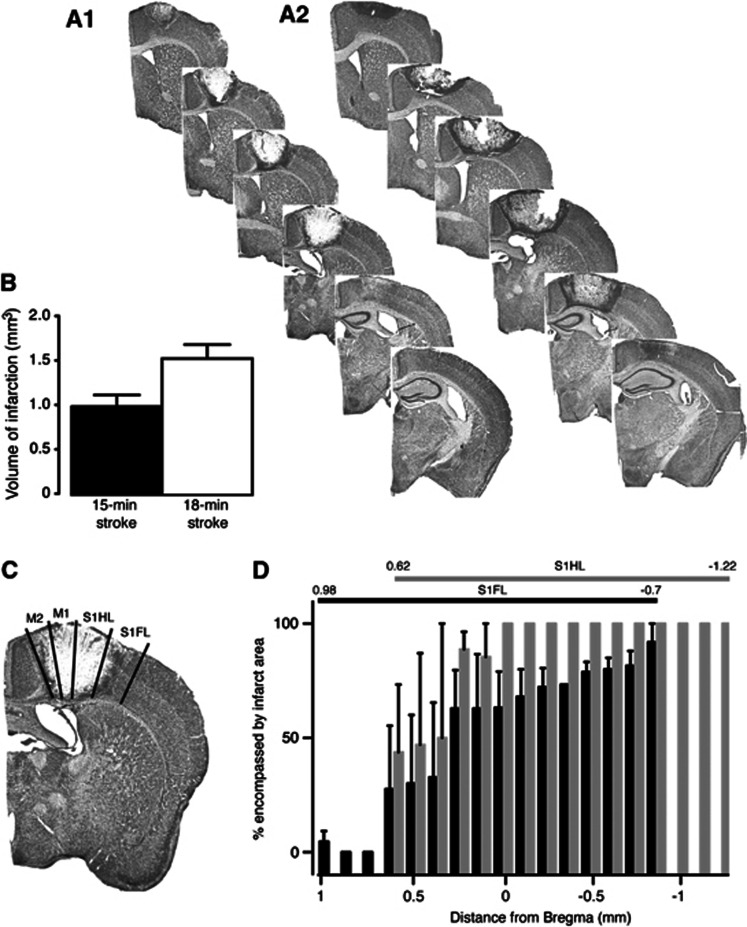
Strokes were induced in the mouse motor cortex using a cold-light source through the intact skull for either 15 or 18 minutes (Figures 2A1 and 2A2, respectively). The volume of infarction in the 18-minute group was significantly greater than the 15-minute group, with the area of damage including more of sensory forelimb and hindlimb cortical areas (15-minute stroke: 0.983±0.129 mm3 vs. 18-minute stroke: 1.514±0.155 mm3; P=0.0387, n=4 per group; Figure 2B). After a 15-minute stroke, a large percentage of both sensory forelimb and hindlimb cortical areas are damaged, with sensory hindlimb being more affected than the forelimb (Figures 2C and 2D).
Figure 2.
Histologic assessments after stroke. Representative cresyl violet-stained sections from 15- (A1) and 18-minute (A2) motor cortex-stroked animals. Lesion size quantification is shown in (B). Representative image showing primary and sensory forelimb and hindlimb areas affected by the stroke is shown in (C). The percent of sensory forelimb (black bars) and hindlimb (gray bars) affected by the stroke is shown in (D). An n=4 per group.
Stroke Induces Loss of Motor Function that is Slow to Recover
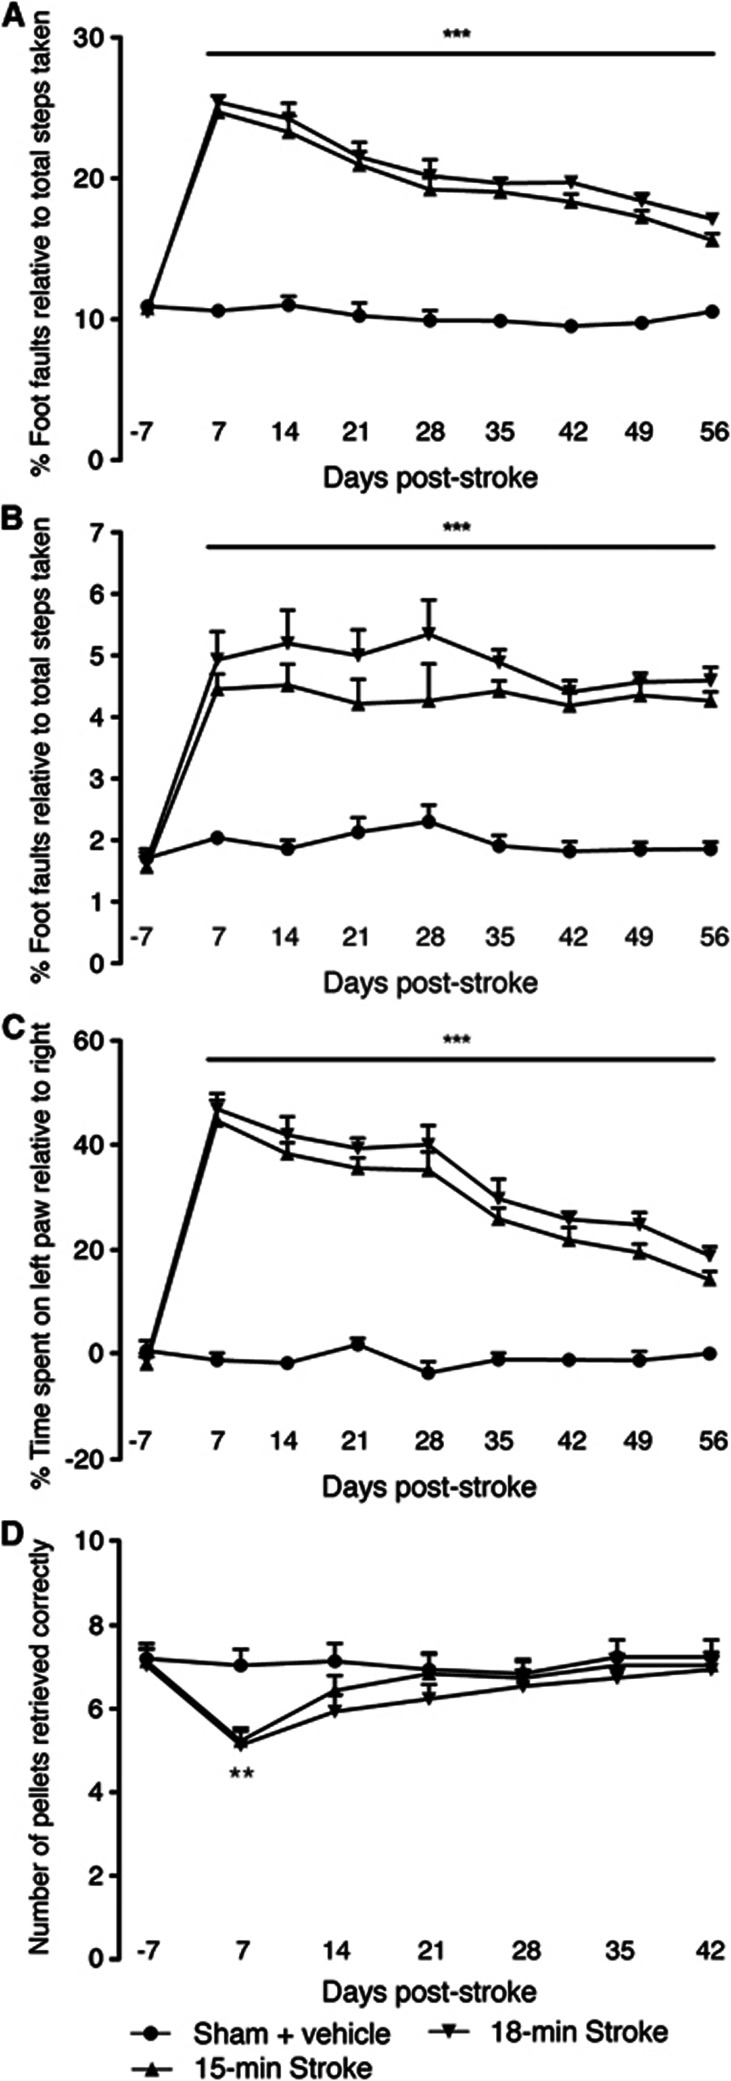
Behavioral assessment revealed an increase in the number of foot faults (both right forelimb and hindlimb) on the grid-walking test (Figures 3A and 3B) and an increase in spontaneous forelimb asymmetry (decrease in relative time spent on the right forelimbs) in the cylinder task (Figure 3C) from 1 week after stroke. Assessment over the 8-week behavioral assessment period showed a small yet significant gain of forelimb motor function in the cylinder test. However, no real gain of motor function was observed on the grid-walking task over the 8 weeks. No significant differences were observed between either the 15- or 18-minute stroke groups on either the grid-walking or cylinder tasks (n=10 per group; P>0.05).
Figure 3.
Behavioral recovery after photothrombosis stroke. Behavior was assessed on grid-walking (A and B), cylinder/forelimb asymmetry (C), and on the reaching (D) tasks. Analysis of forelimb (A) and hindlimb (B) foot faults revealed a significant increase in the number of foot faults compared with baseline and time-matched sham controls. Assessment of forelimb asymmetry using the cylinder task (C) showed that the mice had a greater tendency to spend more time on their left forepaw after stroke. The ability of mice to successfully reach for pellets (D) was only impaired for 1 week after stroke compared with sham-operated mice. **P<0.01, ***P<0.001 compared with sham-treated controls. An n=10 per group.
Assessment on a task that requires precision grasping of food pellets (reaching task) showed rapid recovery or compensation (Figure 3D). Mice retrieved on average 7 to 8 per 15 sugar pellets through a small narrow opening before stroke. After stroke the retrieval was significantly impaired at 7 days in both the 15- and 18-minute groups (n=10 per group; P<0.01 compared with sham controls). However, by 14 days no significant differences were observed in the ability to retrieve pellets in between either stroke group or compared with sham-operated controls.
Optical Intrinsic Signaling Imaging Reveals a Slow and Progressive Remapping of the Peri-Infarct Cortex
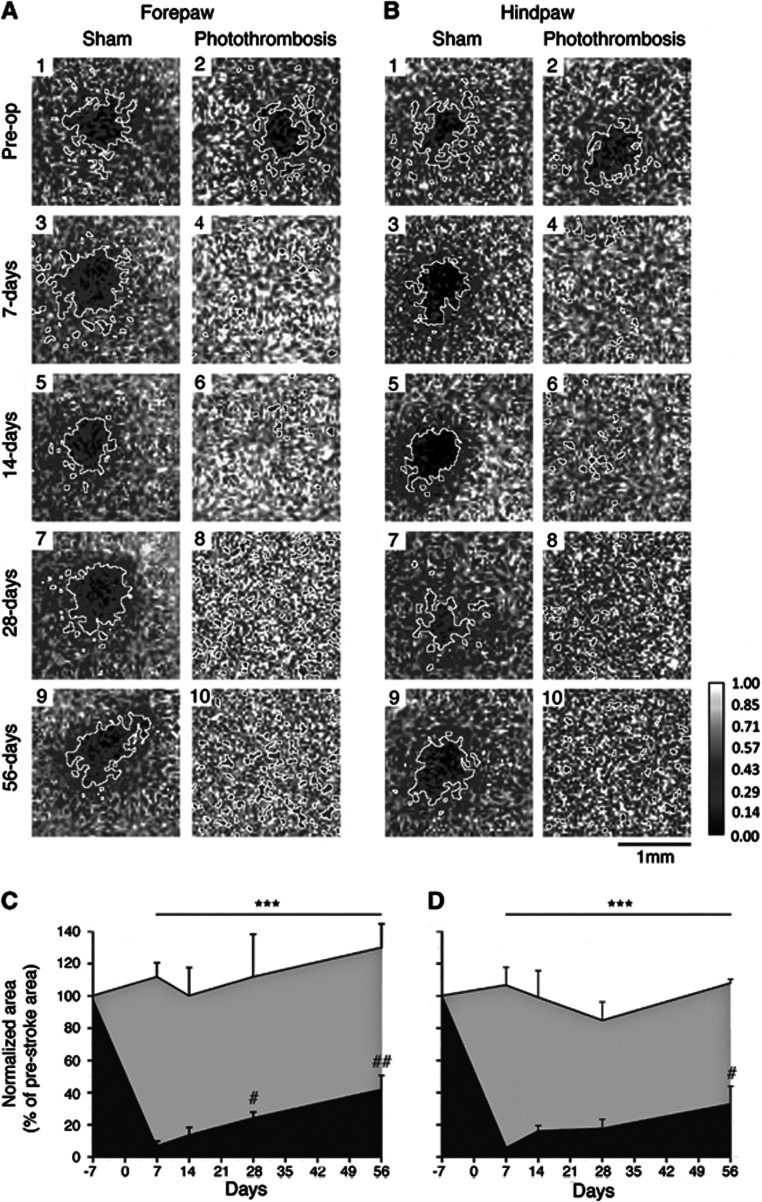
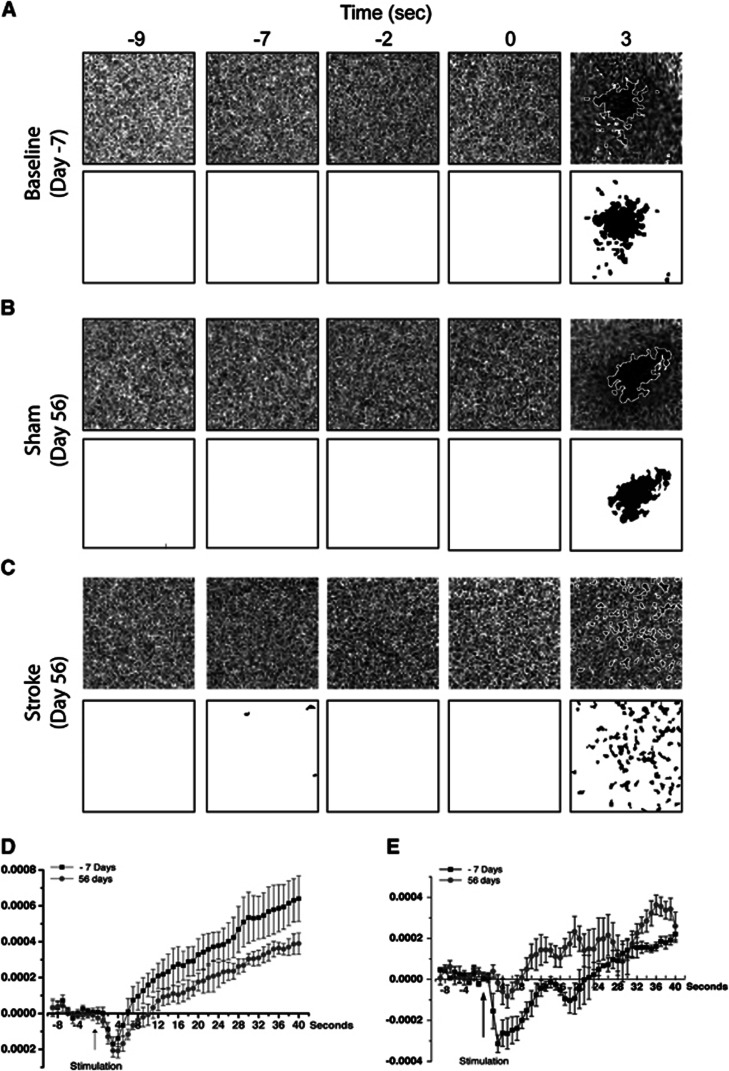
Optical intrinsic signaling measures activity-dependent changes in the light reflectance of brain tissue.13, 14 Forepaw (Figure 4A) or HP (Figure 4B) stimulation in control animals generated highly replicable cortical maps over the 5 sessions, 56-day imaging protocol (Figures 4C and 4D, respectively; see also Figure 5). Activation kinetic maps for both sham and stroked animals are shown in Figures 5D and 5E, respectively, illustrating time-dependent activation and reproducibility of the images (Figure 5). Optical intrinsic signaling measures were only performed in the 15-minute stroke group as no further behavioral impairments were observed in the 18-minute stroke group. Cortical sensory maps were significantly altered after a 15-minute stroke. Whereas forelimb and hindlimb stimulation evoke a sharply circumscribed patch of activity in the somatosensory cortex before stroke, after stroke this pattern of activation was scattered and diffuse. The total area of cortical activation for FP (Figure 4C) and HP (Figure 4D) was significantly reduced for the entire post-stroke period (n=5 per group; P<0.001). Even though FP and HP responses remain diffuse for all imaging sessions after stroke, there is a significant increase in the combined total area of activation during recovery for FP at 28 and 56 days after stroke, and for HP at 56 days after stroke, compared with day 7 after stroke (P<0.05 at 28 days, P<0.01 at 56 days for FP; P<0.05 at 56 days for HP; Figures 5A–C). These data reveal that this pattern of recovery is occurring in regions adjacent to the stroke and indicate an altered pattern of sensory-evoked limb representation in peri-infarct tissue, or cortical remapping after stroke. This process of cortical remapping takes weeks to evolve and the data indicate only partial recovery of both FP and HP with less recovery occurring for HP.
Figure 4.
Repeat optical intrinsic signaling (OIS) imaging in sham and stroke animals. Ratiometric images reveal the area of activation (enclosed by a white border) after stimulation of either right forepaw (FP) (A) or hindpaw (HP) (B). In panels A and B odd numbers are from control animals, whereas even numbers are from stroke animals: 1 and 2, prestroke; 3 and 5, 7 days after; 5 and 6, 14 days after; 7 and 8, 28 days after; and 9 and 10, 56 days afterstroke. Panels c and d show the normalized area of activation (% prestroke area) for FP and HP, respectively. Repeat imaging of the same animals over time shows a partial regain of the total area of activation for both FP and less so for HP that takes weeks to evolve. Sham animals are represented by the gray shading, whereas stroke animals are represented by the black shading. ***P<0.001 compared with both sham-operated controls and prestroke measures; #P<0.05, ##P<0.01 compared with 7 days after stroke. An n=5 per group.
Figure 5.
Activation kinetics for optical intrinsic signaling (OIS) imaging. (A–C) Representative images from an animal measured at baseline 7 days before surgery (Day −7, A), and from a sham and a stroke animal 56 days after surgery (Day 56, B and C, respectively). In the top panel are ΔR/R images, and below are the same images that have been filtered and thesholded. (D) An average plot of the pixel values of the ΔR/R images from the same experiments from five sham animals. (E) An average plot of the pixel values of the ΔR/R images from the same experiments from five stroked animals. The traces in both panels D and E are from baseline measurements taken 7 days before surgery (Day −7) and from 56 days after surgery (Day 56). These data show that, even though diffuse, OIS maps after stroke show significant changes in sensory-evoked hemodynamic activity.
Stroke Induces Sprouting of New Connections
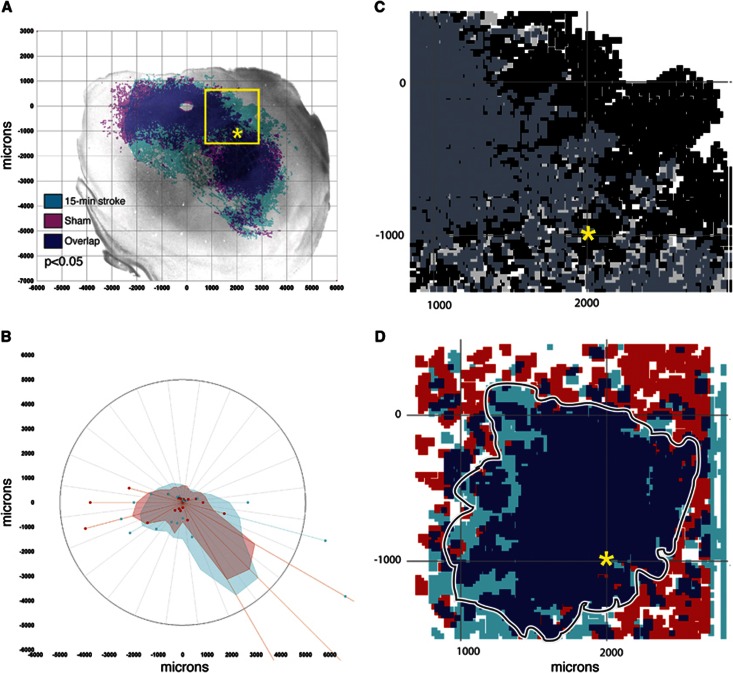
To assess whether the process of neuronal sprouting is associated with functional recovery, the same sham and 15-minute stroke animals used for behavioral testing were injected with the neuroanatomic tracer BDA, 8 weeks after stroke into the residual rostral motor/premotor cortex. Assessment of sprouting was only undertaken in the 15-minute stroke group as no further behavioral impairments were observed in the 18-minute stroke group. The distribution of BDA-labeled processes (i.e., axons and dendrites; Figure 6A) were mapped in x/y coordinates, registered to the somatosensory body map in tangential cortical sections, collapsed from individual animals to treatment groups, and statistically compared for changes in the pattern of motor cortex connections.7, 10 Assessment of BDA-labeled processes revealed a significant increase in labeling in the stroke group compared with sham-operated controls (n=4 to 5 per group; P<0.05; Figure 5A), indicating that the formation of new connections or axonal sprouting occurs after stroke. This sprouting occurred in a circumferential region around the motor cortex, but particularly in the motor to premotor and motor to somatosensory connections as seen in polar plots of the directionality of axonal connections (Figure 6B).
Figure 6.
Pattern of cortical connections in sham and stroke animals. The pattern of biotinylated dextran amine (BDA)-labeled projections (A, B) was assessed 8 weeks after stroke in sham and stroke mice. A significant increase in sprouting is observed after stroke compared with sham-operated controls (P<0.05, n=4 to 5 per group). In polar plots of these connections, shaded polygons (B) represent the 70th percentile of the distances of labeled projections from the injection site in each segment of the graph; weighted polar vectors (B) represent the normalized distribution of the quantity of axonal connections in a given segment of the graph for stroke (light blue), or sham (red). Sensory-evoked optical intrinsic signaling (OIS) maps for forepaw (D) have been registered to sprouting/neuroanatomic maps (C) from data collected 8 weeks after stroke. Panel C shows axonal sprouting data (black=stroke; light gray=sham; dark gray=overlap), in the equivalent coordinates as the OIS data in panel D (red=stroke; light blue=sham; dark blue=overlap). Registered OIS maps for forepaw (FP) reveal that recovery is occurring in a region where sprouting is also occurring, highlighting a region that is most likely linked to functional/behavioral recovery. The box in panel A is the region of interest shown in panels C and D, with the asterisk in panels A, C, and D representing a point of commonality.
To assess whether the remapping in sensory-evoked cortical activations (OIS maps) were occurring in a region where sprouting was also occurring, we registered the OIS maps onto the topographical maps for the sprouting data. Registration of the sensory-evoked registered OIS maps to the sprouting response shows that the changes in evoked topography of both FP and HP occurred in a region where sprouting also occurred, in posterior motor and rostral somatosensory cortex (Figures 6C and 6D).
Discussion
Studies of human recovery have successfully used measures of both functional brain mapping and behavioral recovery to determine how the brain reorganizes after stroke.15 These approaches have identified plasticity within both peri-infarct and connected cortical areas during recovery.1, 4 Ideally, rodent models of stroke should follow these human studies with precise molecular and cellular experiments that determine candidate therapies to promote neural repair. However, mouse stroke models provided a limited ability for paired functional brain mapping and behavioral studies because the small mouse brain provides poor resolution using functional magnetic resonance imaging,16 and mouse behavioral studies have lagged behind the rat.17 We have used the high spatial resolution and functional specificity18 of OIS imaging to overcome this difficulty. Optical intrinsic signaling has been used to show plasticity of the somatosensory cortex in rat over long time scales.19, 20 It has also been used in mouse to map the post-stroke cortex at specific time points in recovery,21 but has not been used for sequential remapping of functions over time after stroke.
We imaged FP and HP sensorimotor maps over time in the living mouse before and after stroke, to determine changes in functional sensorimotor networks during behavioral recovery. Forepaw and HP stimulation activates a circumscribed limb-specific somatosensory area in controls and mice before stroke (Figure 5). However, stroke in the motor cortex causes this adjacent, intact somatosensory cortex to lose its proper limb sensory representation. Functional activation after stroke is more scattered and diffuse than before stroke, even in noninfarcted areas. This finding indicates that stroke degrades the functional response in adjacent, surviving, and structurally normal cortex over weeks. Because OIS reflects hemodynamic activity,13 this breakdown in somatosensory representation may reflect either an alteration in neural activity or an alteration in the neurovascular coupling after stroke. After stroke there is a long-lasting imbalance between inhibitory and excitatory connections, such that tonic γ-aminobutyric acid inhibition is enhanced in the peri-infarct cortex and peri-infarct neurons are hypoexcitable.9 It is plausible that the loss of cortical representational maps is because of increased tonic inhibition and reduced cortical excitability. Stroke also stimulates altered glutamate neurotransmission in the peri-infarct cortex, and also AMPA (α-amino-3-hydroxy-5-methyl-4-isoxazolepropionic acid) receptor-induced brain-derived neurotrophic factor production. These events in the peri-infarct cortex highlight the critical role of this region in post-stroke functional recovery.8
Cerebral ischemia has been shown to result in the formation of new connections within the brain, a process known as post-stroke axonal sprouting.6, 7, 22, 23 Axonal sprouting after a stroke is associated with the remapping of both local and long-distance connections linked to regions of injury,6, 7, 22, 23 and is correlated with the functional recovery.1, 6, 22, 24, 25 Significant turnover in spine numbers and later plasticity of these spines occurs over weeks after stroke in the peri-infarct cortex, and correlates with functional gains after stroke.21 These data indicate a possible correspondence of structural changes in brain circuits, because of presynaptic (axonal sprouting) and postsynaptic (dendritic remodeling) plasticity with physiologic plasticity in brain sensorimotor brain maps. We used established behavioral techniques, OIS imaging for functional mapping, and a newly developed quantitative connectional mapping technique7, 10 to determine whether axonal sprouting underlies cortical map plasticity and behavioral recovery.
We found a significant increase in axonal sprouting after stroke compared with sham animals, consistent with an increase in structural plasticity of brain circuits. When OIS topographical maps are registered onto the maps of cortical connections, there are regions of new sensory map physiologic responses in areas of new motor and somatosensory connections (Figures 6C and 6D). Taken together, these data indicate axonal sprouting and the formation of new connections within sensorimotor systems are a correlate for behavioral recovery. Sprouting within these areas is associated with functional recovery in both nonhuman primates and humans.1, 4, 25 Most of this evidence stems from the use of both anterograde and retrograde tracers to define neuronal projections. This technique does have limits, as it does not specifically identify cortical changes associated with inhibitory circuits.9 Moreover, Sigler et al26 report early changes in sensory-evoked cortical activity patterns that occur at times too early for sprouting to have taken effect.26 These and others cortical plasticity responses that are independent of axonal sprouting may underlie other aspects of recovery after stroke, such as those that occur very early after the infarct.27 Multimodal techniques, recording anatomic changes, behavioral readouts, biochemical markers, imaging, and others, will offer the best chance of elucidating overall mechanisms of recovery after ischemic or traumatic injuries.
Summary and Conclusions
Stroke induces a breakdown in the representation of sensory function in adjacent, intact tissue. This tissue recovers over time to represent sensory function in a more diffuse way, within a region of cortical axonal sprouting and during the time period of behavioral recovery. The combination of functional, behavioral, and anatomic information provided by this multimodal approach is technically feasible, minimally invasive, and has the potential to generate mechanistically and clinically relevant insights in the investigation of stroke recovery.
The authors declare no conflicts of interests
Footnotes
This work was supported by an American Heart Association Postdoctoral Fellowship, a Repatriation Fellowship from the New Zealand Neurological Foundation and the Sir Charles Hercus Fellowship from the Health Research Council of New Zealand (ANC), The Dr Miriam and Sheldon G Adelson Medical Research Foundation (STC, ACC), the Larry L Hillblom Foundation (STC, ACC), and NIH (K08 NS 059072, R21 NS070084; KCB).
References
- Calautti C, Baron JC. Functional neuroimaging studies of motor recovery after stroke in adults: a review. Stroke. 2003;34:1553–1566. doi: 10.1161/01.STR.0000071761.36075.A6. [DOI] [PubMed] [Google Scholar]
- Dobkin BH. Training and exercise to drive poststroke recovery. Nat Clin Pract Neurol. 2008;4:76–85. doi: 10.1038/ncpneuro0709. [DOI] [PMC free article] [PubMed] [Google Scholar]
- Cramer SC. Repairing the human brain after stroke: I. Mechanisms of spontaneous recovery. Ann Neurol. 2008;63:272–287. doi: 10.1002/ana.21393. [DOI] [PubMed] [Google Scholar]
- Dancause N, Barbay S, Frost SB, Plautz EJ, Chen D, Zoubina EV, et al. Extensive cortical rewiring after brain injury. J Neurosci. 2005;25:10167–10179. doi: 10.1523/JNEUROSCI.3256-05.2005. [DOI] [PMC free article] [PubMed] [Google Scholar]
- Brown CE, Aminoltejari K, Erb H, Winship IR, Murphy TH. In vivo voltage-sensitive dye imaging in adult mice reveals that somatosensory maps lost to stroke are replaced over weeks by new structural and functional circuits with prolonged modes of activation within both the peri-infarct zone and distant sites. J Neurosci. 2009;29:1719–1734. doi: 10.1523/JNEUROSCI.4249-08.2009. [DOI] [PMC free article] [PubMed] [Google Scholar]
- Carmichael ST, Wei L, Rovainen CM, Woolsey TA. New patterns of intracortical projections after focal cortical stroke. Neurobiol Dis. 2001;8:910–922. doi: 10.1006/nbdi.2001.0425. [DOI] [PubMed] [Google Scholar]
- Li S, Overman JJ, Katsman D, Kozlov SV, Donnelly CJ, Twiss JL, et al. An age-related sprouting transcriptome provides molecular control of axonal sprouting after stroke. Nat Neurosci. 2010;13:1496–1504. doi: 10.1038/nn.2674. [DOI] [PMC free article] [PubMed] [Google Scholar]
- Clarkson AN, Overman JJ, Zhong S, Mueller R, Lynch G, Carmichael ST. Ampa receptor-induced local brain-derived neurotrophic factor signaling mediates motor recovery after stroke. J Neurosci. 2011;31:3766–3775. doi: 10.1523/JNEUROSCI.5780-10.2011. [DOI] [PMC free article] [PubMed] [Google Scholar]
- Clarkson AN, Huang BS, Macisaac SE, Mody I, Carmichael ST. Reducing excessive gaba-mediated tonic inhibition promotes functional recovery after stroke. Nature. 2010;468:305–309. doi: 10.1038/nature09511. [DOI] [PMC free article] [PubMed] [Google Scholar]
- Overman JJ, Clarkson AN, Wanner IB, Overman WT, Eckstein I, Maguire JL, et al. A role for ephrin-a5 in axonal sprouting, recovery, and activity-dependent plasticity after stroke. Proc Natl Acad Sci USA. 2012;109:E2230–E2239. doi: 10.1073/pnas.1204386109. [DOI] [PMC free article] [PubMed] [Google Scholar]
- Chang JC, Shook LL, Biag J, Nguyen EN, Toga AW, Charles AC, et al. Biphasic direct current shift, haemoglobin desaturation and neurovascular uncoupling in cortical spreading depression. Brain. 2010;133:996–1012. doi: 10.1093/brain/awp338. [DOI] [PMC free article] [PubMed] [Google Scholar]
- Paxinos G, Franklin KBJ. The mouse brain in stereotaxic coordinates. Elsevier Academic Press; 2004. [Google Scholar]
- Grinvald A, Frostig RD, Siegel RM, Bartfeld E. High-resolution optical imaging of functional brain architecture in the awake monkey. Proc Natl Acad Sci USA. 1991;88:11559–11563. doi: 10.1073/pnas.88.24.11559. [DOI] [PMC free article] [PubMed] [Google Scholar]
- Harrison TC, Sigler A, Murphy TH. Simple and cost-effective hardware and software for functional brain mapping using intrinsic optical signal imaging. J Neurosci Methods. 2009;182:211–218. doi: 10.1016/j.jneumeth.2009.06.021. [DOI] [PubMed] [Google Scholar]
- Marshall JW, Ridley RM, Baker HF, Hall LD, Carpenter TA, Wood NI. Serial mri, functional recovery, and long-term infarct maturation in a non-human primate model of stroke. Brain Res Bull. 2003;61:577–585. doi: 10.1016/s0361-9230(03)00214-4. [DOI] [PubMed] [Google Scholar]
- Silver X, Ni WX, Mercer EV, Beck BL, Bossart EL, Inglis B, et al. In vivo 1 h magnetic resonance imaging and spectroscopy of the rat spinal cord using an inductively-coupled chronically implanted rf coil. Magn Reson Med. 2001;46:1216–1222. doi: 10.1002/mrm.1319. [DOI] [PubMed] [Google Scholar]
- Tennant KA, Jones TA. Sensorimotor behavioral effects of endothelin-1 induced small cortical infarcts in c57bl/6 mice. J Neurosci Methods. 2009;181:18–26. doi: 10.1016/j.jneumeth.2009.04.009. [DOI] [PMC free article] [PubMed] [Google Scholar]
- Sheth SA, Nemoto M, Guiou M, Walker M, Pouratian N, Hageman N, et al. Columnar specificity of microvascular oxygenation and volume responses: Implications for functional brain mapping. J Neurosci. 2004;24:634–641. doi: 10.1523/JNEUROSCI.4526-03.2004. [DOI] [PMC free article] [PubMed] [Google Scholar]
- Polley DB, Chen-Bee CH, Frostig RD. Two directions of plasticity in the sensory-deprived adult cortex. Neuron. 1999;24:623–637. doi: 10.1016/s0896-6273(00)81117-4. [DOI] [PubMed] [Google Scholar]
- Chen-Bee CH, Polley DB, Brett-Green B, Prakash N, Kwon MC, Frostig RD. Visualizing and quantifying evoked cortical activity assessed with intrinsic signal imaging. J Neurosci Methods. 2000;97:157–173. doi: 10.1016/s0165-0270(00)00180-1. [DOI] [PubMed] [Google Scholar]
- Brown CE, Li P, Boyd JD, Delaney KR, Murphy TH. Extensive turnover of dendritic spines and vascular remodeling in cortical tissues recovering from stroke. J Neurosci. 2007;27:4101–4109. doi: 10.1523/JNEUROSCI.4295-06.2007. [DOI] [PMC free article] [PubMed] [Google Scholar]
- Carmichael ST, Chesselet MF. Synchronous neuronal activity is a signal for axonal sprouting after cortical lesions in the adult. J Neurosci. 2002;22:6062–6070. doi: 10.1523/JNEUROSCI.22-14-06062.2002. [DOI] [PMC free article] [PubMed] [Google Scholar]
- Benowitz LI, Carmichael ST. Promoting axonal rewiring to improve outcome after stroke. Neurobiol Dis. 2010;37:259–266. doi: 10.1016/j.nbd.2009.11.009. [DOI] [PMC free article] [PubMed] [Google Scholar]
- Stroemer RP, Kent TA, Hulsebosch CE, Feeney DM. Enhanced neocortical neural sprouting, synaptogenesis, and behavioral recovery with d-amphetamine therapy after neocortical infarction in rats—editorial comment. Stroke. 1998;29:2381–2395. doi: 10.1161/01.str.29.11.2381. [DOI] [PubMed] [Google Scholar]
- Dijkhuizen RM, Singhal AB, Mandeville JB, Wu O, Halpern EF, Finklestein SP, et al. Correlation between brain reorganization, ischemic damage, and neurologic status after transient focal cerebral ischemia in rats: A functional magnetic resonance imaging study. J Neurosci. 2003;23:510–517. doi: 10.1523/JNEUROSCI.23-02-00510.2003. [DOI] [PMC free article] [PubMed] [Google Scholar]
- Sigler A, Mohajerani MH, Murphy TH. Imaging rapid redistribution of sensory-evoked depolarization through existing cortical pathways after targeted stroke in mice. Proc Natl Acad Sci USA. 2009;106:11759–11764. doi: 10.1073/pnas.0812695106. [DOI] [PMC free article] [PubMed] [Google Scholar]
- Murphy TH, Corbett D. Plasticity during stroke recovery: from synapse to behaviour. Nat Rev Neurosci. 2009;10:861–872. doi: 10.1038/nrn2735. [DOI] [PubMed] [Google Scholar]


