Abstract
Effects of chronic hypoxia on hemodynamic response to sensory stimulation were investigated. Using laser-Doppler flowmetry, change in cerebral blood flow (CBF) was measured in awake mice, which were housed in a hypoxic chamber (8% O2) for 1 month. The degree of increase in CBF evoked by sensory stimulation was gradually decreased over 1 month of chronic hypoxia. No significant reduction of increase in CBF induced by hypercapnia was observed during 1 month. Voltage-sensitive dye (VSD) imaging of the somatosensory cortex showed no significant decrease in neural activation over 1 month, indicating that the reduction of increase in CBF to sensory stimulation was not caused by cerebrovascular or neural dysfunction. The simulation study showed that, when effective diffusivity for oxygen in the capillary bed (D) value increases by chronic hypoxia due to an increase in capillary blood volume, an increase in the cerebral metabolic rate of oxygen utilization during neural activation can occur without any increase in CBF. Although previous study showed no direct effects of acute hypoxia on CBF response, our finding showed that hemodynamic response to neural activation could be modified in response to a change in their balance to energy demand using chronic hypoxia experiments.
Keywords: cerebral blood flow, energy metabolism, hemodynamics, microcirculation, neurovascular unit
Introduction
The oxygen supply to the brain plays an important role in energy metabolism in tissues, and long-term low oxygen environments cause several adaptation mechanisms.1, 2 In human studies, hypobaric hypoxia at high altitudes has been shown to cause cerebral vasodilatation3 and increase the cerebral blood flow (CBF), blood pressure, and hematocrit.2, 4 In rodent, several long-term adaptations in systemic and cerebral hemodynamics to chronic hypoxia have been observed. Baseline CBF increased during the first several days during hypoxia (10% O2 concentration), and then began to decrease, finally returning to the prehypoxia baseline level after 3 weeks.2, 5 In addition, increases in hematocrit and respiratory rate were observed during 3 weeks of chronic hypoxia. Capillary density in the brain significantly increased,5, 6 and cerebral vasodilatation occurred7 after several days of chronic hypoxia. These effects on the cerebral vasculature were thought to be associated with hypoxia-inducible factor-1 and angiopoietin-2, whose gene expression levels were activated after several days of hypoxia.1, 8, 9
Although effects of chronic hypoxia on baseline CBF and capillary density have been investigated, effects of the hemodynamic response under chronic hypoxia remain unclear. The hemodynamic response to neuronal activation under acute hypoxia was investigated in several studies,10, 11, 12, 13 but it is clear that the animal condition in acute hypoxic experiments is quite different from that in chronic hypoxic experiments. Especially, increases in capillary density, baseline CBF, and the diameter of cerebral vessels occur during chronic hypoxia, and such adaptations might affect the hemodynamic responses to neuronal activation. To clarify the long-term changes of CBF response to evoked neural activity in the mouse exposed to chronic hypoxia, we measured the cerebrovascular responses to neural activation and hypercapnia in awake mice under chronic hypoxia. The hemodynamic responses were evaluated by laser-Doppler flowmetry (LDF) experiment repeatedly over 1 month of chronic hypoxia in the same mouse somatosensory cortex. Voltage-sensitive dye (VSD) imaging was also performed to assess the effects of chronic hypoxia on neuronal activity. Furthermore, a simulation study was performed to demonstrate the relation between CBF and the cerebral metabolic rate of oxygen utilization (CMRO2) during neural activation under the condition of chronic hypoxia.
Materials and methods
Animal Preparation
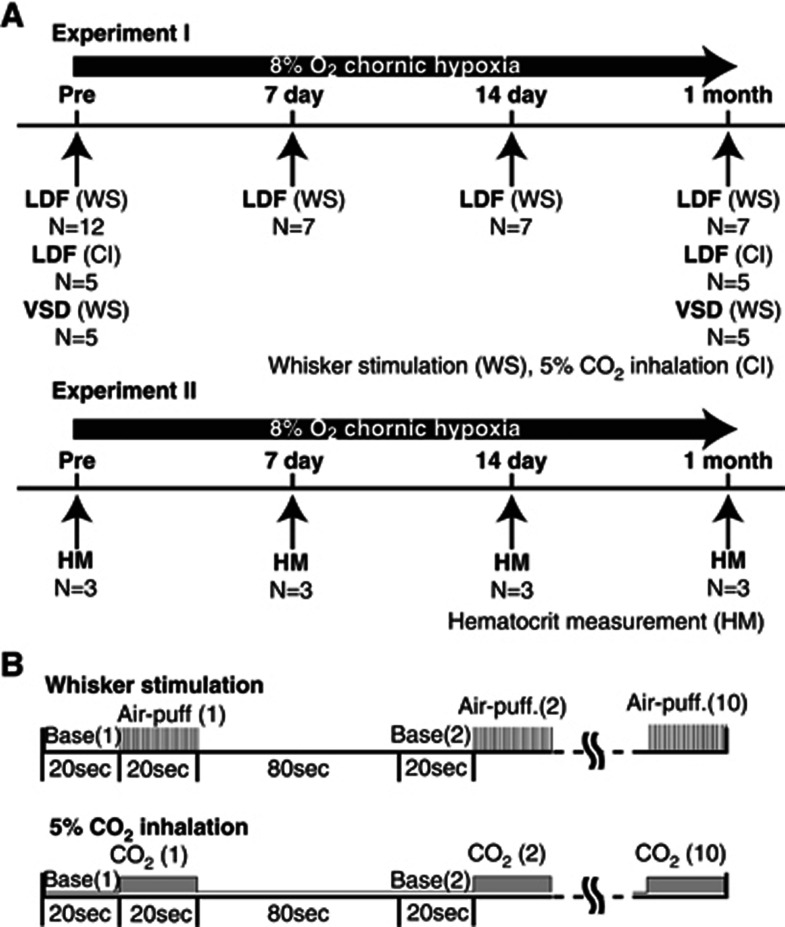
All experiments were performed in accordance with the institutional guidelines on the humane care and use of laboratory animals and were approved by the Institutional Committee for Animal Experimentation. A total of 24 male C57BL/6J mice (20 to 30 g, 7 to 11 weeks; Japan SLC, Hamamatsu, Japan) were housed in hypoxic chambers at 8% to 9% O2 concentration and used in two experiments as follows. In the first experiment (experiment I; Figure 1A), LDF measurement during whisker stimulation was performed before (N=12) and at 7 days (N=7), 14 days (N=7) during, and 1 month (N=7) after chronic hypoxia. In five animals selected from these animals, LDF measurements during CO2 inhalation and VSD imaging during whisker stimulation were performed before and 1 month after chronic hypoxia. In the second experiment (experiment II; Figure 1A), hematocrit measurement was performed in a total of 12 animals (each measurement used three animals) before, at 7 days, 14 days during, and 1 month after chronic hypoxia. Anesthesia was only used in this experiment II for pain avoidance.
Figure 1.
(A) Experiment I (laser-Doppler flowmetry (LDF) measurement and voltage-sensitive dye (VSD) imaging in awake animals) and experiment II (hematocrit measurement). LDF measurement during whisker stimulation was performed before (N=12) and 7 days (N=7), 14 days (N=7), and 1 month (N=7) after the start of chronic hypoxia. In five of these animals, LDF measurements during CO2 inhalation and VSD imaging during whisker stimulation were performed before and 1 month after chronic hypoxia. In experiment II, hematocrit measurement was performed in a total of 12 animals (each measurement used three animals) before, at 7 days and 14 days during, and 1 month after chronic hypoxia. Hematocrit was estimated with a blood analyzer (I-STAT; Abbott). (B) Experimental protocols of whisker stimulation and 5% CO2 inhalation. In whisker stimulation, 20 seconds of rectangular pulse air-puff stimulation (50-milliseconds pulse width and 100-milliseconds onset-to-onset interval, i.e., 10 Hz frequency) was given to the right whisker region of mice. Ten consecutive trials were repeated with an onset-to-onset interval of 120 seconds in each experiment. In CO2 inhalation, 5% CO2 gas was given to mice continuously for the same duration (20 seconds) and interval (120 seconds) as the sensory stimulation.
A surgical procedure was applied to prepare a chronic cranial window and fixation to the heads of mice for reproducible stereotaxic measurement for up to 1 month. The animals were anesthetized with a mixture of air, oxygen, and isoflurane (3% to 5% for induction and 2% for surgery) via a facemask. The animals were fixed in a stereotactic frame, and rectal temperature was maintained at 38°C using a heating pad (ATC-210, Unique Medical, Tokyo, Japan). The methods for preparing the chronic cranial window have been reported in detail by Tomita et al.14 A midline incision (10 mm) was made to expose the skull. Craniotomy was performed over the left somatosensory cortex, keeping the dura intact (3 to 4 mm diameter, centered at 1.8 mm caudal, and 2.5 mm lateral from bregma). The brain surface was sealed with a quartz coverslip using dental cement (Ionosit, DMG, Hamburg, Germany) to make the preparation waterproof. A custom metal plate was affixed to the skull with a 7-mm diameter hole centered over the cranial window. After completion of the surgery, the animals were allowed to recover from anesthesia and housed for at least 7 days before initiation of the experiments.
Exposure to Chronic Hypoxia
From 1 week after the cranial window surgery, the mice were kept for up to 1 month in hypoxic chambers (8% to 9% O2 in N2) with food and water provided ad libitum. The chamber was a fully sealed plastic box (200 mm long, 150 mm wide, and 100 mm high) with two nozzles. One nozzle, attached to the lateral side of the chamber, was connected to a gas blender (GB-2C, KOFLOC, Kyoto, Japan) to deliver the hypoxic gas mixture into the chamber. The second nozzle was used to flush out the gas mixture. The hypoxic gas was regulated by gas blender, and the O2 levels in the chamber were monitored every day using an oxygen sensor (OPA-5000E, KITAGAWA, Kanazawa, Japan). During chronic hypoxia, the mean oxygen concentration in the chamber was 8.6%±0.2%, indicating that the hypoxic chamber was maintained within our target range (8% to 9% O2). The temperature in the chamber was controlled at ∼23°C (range 22°C to 24°C) with a room air conditioner. Two animals per chamber were housed in each experiment for a maximum of up to 1 month. The chamber was opened for 10 minutes every 3 days for cleaning and animal care.
Laser-Doppler Flowmetry Measurement
The animals were moved from a hypoxic chamber to a recording room, and the measurement was conducted under normoxic condition. The body weight of the animal was measured, and then the head was fixed to a custom-made stereotactic apparatus with a floating ball device that allowed the animal to move freely during the recording of LDF.15 Evoked CBF was measured with laser-Doppler flowmetry (FLO-C1, OMEGAWAVE, Tokyo, Japan), as described previously.16 The tip of the LDF probe (Type NS, OMEGAWAVE) was positioned over the whisker stimulation-induced activated cortex on the cranial window while avoiding large blood vessel areas. The activated hot spot was preliminarily determined by screening the response to sensory stimulation at several points in the somatosensory area. Then, the X–Y position of the LDF tip was marked on the edge of the cranial window for reproducible placement of the LDF tip. The angle of the LDF probe to the cortex was fixed by manipulator, perpendicular to the cranial window surface. Also, the distance between the LDF tip and the surface of the cranial window was maintained among the different experiments. On each day of the experiments, the level constancy of the reflected light signal for the LDF measurements was confirmed before initiation of the recording.
The time course of the LDF signal changes was recorded using a polygraph data acquisition system (MP150, BIOPAC Systems, Goleta, CA, USA) at a sampling rate of 200 Hz and analyzed offline. For each trial of the experiment, the LDF signal was normalized by the 20-second prestimulus baseline level, and averaged across 10 trials. For the whisker stimulation experiments, the magnitude of evoked CBF was calculated as the mean percentage change for 20-seconds stimulation periods relative to baseline. In the case of CO2 inhalation, the mean percentage increase in CBF was calculated from 10 to 20 seconds of the stimulation period, because the increase in CBF usually started 5 to 10 seconds after inhalation. Statistical analysis was performed to compare the evoked CBF across different experimental days using one-way analysis of variance followed by Tukey's test.
Voltage-Sensitive Dye Imaging
The cerebral cortex was stained with RH1691 (Optical Imaging, Rehovot, Israel) via transdura delivery for 2 hours and rinsed with dye-free saline for 30 seconds. Dye and saline were injected through a metal tube (500-μm inside-diameter), which was connected to a space between the cranial window and dura through one side of the cranial window. Then, the mice were fixed onto the apparatus while keeping an awake-state. The excitation light was 632±10 nm, and a fluorescent light from the stained cortex was passed through a dichroic mirror and long-pass filter (>660 nm).15 The image was obtained using a 128-channel photodiode array at a rate of 1 kHz. The X–Y in-plane resolution was 250 × 250 μm2.
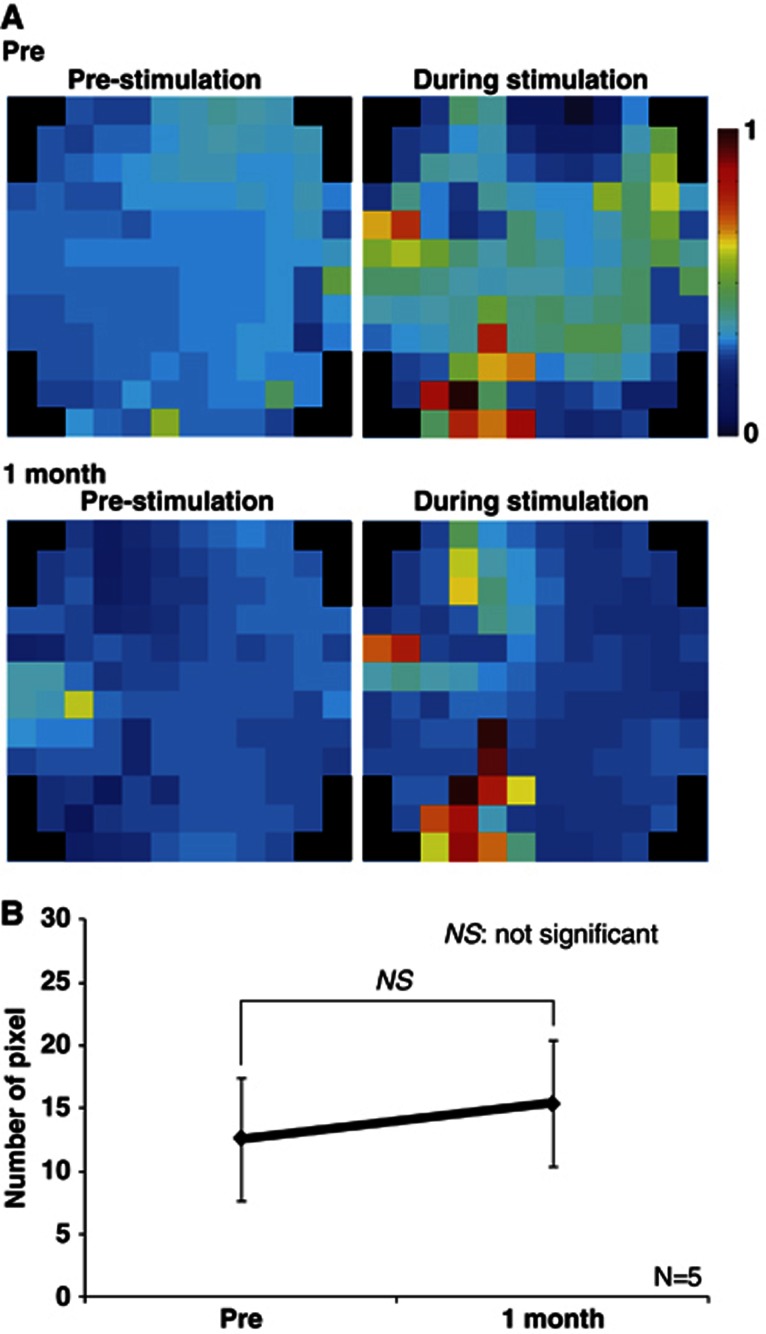
For the analysis of VSDI signals, independent component analysis was applied to exclude systemic physiological noise originating from the heartbeat and respiration.15 Then, all of the VSDI signals were normalized to the maximal response measured over 128 channels. The whisker stimulation-induced activated region was determined by measuring the number of pixels at which the normalized VSD signal was greater than an intensity threshold of 0.5 (maximum pixel intensity 1.0). Comparison of the activated region was made between pre- and posthypoxia conditions, and statistical analysis was performed by paired t-test.
Whisker Stimulation
Compressed air (up to 10 psi) was generated with an air compressor (NUP-2, AS ONE, Osaka, Japan), and the pressure was controlled with a Pico Pump (PV830, WPI, Osaka, Japan). The compressed air pulse was delivered to the entire right whisker region from a nozzle placed ∼1 cm away from the mouse.16 Twenty seconds rectangular pulse stimulation (50-milliseconds pulse width and 100-milliseconds onset-to-onset interval, i.e., 10 Hz frequency) was generated with Master-8 (A.M.P.I, Jerusalem, Israel). In each experiment, 10 consecutive trials were repeated with an onset-to-onset interval of 120 seconds (Figure 1B).
Hypercapnia (5% CO2 Inhalation)
A hypercapnic gas mixture of 5% CO2, 21% O2, and residual N2 was inhaled by awake-behaving mice via a facemask (300 mL/min). At all times except during the CO2 inhalation, the mice inhaled room air (300 mL/min). CO2 gas was given to the mice for the same duration (20 seconds) and interval (120 seconds) as the sensory stimulation using the Master 8 (Figure 1B). CO2 inhalation was repeated 10 times, and the LDF signals were averaged offline.
Experiment II: Hematocrit Measurement
Hematocrit measurement was performed in total 12 animals (each measurement used three animals) before, at 7 days, 14 days, and 1 month after the start of chronic hypoxia. Because mice under hematocrit measurement, which severely influenced the physiological state, were unsuitable for the long-term LDF and VSDI experiment, those in experiment II were different from those in experiment I. In the experiment, the mice were moved from the hypoxic chambers and exposed to room air. They were anesthetized with isoflurane (3% to 5% for induction and 2% for surgery) using facemasks. Body temperature was monitored with a rectal probe and maintained at ∼37.0°C with a heating pad. Heart blood samples were obtained with a needle (23 gauge) before and after 7 days, 14 days, and 30 days of hypoxic chamber exposure (Figure 1A). The hematocrit level was analyzed with a blood analyzer (I-STAT; Abbott, Chicago, IL, USA).
Simulation Study
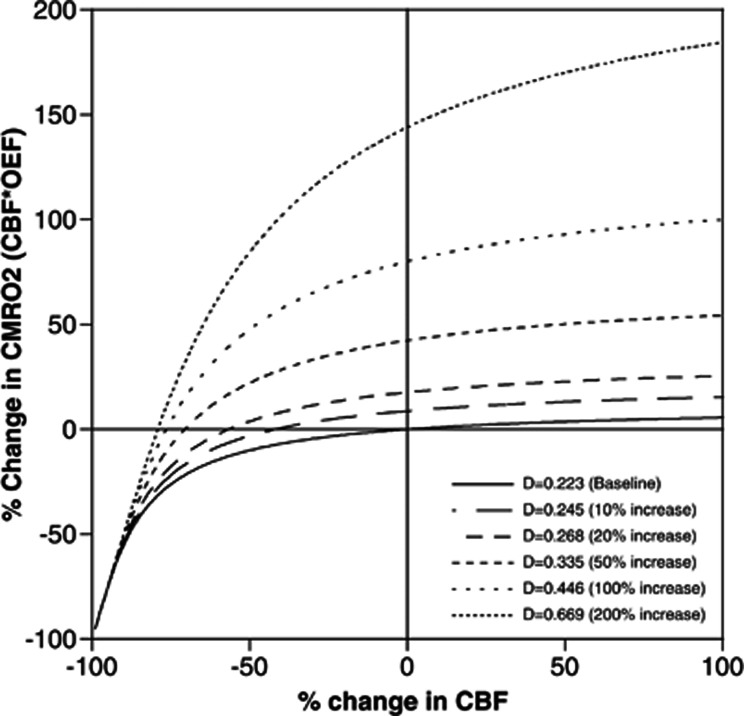
To evaluate the relation between CBF and CMRO2 during neural activation under the condition of chronic hypoxia, a simulation study was performed. The effective diffusivity for oxygen in the capillary bed (D) was defined as OEF=1−e(−D/CBF), where OEF is the oxygen extraction fraction.17 Cerebral metabolic rate of oxygen utilization can be calculated as CMRO2=Ca • CBF • OEF, where Ca is the total oxygen content in arterial blood. Thus, the relation between changes in CBF and CMRO2 during neural activation should depend on D. Assuming the baseline CBF for mouse as 100 mL per 100 mL per minute17 and baseline OEF to be 0.2,18 D can be calculated to be 0.223 mL per mL per minute. The D value is proportional to the capillary blood volume,19 and a 40% to 70% increase in capillary diameter by chronic hypoxia has been reported in mice using two-photon laser microscopy,7 corresponding to a 96% to 189% increase in capillary blood volume and, therefore, in D. Thus, the relation between changes in CBF and CMRO2 during neural activation was simulated for D values of 0.223 (baseline), 0.245 (10% increase), 0.268 (20% increase), 0.335 (50% increase), 0.446 (100% increase), and 0.669 (200% increase) mL per mL per minute.
Results
Change in Systemic Hematocrit and Body Weight During Chronic Hypoxia
The body weights before and after 7 days, 14 days, and 1 month of exposure to chronic hypoxia were 23.3±2.3 g, 22.2±2.2 g, 20.7±1.6 g, and 22.0±1.4 g, respectively. There was no significant difference in body weight among the respective measurement days. On the other hand, when control mice were housed in a normoxic chamber, body weights significantly increased over one month (day 0: 23.8±2.2 g, day 30: 26.4±2.4 g, P<0.01, N=6). Therefore, it was possible that chronic hypoxia inhibited the weight gain of mice over the month. Hematocrit was significantly higher (P<0.01) at 7 days (51.5%), 14 days (59.0%), and 1 month (68.5%) from the start of exposure to chronic hypoxia as compared with control mice (34.6%). These results were in good agreement with previous studies conducted in rats and mice under chronic hypoxia.10
Cerebral Blood Flow Response to Sensory Stimulation
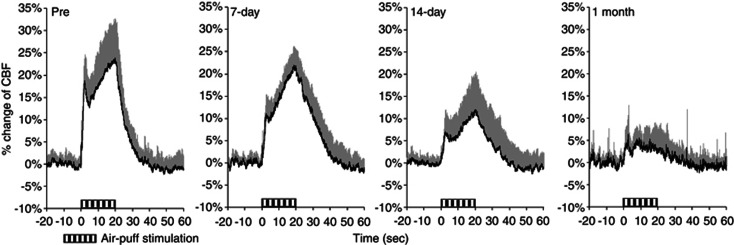
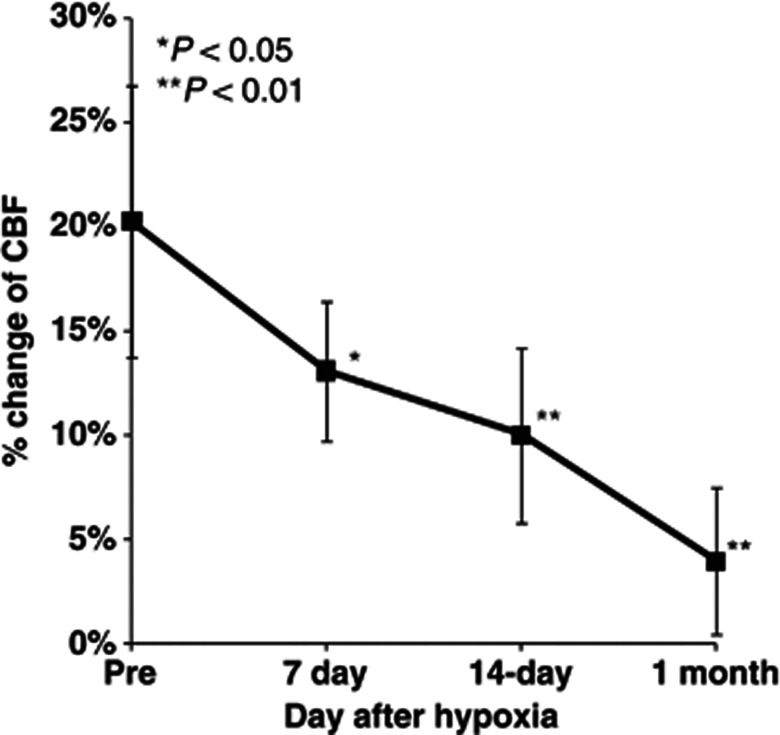
Time–response curves of the increase in CBF during whisker stimulation during 1 month of chronic hypoxia are shown in Figure 2. The mean percentage increases were 20.3%±6.8%, 13.1%±3.3%, 9.9%±4.2%, and 3.9%±4.0% before and after 7 days, 14 days, and 1 month of chronic hypoxia, respectively (Figure 3). Statistically significant differences were found at day 7 (P<0.05), day 14 (P<0.01), and 1 month (P<0.01) of chronic hypoxia, compared with that of prehypoxic control.
Figure 2.
Time–response curves for normalized increase in cerebral blood flow (CBF) response to sensory stimulation during chronic hypoxia. Horizontal bars indicate the stimulation period. These data were normalized to baseline level (20 seconds before sensory stimulation). Each response curve represents the mean of all animals at each measurement day. Error bars indicate s.d.
Figure 3.
Longitudinal cerebral blood flow (CBF) measurements under chronic hypoxia. Increase in CBF response to sensory stimulation was consistently observed at pre, 7 days, 14 days, and 1 month. Bold squares and line represent the mean of all animal data of average values at each measurement day. Error bars indicate s.d. *P<0.05, **P<0.01.
Cerebral Blood Flow Response to 5% CO2 Inhalation
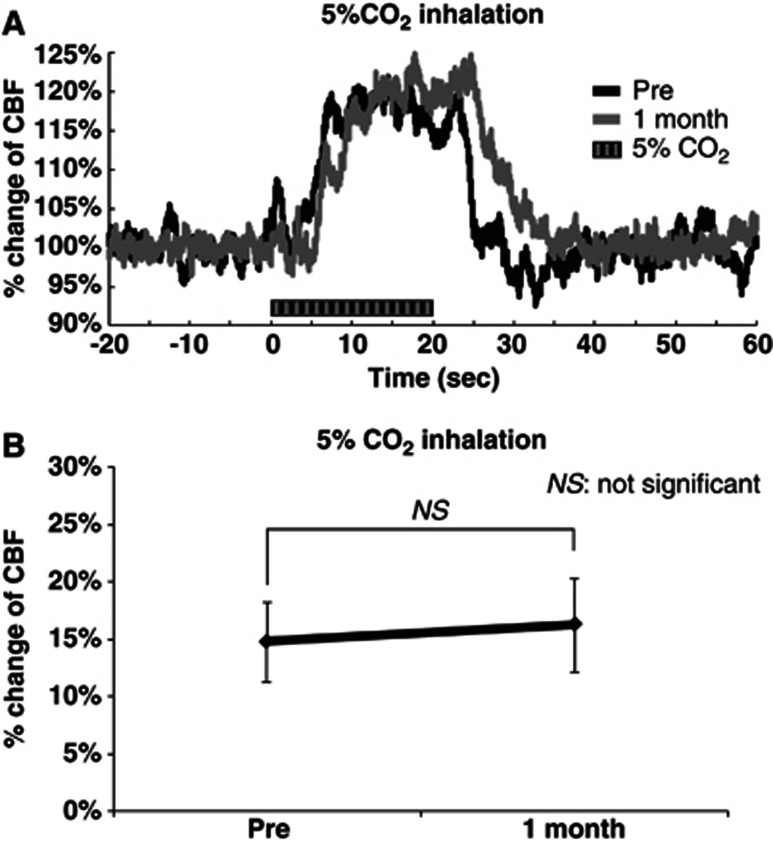
The time–response curve of the increase in CBF during 5% CO2 inhalation before chronic hypoxia was almost identical to that after 1 month of hypoxia (Figure 4A). The mean percentage increase in CBF induced by 5% CO2 inhalation was 14.8%±3.5% and 16.3%±4.0% before and 1 month after chronic hypoxia, respectively (Figure 4B). There was no significant difference in the increase in CBF between the measurements before and 1 month after chronic hypoxia.
Figure 4.
Increase in cerebral blood flow (CBF) evoked by 5% CO2 inhalation. (A) Time–response curve of increase in CBF. Time–response curves were normalized to the baseline level (20 seconds before sensory stimulation) and shown for one representative animal. Horizontal bars indicate the stimulation period. (B) Mean percentage increase in CBF within 10 to 20 seconds 5% CO2 inhalation (N=5). Error bars indicate s.d.
Neural Response to Whisker Stimulation
Figure 5 shows the representative fluorescent VSD signals evoked by a single sensory stimulation after 1 month of chronic hypoxia (Figure 5). The region of neuronal activity before chronic hypoxia was almost identical to that after 1 month of hypoxia (Figure 5A). There were no significant differences in the number of pixels between before and after 1 month of chronic hypoxia (Figure 5B).
Figure 5.
Neuronal activities evoked by sensory stimulation under chronic hypoxia condition. (A) Activation maps of voltage-sensitive dye (VSD) imaging experiment performed before (top) and 1 month (bottom) after chronic hypoxia, shown for one representative animal. Right and left frames showed VSD imagings before and immediately after sensory stimulation, respectively. (B) Summary of VSD results in five animals. There was no significant difference in the number of pixels between pre and 1 month.
Effects of Changes in Effective Diffusivity for Oxygen in the Capillary Bed (D) by Chronic Hypoxia
The relation between changes in CBF and CMRO2, corresponding to CBF multiplied by OEF, during neural activation for each D value was simulated using Hyder's model19 as shown in Figure 6. Based on the simulation results in Figure 6, a 690% increase in CBF during neuronal activation is required for a 10% increase in CMRO2 when D remained at 0.223 in spite of chronic hypoxia. As mention above, the D values increased from 0.223 to 0.466 to 0.669 after 3 weeks of chronic hypoxia as a result of a 96% to 189% increase in capillary blood volume.7 The results shown in Figure 5 indicated that neuronal activation at somatosensory cortex was quite stable throughout the 1 month of chronic hypoxia, indicating that CMRO2 was also stable. Thus, as a result of the increase in D (0.466 to 0.669) caused by chronic hypoxia, no increase in CBF is required for the 10% increase in CMRO2 (Figure 6) because, in the case of D=0.466 to 0.669, the % change in CMRO2 was already above 10%, even if CBF did not increase.
Figure 6.
Simulation result of Hyder's model. Solid and dashed lines indicated the relationship between cerebral metabolic rate of oxygen utilization (CMRO2) and cerebral blood flow (CBF) among the respective D values.
Discussion
We performed LDF measurements in awake mice maintained under chronic hypoxic conditions. Although adaptation of the baseline CBF to chronic hypoxia has been previously investigated using human and animal models, this study represents the first observation of the effects of chronic hypoxia on the hemodynamic responses in awake mice. In this work, we observed that chronic hypoxia causes a significant reduction of the increase in CBF evoked by sensory stimulation. Previous study using BOLD fMRI (blood oxygen level-dependent functional magnetic resonance imaging) showed reduced cerebrovascular response to visual stimulation in native-born high-altitude residents as compared with native-born sea-level residents.20 These results might be related to our results of changes in CBF during neural activation.
The reduction in the increase of CBF during neuronal activation appeared to lead to a reduction in the increase of the oxygen supply to the brain. To explain the reasons for the reduction of the increase in CBF during stimulation under chronic hypoxic conditions, we hypothesized that this reduction was caused by (1) cerebrovascular dysfunction, (2) neuronal dysfunction, and (3) regulation of hemodynamics to adapt to the chronic hypoxic condition. Because the hypercapnic CBF response was not reduced, vascular dilatory function was sufficiently sustained in the chronic hypoxia mice. Moreover, VSD imaging showed no attenuation of neuronal activation during sensory stimulation during the 1 month of chronic hypoxia. Based on these findings, it was clear that the reduction in the increase in functional hyperemia under chronic hypoxic conditions was not caused either by cerebrovascular dysfunction or by neuronal dysfunction in the somatosensory cortex.
As mentioned above, we have previously reported that the vasodilation induced by chronic hypoxia occurred mainly in the parenchymal capillaries, indicating the ability to adjust the diameter in response to the oxygen environment.7 Based on Hyder's model,19 the relation between changes in CBF and CMRO2, corresponding to CBF multiplied by OEF, during neural activation can be simulated for each D value, which is in proportion to capillary blood volume, as shown in Figure 6. This simulation study shows that when D increases by chronic hypoxia, an increase in CMRO2 during neural activation can be revealed without any increase in CBF. On the other hand, the oxygen content (Ca) of mice might be changed during hypoxic condition. Ca is expressed as follows:
 |
where α is the oxygen binding capacity of hemoglobin (1.39 mL/g),21 Hb is the hemoglobin concentration (g/dL), SaO2 is arterial O2 saturation, PaO2 is arterial oxygen partial pressure (mm Hg), and β is the oxygen solubility (0.00315 mL per 100 mL per mm Hg). When the hypoxic condition (8% O2) decreased PaO2 from 100 to 40 mm Hg, SaO2 was decreased from 0.92 to 0.47 (P50 of mouse=41.5 mm Hg; pH=7.40).22 The hematocrit results in our study indicated that hemoglobin was increased by about two times during chronic hypoxia. Based on these parameters, Ca remained almost unchanged under hypoxia (19.73 mL/mL blood) as compared with that under normoxia (19.50 mL/mL blood).
The adaptive regulation mechanism of CBF responses during chronic hypoxia must be associated with several factors. One possibility is the inhibition of a synthetase of a vasoactive mediator (e.g., nitric oxide, cyclooxygenase-2, and adenosine) released from neurons and glia by neural activity23, 24, 25 or by disturbing astrocyte function, which is associated with neurovascular coupling.26 Especially, nitric oxide is associated with hypoxia-inducible factor-1 activity,27, 28 suggesting that nitric oxide plays an important role in the cerebrovascular tone in chronic hypoxia and might also affect to the reduction of increase in CBF. To explore the mechanism, further experiments using synthetase inhibitors or immunostaining techniques in mice need to be performed.
Using positron emission tomography in human subjects, Mintun et al10 has shown that hemodynamic response to visual stimulation was identical between normoxia and mild acute hypoxia (fraction of inspired oxygen; FiO2 of 12%) conditions.11 These findings suggest that the neural activity-induced CBF response is determined by factors other than local requirements of oxygen. On the other hand, in the present study, the long-term low oxygen condition could be modified by neurovascular coupling, and the simulation results suggested that the reduction in the increase in CBF contributed to the balance between oxygen supply and metabolism in the brain. In other words, the hemodynamic response to neuronal activation can be modified in response to the change in their balance to energy demand. The discrepancy between acute hypoxia and chronic hypoxia could be explained as follows. A short-term exposure to hypoxia may not produce a stabilized baseline state, whereas a long-term exposure produces a newly established baseline state in which the oxygen supply-demand level can be balanced. Further experiments are needed to elucidate this slow adaptation mechanism of neurovascular coupling to changes in the oxygen environment, which involve (1) sensing the tissue oxygen state, (2) monitoring the supply-demand balance, and (3) controlling the magnification factor of CBF changes in neurovascular coupling.
In summary, we found a reduction in the increase in CBF evoked by neuronal activation in mice occurring during 1 month of chronic hypoxia. The results of the simulation using Hyder's model indicated that a slight increase in CBF caused a large increase in oxygen supply to the brain under increased D value conditions. The adaptation mechanisms underlying the reduction in the increase of CBF under chronic hypoxia remain to be identified. To explore these mechanisms, further experiments using synthetase inhibitors or immunostaining techniques on mice should be performed.
The authors declare no conflict of interest.
References
- LaManna JC, Chavez JC, Pichiule P. Structural and functional adaptation to hypoxia in the rat brain. J Exp Biol. 2004;207:3163–3169. doi: 10.1242/jeb.00976. [DOI] [PubMed] [Google Scholar]
- Ainslie PN, Ogoh S. Regulation of cerebral blood flow in mammals during chronic hypoxia: a matter of balance. Exp Physiol. 2010;95:251–262. doi: 10.1113/expphysiol.2008.045575. [DOI] [PubMed] [Google Scholar]
- Wilson M, Newman HS, Imray C. The cerebral effects of ascent to high altitudes. Lancet Neurol. 2009;8:175–191. doi: 10.1016/S1474-4422(09)70014-6. [DOI] [PubMed] [Google Scholar]
- Jensen JB, Sperling B, Severinghaus JW, Lassen NA. Augmented hypoxic cerebral vasodilation in men during 5 days at 3,810 m altitude. J Appl Physiol. 1996;80:1214–1218. doi: 10.1152/jappl.1996.80.4.1214. [DOI] [PubMed] [Google Scholar]
- Pichiule P, LaManna JC. Angiopoietin-2 and rat brain capillary remodeling during adaptation and deadaptation to prolonged mild hypoxia. J Appl Physiol. 2002;93:1131–1139. doi: 10.1152/japplphysiol.00318.2002. [DOI] [PubMed] [Google Scholar]
- Boero JA, Ascher J, Arregui A, Rovainen C, Woolsey TA. Increased brain capillaries in chronic hypoxia. J Appl Physiol. 1999;86:1211–1219. doi: 10.1152/jappl.1999.86.4.1211. [DOI] [PubMed] [Google Scholar]
- Yoshihara K, Takuwa H, Kanno I, Okawa S, Yamada Y, Masamoto K. 3D analysis of intracortical microvasculature during chronic hypoxia in mouse brains. Adv Exp Med Biol. 2013;765:357–363. doi: 10.1007/978-1-4614-4989-8_50. [DOI] [PubMed] [Google Scholar]
- Xu K, Lamanna JC. Chronic hypoxia and the cerebral circulation. J Appl Physiol. 2006;100:725–730. doi: 10.1152/japplphysiol.00940.2005. [DOI] [PubMed] [Google Scholar]
- Ndubuizu OI, Tsipis CP, Li A, LaManna JC. Hypoxia-inducible factor-1 (HIF-1)-independent microvascular angiogenesis in the aged rat brain. Brain Res. 2010;1366:101–109. doi: 10.1016/j.brainres.2010.09.064. [DOI] [PMC free article] [PubMed] [Google Scholar]
- Mintun MA, Lundstrom BN, Snyder AZ, Vlassenko AG, Shulman GL, Raichle ME. Blood flow and oxygen delivery to human brain during functional activity: theoretical modeling and experimental data. Proc Natl Acad Sci USA. 2001;98:6859–6864. doi: 10.1073/pnas.111164398. [DOI] [PMC free article] [PubMed] [Google Scholar]
- Lindauer U, Gethmann J, Kühl M, Kohl-Bareis M, Dirnagl U. Neuronal activity-induced changes of local cerebral microvascular blood oxygenation in the rat: effect of systemic hyperoxia or hypoxia. Brain Res. 2003;975:135–140. doi: 10.1016/s0006-8993(03)02602-7. [DOI] [PubMed] [Google Scholar]
- Sicard KM, Duong TQ. Effects of hypoxia, hyperoxia, and hypercapnia on baseline and stimulus-evoked BOLD, CBF, and CMRO2 in spontaneously breathing animals. Neuroimage. 2005;25:850–858. doi: 10.1016/j.neuroimage.2004.12.010. [DOI] [PMC free article] [PubMed] [Google Scholar]
- Takuwa H, Matsuura T, Bakalova R, Obata T, Kanno I. Contribution of nitric oxide to cerebral blood flow regulation under hypoxia in rats. J Physiol Sci. 2010;60:399–406. doi: 10.1007/s12576-010-0108-9. [DOI] [PMC free article] [PubMed] [Google Scholar]
- Tomita Y, Kubis N, Calando Y, Tran Dinh A, Meric P, Seylaz J, et al. Long-term in vivo investigation of mouse cerebral microcirculation by fluorescence confocal microscopy in the area of focal ischemia. J Cereb Blood Flow Metab. 2005;25:858–867. doi: 10.1038/sj.jcbfm.9600077. [DOI] [PubMed] [Google Scholar]
- Yoshida T, Sakagami M, Katura T, Yamazaki K, Tanaka S, Iwamoto M, et al. Anisotropic spatial coherence of ongoing and spontaneous activities in auditory cortex. Neurosci Res. 2008;61:49–55. doi: 10.1016/j.neures.2008.01.007. [DOI] [PubMed] [Google Scholar]
- Takuwa H, Autio J, Nakayama H, Matsuura T, Obata T, Okada E, et al. Reproducibility and variance of a stimulation-induced hemodynamic response in barrel cortex of awake behaving mice. Brain Res. 2011;1369:103–111. doi: 10.1016/j.brainres.2010.11.007. [DOI] [PubMed] [Google Scholar]
- Limbourg FP, Huang Z, Plumier JC, Simoncini T, Fujioka M, Tuckermann J, et al. Rapid nontranscriptional activation of endothelial nitric oxide synthase mediates increased cerebral blood flow and stroke protection by corticosteroids. J Clin Invest. 2002;110:1729–1738. doi: 10.1172/JCI15481. [DOI] [PMC free article] [PubMed] [Google Scholar]
- Mizuma H, Shukuri M, Hayashi T, Watanabe Y, Onoe H. Establishment of in vivo brain imaging method in conscious mice. J Nucl Med. 2010;51:1068–1075. doi: 10.2967/jnumed.110.075184. [DOI] [PubMed] [Google Scholar]
- Hyder F, Shulman RG, Rothman DL. A model for the regulation of cerebral oxygen delivery. J Appl Physiol. 1998;85:554–564. doi: 10.1152/jappl.1998.85.2.554. [DOI] [PubMed] [Google Scholar]
- Yan X, Zhang J, Gong Q, Weng X. Cerebrovascular reactivity among native-raised high altitude residents: an fMRI study. BMC Neurosci. 2011;12:94–104. doi: 10.1186/1471-2202-12-94. [DOI] [PMC free article] [PubMed] [Google Scholar]
- International Committee for Standardization in Haematology. Recommendations for haemoglobinometry in human blood. Br J Haemat. 1967;13 (Suppl:71–75. doi: 10.1111/j.1365-2141.1967.tb00751.x. [DOI] [PubMed] [Google Scholar]
- Gray LH, Steadman JM. Determination of the oxyhaemoglobin dissociation curves for mouse and rat blood. J Physiol. 1964;175:161–171. doi: 10.1113/jphysiol.1964.sp007509. [DOI] [PMC free article] [PubMed] [Google Scholar]
- Yang G, Zhang Y, Ross ME, Iadecola C. Attenuation of activity-induced increases in cerebellar blood flow in mice lacking neuronal nitric oxide synthase. Am J Physiol Heart Circ Physiol. 2003;285:298–304. doi: 10.1152/ajpheart.00043.2003. [DOI] [PubMed] [Google Scholar]
- Bakalova R, Matsuura T, Kanno I. The cyclooxygenase inhibitors indomethacin and rofecoxib reduce regional cerebral blood flow evoked by somatosensory stimulation in rats. Exp Biol Med. 2002;227:465–473. doi: 10.1177/153537020222700710. [DOI] [PubMed] [Google Scholar]
- Ko KR, Ngai AC, Winn RH. Role of adenosine in regulation of regional cerebral blood flow in sensory cortex. Am J Physiol. 1990;259:1703–1708. doi: 10.1152/ajpheart.1990.259.6.H1703. [DOI] [PubMed] [Google Scholar]
- Attwell D, Buchan AM, Charpak S, Lauritzen M, Macvicar BA, Newman EA. Glial and neuronal control of brain blood flow. Nature. 2010;468:232–243. doi: 10.1038/nature09613. [DOI] [PMC free article] [PubMed] [Google Scholar]
- Agani FH, Puchowicz M, Chavez JC, Pichiule P, LaManna J. Role of nitric oxide in the regulation of HIF-1alpha expression during hypoxia. Am J Physiol Cell Physiol. 2002;283:178–186. doi: 10.1152/ajpcell.00381.2001. [DOI] [PubMed] [Google Scholar]
- Cattaneo MG, Cappellini E, Benfante R, Ragni M, Omodeo-Salè F, Nisoli E, et al. Chronic deficiency of nitric oxide affects hypoxia inducible factor-1α (HIF-1α) stability and migration in human endothelial cells. PLoS One. 2011;6:e29680. doi: 10.1371/journal.pone.0029680. [DOI] [PMC free article] [PubMed] [Google Scholar]


